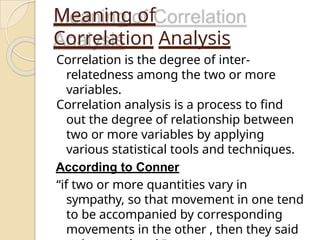
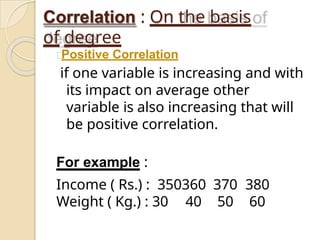
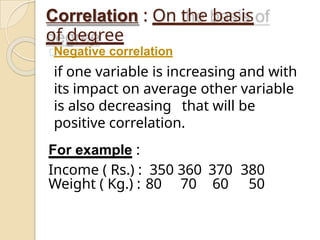
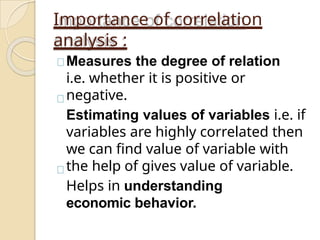
Correlatio
n Analysis
Dr.S.Shyamala, AP/Maths
Mrs.G.Nandhini AP/Maths
Excel Engineering College (Autonomous)
Komarapalayam
Meaning of
Correlation Analysis
Correlation is the degree of inter-
relatedness among the two or more
variables.
Correlation analysis is a process to find
out the degree of relationship between
two or more variables by applying
various statistical tools and techniques.
According to Conner
“if two or more quantities vary in
sympathy, so that movement in one tend
to be accompanied by corresponding
movements in the other , then they said
Three Stages to solve
correlation problem :
Determination of relationship, if
yes, measure it.
Significance of correlation.
Establishing the cause and
effect relationship, if any.
Uses of Correlation
Analysis
It is used in deriving the degree
and direction of relationship
within the variables.
It is used in reducing the range
of uncertainty in matter of
prediction.
It I used in presenting the
average relationship between
any two variables through a
single value of coefficient of
Uses of Correlation
Analysis
In the field of science and
philosophy these methods are used
for making progressive
conclusions.
In the field of nature also, it is used
in observing the multiplicity of the
inter related forces.
Types of correlation
On the basis
of degree of
correlation
On the basis of
number of
variables
On the basis
of
linearity
•Positive
correlatio
n
•Negative
correlatio
n
•Simple
correlatio
n
•Partial
correlation
•Multiple
correlatio
n
•Linear
correlatio
n
•Non –
linear
correlation
Correlation : On the basis
of degree
Positive Correlation
if one variable is increasing and with
its impact on average other
variable is also increasing that will
be positive correlation.
For example :
Income ( Rs.) : 350360 370 380
Weight ( Kg.) : 30 40 50 60
Correlation : On the basis
of degree
Negative correlation
if one variable is increasing and with
its impact on average other variable
is also decreasing that will be
positive correlation.
For example :
Income ( Rs.) : 350 360 370 380
Weight ( Kg.) : 80 70 60 50
Correlation : On the basis of
number of variables
Simple correlation
Correlation is said to be simple
when only two variables are
analyzed.
For example :
Correlation is said to be simple when
it is done between demand and
supply or we can say income and
expenditure etc.
Correlation : On the basis
of number of variables
Partial correlation :
When three or more variables are
considered for analysis but only
two influencing variables are
studied and rest influencing
variables are kept constant.
For example :
Correlation analysis is done with
demand, supply and income. Where
income is kept constant.
Correlation : On the basis of
number of variables
Multiple correlation :
In case of multiple correlation
three or more variables are
studied simultaneously.
For example :
Rainfall, production of rice and price
of rice are studied simultaneously
will be known are multiple
correlation.
Correlation : On the basis of
linearity
Linear correlation :
If the change in amount of one
variable tends to make changes in
amount of other variable bearing
constant changing ratio it is said to
be linear correlation.
For example :
Income ( Rs.) : 350 360 370 380
Weight ( Kg.) : 30 40 50 60
Correlation : On the basis
of linearity
Non - Linear correlation :
If the change in amount of one
variable tends to make changes in
amount of other variable but not
bearing constant changing ratio it is
said to be non - linear correlation.
For example :
Income ( Rs.) : 320 360 410 490
Weight ( Kg.) : 21 33 49 56
Importance of correlation
analysis :
Measures the degree of relation
i.e. whether it is positive or
negative.
Estimating values of variables i.e. if
variables are highly correlated then
we can find value of variable with
the help of gives value of variable.
Helps in understanding
economic behavior.
Correlation and
Causation
The correlation may be due to
pure chance, especially in a small
sample.
Both the correlated variables may
be influenced by one or more
other variables.
Both the variables may be mutually
influencing each other so that
Conditions under Probable
error :
 if the value of r is less than the
probable error there is no evidence
of correlation, i.e. the value of r is
not at all significant.
 If the value of r is more than six
times the probable error, the
coefficient of correlation is
practically certain i.e. the value of r
is significant.
Conditions under Probable
error
By adding and subtracting the value
of probable error from the
coefficient of correlation we get the
upper and lower limits, between
correlation lies.
P = r+ P.E.( upper limit )
P = r- P.E. ( lower
limit )
Coefficient of
Determination :
Coefficient of determination also helps
in interpreting the value of coefficient
of correlation. Square of value of
correlation
is used to find out the proportionate
relationship or dependence of
dependent variable on independent
variable. For e.g. r= 0.9 then r2 = .81 or
81% dependence of dependent
variable on independent
variable
.
Coefficient of
Determination =
Explained
variation
Total variance
References :
S. P. Gupta
S. C. Gupta
www.wikipedia.or
g
Mr. Kohli
Mr. D. Patri

Bivariate Random Variable Correlation Analysis

  • 1.
    Correlatio n Analysis Dr.S.Shyamala, AP/Maths Mrs.G.NandhiniAP/Maths Excel Engineering College (Autonomous) Komarapalayam
  • 2.
    Meaning of Correlation Analysis Correlationis the degree of inter- relatedness among the two or more variables. Correlation analysis is a process to find out the degree of relationship between two or more variables by applying various statistical tools and techniques. According to Conner “if two or more quantities vary in sympathy, so that movement in one tend to be accompanied by corresponding movements in the other , then they said
  • 3.
    Three Stages tosolve correlation problem : Determination of relationship, if yes, measure it. Significance of correlation. Establishing the cause and effect relationship, if any.
  • 4.
    Uses of Correlation Analysis Itis used in deriving the degree and direction of relationship within the variables. It is used in reducing the range of uncertainty in matter of prediction. It I used in presenting the average relationship between any two variables through a single value of coefficient of
  • 5.
    Uses of Correlation Analysis Inthe field of science and philosophy these methods are used for making progressive conclusions. In the field of nature also, it is used in observing the multiplicity of the inter related forces.
  • 6.
    Types of correlation Onthe basis of degree of correlation On the basis of number of variables On the basis of linearity •Positive correlatio n •Negative correlatio n •Simple correlatio n •Partial correlation •Multiple correlatio n •Linear correlatio n •Non – linear correlation
  • 7.
    Correlation : Onthe basis of degree Positive Correlation if one variable is increasing and with its impact on average other variable is also increasing that will be positive correlation. For example : Income ( Rs.) : 350360 370 380 Weight ( Kg.) : 30 40 50 60
  • 8.
    Correlation : Onthe basis of degree Negative correlation if one variable is increasing and with its impact on average other variable is also decreasing that will be positive correlation. For example : Income ( Rs.) : 350 360 370 380 Weight ( Kg.) : 80 70 60 50
  • 9.
    Correlation : Onthe basis of number of variables Simple correlation Correlation is said to be simple when only two variables are analyzed. For example : Correlation is said to be simple when it is done between demand and supply or we can say income and expenditure etc.
  • 10.
    Correlation : Onthe basis of number of variables Partial correlation : When three or more variables are considered for analysis but only two influencing variables are studied and rest influencing variables are kept constant. For example : Correlation analysis is done with demand, supply and income. Where income is kept constant.
  • 11.
    Correlation : Onthe basis of number of variables Multiple correlation : In case of multiple correlation three or more variables are studied simultaneously. For example : Rainfall, production of rice and price of rice are studied simultaneously will be known are multiple correlation.
  • 12.
    Correlation : Onthe basis of linearity Linear correlation : If the change in amount of one variable tends to make changes in amount of other variable bearing constant changing ratio it is said to be linear correlation. For example : Income ( Rs.) : 350 360 370 380 Weight ( Kg.) : 30 40 50 60
  • 13.
    Correlation : Onthe basis of linearity Non - Linear correlation : If the change in amount of one variable tends to make changes in amount of other variable but not bearing constant changing ratio it is said to be non - linear correlation. For example : Income ( Rs.) : 320 360 410 490 Weight ( Kg.) : 21 33 49 56
  • 14.
    Importance of correlation analysis: Measures the degree of relation i.e. whether it is positive or negative. Estimating values of variables i.e. if variables are highly correlated then we can find value of variable with the help of gives value of variable. Helps in understanding economic behavior.
  • 15.
    Correlation and Causation The correlationmay be due to pure chance, especially in a small sample. Both the correlated variables may be influenced by one or more other variables. Both the variables may be mutually influencing each other so that
  • 16.
    Conditions under Probable error:  if the value of r is less than the probable error there is no evidence of correlation, i.e. the value of r is not at all significant.  If the value of r is more than six times the probable error, the coefficient of correlation is practically certain i.e. the value of r is significant.
  • 17.
    Conditions under Probable error Byadding and subtracting the value of probable error from the coefficient of correlation we get the upper and lower limits, between correlation lies. P = r+ P.E.( upper limit ) P = r- P.E. ( lower limit )
  • 18.
    Coefficient of Determination : Coefficientof determination also helps in interpreting the value of coefficient of correlation. Square of value of correlation is used to find out the proportionate relationship or dependence of dependent variable on independent variable. For e.g. r= 0.9 then r2 = .81 or 81% dependence of dependent variable on independent variable . Coefficient of Determination = Explained variation Total variance
  • 19.
    References : S. P.Gupta S. C. Gupta www.wikipedia.or g Mr. Kohli Mr. D. Patri