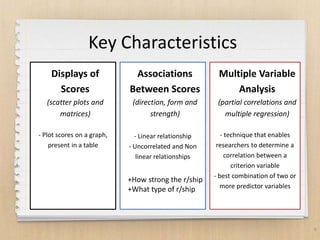
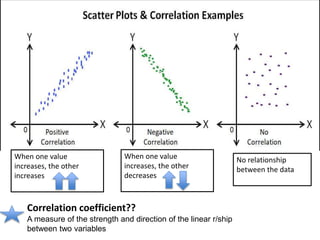
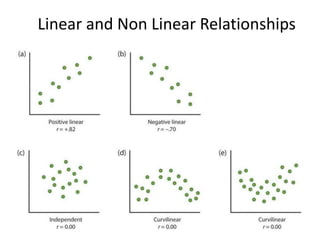
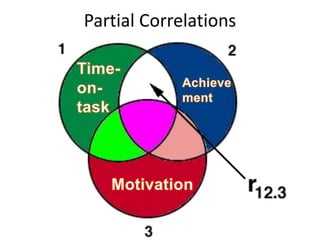
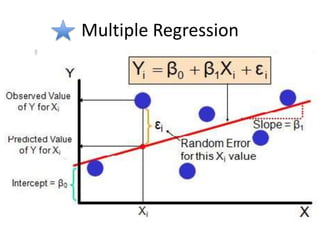
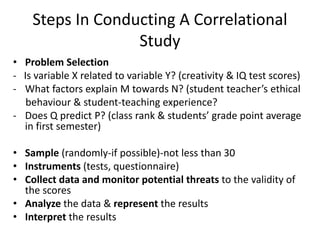
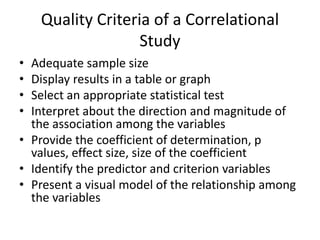
CORRELATIONAL
DESIGNS
By: Faridah Hanim Bt Jasmon
2017998003
Research designs
Researchdesigns
Historical Development
1895 Karl Pearson
develops correlation
formula
1897 Yule develops
solutions for
correlating two, three
and four variables
1935 Fisher pioneers
significance testing and
analysis of variance
1963 Campbell and
Stanley write on
experimental and
quasi-experimental
designs
1970’s and 1980’s
computers give the
ability to statistically
control variables and
do multiple regression
 When you want to relate
two or more variables to see
if they influence each other.
 Use this design when you
know and can apply
statistical knowledge based
on calculating the correlation
statistical test.
3
 correlate two or more variables
 collect data at one point in time
 obtain at least two scores for each
individual in the group
 often use the phrase ‘degree of
association between two
variables’
4
Types of Correlational Designs
 predict likely outcomes
 identify one or more predictor
variable and a criterion
 measure the predictor variable(s)
at one point in time and the
criterion variable at a later point
in time
 forecast future performance –
mention ‘predict’ some outcome
5
Types of Correlational Designs
Predictor variable: variable that is used to make the prediction
Criterion variable: variable about which the prediction is made
Key Characteristics
Displays of
Scores
(scatter plots and
matrices)
- Plot scores on a graph,
present in a table
Associations
Between Scores
(direction, form and
strength)
- Linear relationship
- Uncorrelated and Non
linear relationships
Multiple Variable
Analysis
(partial correlations and
multiple regression)
- technique that enables
researchers to determine a
correlation between a
criterion variable
- best combination of two or
more predictor variables
6
+How strong the r/ship
+What type of r/ship
When one value
increases, the other
increases
When one value
increases, the other
decreases
No relationship
between the data
Correlation coefficient??
A measure of the strength and direction of the linear r/ship
between two variables
Correlation Matrix
Linear and Non Linear Relationships
Partial Correlations
Multiple Regression
Steps In Conducting A Correlational
Study
• Problem Selection
- Is variable X related to variable Y? (creativity & IQ test scores)
- What factors explain M towards N? (student teacher’s ethical
behaviour & student-teaching experience?
- Does Q predict P? (class rank & students’ grade point average
in first semester)
• Sample (randomly-if possible)-not less than 30
• Instruments (tests, questionnaire)
• Collect data and monitor potential threats to the validity of
the scores
• Analyze the data & represent the results
• Interpret the results
Quality Criteria of a Correlational
Study
• Adequate sample size
• Display results in a table or graph
• Select an appropriate statistical test
• Interpret about the direction and magnitude of
the association among the variables
• Provide the coefficient of determination, p
values, effect size, size of the coefficient
• Identify the predictor and criterion variables
• Present a visual model of the relationship among
the variables
14
Conclusion
 Help explain important human behaviours
 Collect data as fast as possible
 Not involving lots of participants
THE END…

CORRELATIONAL DESIGNS

  • 1.
    CORRELATIONAL DESIGNS By: Faridah HanimBt Jasmon 2017998003 Research designs Researchdesigns
  • 2.
    Historical Development 1895 KarlPearson develops correlation formula 1897 Yule develops solutions for correlating two, three and four variables 1935 Fisher pioneers significance testing and analysis of variance 1963 Campbell and Stanley write on experimental and quasi-experimental designs 1970’s and 1980’s computers give the ability to statistically control variables and do multiple regression
  • 3.
     When youwant to relate two or more variables to see if they influence each other.  Use this design when you know and can apply statistical knowledge based on calculating the correlation statistical test. 3
  • 4.
     correlate twoor more variables  collect data at one point in time  obtain at least two scores for each individual in the group  often use the phrase ‘degree of association between two variables’ 4 Types of Correlational Designs
  • 5.
     predict likelyoutcomes  identify one or more predictor variable and a criterion  measure the predictor variable(s) at one point in time and the criterion variable at a later point in time  forecast future performance – mention ‘predict’ some outcome 5 Types of Correlational Designs Predictor variable: variable that is used to make the prediction Criterion variable: variable about which the prediction is made
  • 6.
    Key Characteristics Displays of Scores (scatterplots and matrices) - Plot scores on a graph, present in a table Associations Between Scores (direction, form and strength) - Linear relationship - Uncorrelated and Non linear relationships Multiple Variable Analysis (partial correlations and multiple regression) - technique that enables researchers to determine a correlation between a criterion variable - best combination of two or more predictor variables 6 +How strong the r/ship +What type of r/ship
  • 7.
    When one value increases,the other increases When one value increases, the other decreases No relationship between the data Correlation coefficient?? A measure of the strength and direction of the linear r/ship between two variables
  • 8.
  • 9.
    Linear and NonLinear Relationships
  • 10.
  • 11.
  • 12.
    Steps In ConductingA Correlational Study • Problem Selection - Is variable X related to variable Y? (creativity & IQ test scores) - What factors explain M towards N? (student teacher’s ethical behaviour & student-teaching experience? - Does Q predict P? (class rank & students’ grade point average in first semester) • Sample (randomly-if possible)-not less than 30 • Instruments (tests, questionnaire) • Collect data and monitor potential threats to the validity of the scores • Analyze the data & represent the results • Interpret the results
  • 13.
    Quality Criteria ofa Correlational Study • Adequate sample size • Display results in a table or graph • Select an appropriate statistical test • Interpret about the direction and magnitude of the association among the variables • Provide the coefficient of determination, p values, effect size, size of the coefficient • Identify the predictor and criterion variables • Present a visual model of the relationship among the variables
  • 14.
    14 Conclusion  Help explainimportant human behaviours  Collect data as fast as possible  Not involving lots of participants THE END…