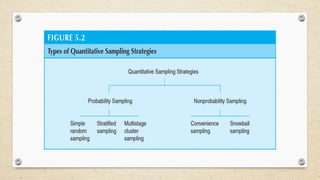
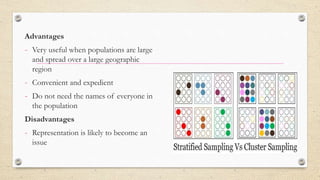
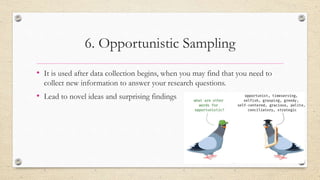
Systematic random sampling is a type of probability sampling where units from a larger population are selected according to a random starting point and a fixed periodic interval. This method is simple, convenient, and economical compared to simple random sampling. It involves randomly selecting a starting point between 1 and the sampling interval, then selecting every kth unit thereafter. While it provides unbiased estimates, it could lead to over or underrepresentation if the population has a hidden periodic pattern.
The document discusses sampling in research. It defines a sample as a small representative segment of a population from which inferences can be drawn about the larger population with minimal resources. Factors that influence sample size include population characteristics, study design, and desired statistical power and significance level. Common sampling techniques include simple random sampling, systematic random sampling, stratified random sampling, and cluster random sampling. Sample size calculations depend on the type of data and study design.
This document outlines the typical research process, which includes:
1. Formulating a research problem and reviewing relevant literature.
2. Developing hypotheses to test.
3. Designing the research study.
4. Collecting and analyzing data.
5. Interpreting the results, testing hypotheses, and generalizing conclusions in a final research report.
Feedback loops allow controlling the process and adjusting based on results. The goal is to gather relevant evidence efficiently to address the research question.
Sampling Variability And The Precision Of A Sample by Dr Sindhu Almas copy.pptxDrSindhuAlmas
What use is all this stuff about variability?
Sampling – the big idea
Sampling In Practice
Sampling – the big idea
Need For Sampling
Disadvantages Of Sampling
Types Of Sampling
Factors Affecting Sample Size
Sampling Distribution
Calculating A Confidence Interval Using Software
methods of data collection
,
types/sources of data
,
interview method
,
collection of primary data
,
observation method
,
collection of data through questionnaires
,
collection of secondary data
Systematic sampling is a technique where every nth sample is selected from a list to be included in the overall sample. This is useful when subjects are logically arranged like alphabetically or geographically. The procedure is easy to do manually and results are generally representative of the population unless a characteristic repeats every nth individual. To conduct systematic sampling, a starting number and interval are selected, where the interval is the constant difference between consecutive samples. This sampling method is illustrated through an example where every 8th individual is selected from a population of 100 to obtain a sample of 12.
This document discusses non-probability sampling techniques. It defines key terms like population, sample, probability sampling, and non-probability sampling. It then describes several common non-probability sampling methods: convenience sampling, which uses readily available participants; snowball sampling, which uses referrals from initial participants to recruit more; purposive sampling, which selects participants based on predefined criteria; and quota sampling, which sets quotas for participant demographics to be filled. The document notes advantages and disadvantages of these non-probability methods.
The document discusses hypothesis testing and the scientific research process. It begins by defining a hypothesis as a tentative statement about the relationship between two or more variables that can be tested. It then outlines the typical steps in the scientific research process, which includes forming a question, background research, creating a hypothesis, experiment design, data collection, analysis, conclusions, and communicating results. Finally, it provides details on characteristics of a strong hypothesis, the process of hypothesis testing through statistical analysis, and setting up an experiment for hypothesis testing, including defining hypotheses, significance levels, sample size determination, and calculating standard deviation.
In many different types of researches we are interested in learning about large groups of people who all have something in common that is called 'target population' Researchers commonly study traits or characteristics (parameters) of populations in their studies. It is more or less impossible to study the whole population therefore researches need to select a sample or sub-group of the population that is likely to be representative of the target population. Therefore, the researcher would select individuals from which to collect the data which is called sample. Sampling is the method of selecting individuals from the population. The method of sampling is a key factor for generalizing the results of sample into a population. There are two main methods of sampling including probable and non-probable sampling techniques. In probable sampling method the sample, should be as representative as possible of the population which leads to more confident to generalize the results to the target population.
Another important question that must be answered in all sample surveys is "How many participants should be chosen for a survey"? An under-sized study can be a waste of resources since it may not produce useful results while an over-sized study uses more resources than necessary. Determining the sample size should be based on type of research and its objectives as well as required statistical methods. There are different methods for determining the sample size applying various formulas to calculate a sample size.
This document provides an introduction to statistics and statistical concepts. It covers topics such as course objectives, purposes of statistics, population and sampling, types of data and variables, levels of measurement, and nominal level of measurement. The key points are that statistics can describe, summarize, predict and identify relationships in data, and that there are different levels of variables from nominal to ratio scales.
Non-sampling errors occur in surveys and censuses due to factors other than sampling and can happen at various stages:
- Specification errors occur during planning due to issues like incomplete population coverage or ambiguous questions.
- Ascertainment errors happen during data collection due to inaccurate recording or ambiguous instructions.
- Tabulation errors take place during analysis through mistakes in coding, analysis or presentation of results.
Some common sources of non-sampling errors include lack of proper planning, incomplete or inaccurate responses, ambiguous definitions, and errors in data processing. Measures like pre-testing questionnaires, hiring experienced staff, and cross-checking data can help reduce non-sampling errors.
hypothesis testing-tests of proportions and variances in six sigmavdheerajk
The document provides information about various statistical hypothesis tests that can be used to analyze data and test if process improvements have resulted in significant changes. It discusses one proportion tests, two proportions tests, one-variance tests, two-variances tests, and how to determine which test to use based on the type of data and questions being asked. Examples are also provided of applying these tests using Minitab software to analyze sample data and test hypotheses about changes between before and after process improvement situations. The document aims to help determine the appropriate statistical tests for validating improvements in processes.
This document discusses intervention studies and randomized controlled trials. It begins by defining causality using the counterfactual model and comparing exposed and unexposed groups. It then describes the importance of randomization in intervention studies, noting that randomization helps ensure the unexposed group is a valid control, controls for unknown confounders, facilitates blinding, and provides a foundation for statistical tests. The document discusses types of intervention studies, issues like compliance, analysis approaches like intention-to-treat, and ethical considerations.
Sampling is necessary for the researchers and nursing students....
This PPT is basically related to 4th year nursing students....
It include sampling, sample, type of population, type of sampling technique and sampling error...
Sampling is a process of selecting sample...
Sample is a representative unit of the population...
This document discusses systematic sampling, which is a statistical method for selecting elements from an ordered sampling frame. It involves randomly selecting the first element and then selecting every kth element thereafter, where k is the sampling interval calculated by dividing the population size by the sample size. For example, a study with a population of 135 students needing a sample of 15 would use a sampling interval of 9. The advantages are that it is simple to use, saves time and cost, and checks for bias. The disadvantages are the possibility of missing vital information and not being able to reach the required sample size if the population is too small.
This document discusses various study designs used in medical research. It describes descriptive study designs like case reports, case series, ecological studies, and cross-sectional studies which are used to describe characteristics of subjects. It also describes analytical study designs like case-control studies and cohort studies which are used to analyze associations between exposures and outcomes. Experimental study designs like randomized controlled trials are also discussed which are used to evaluate interventions. Key aspects of each study design like their strengths, weaknesses and steps are highlighted.
This document discusses various methods for collecting both primary and secondary data for research purposes. It outlines five key factors to consider before primary data collection: objectives, scope, quantitative expression, collection techniques, and unit of collection. Primary data collection methods include direct interviews, indirect oral research through enumerators, mailed questionnaires, and observation. Secondary data are pre-existing data collected by others, which can be published or unpublished sources like government reports. The document compares advantages and disadvantages of different primary and secondary data collection methods.
Learn the process of Research.
Research process consists of a series of actions or steps necessary to carry out research. It guides a researcher to conduct research in a planned and organized sequence.
Unit 3 random number generation, random-variate generationraksharao
This document discusses random number generation and random variate generation. It covers:
1) Properties of random numbers such as uniformity, independence, maximum density, and maximum period.
2) Techniques for generating pseudo-random numbers such as the linear congruential method and combined linear congruential generators.
3) Tests for random numbers including Kolmogorov-Smirnov, chi-square, and autocorrelation tests.
4) Random variate generation techniques like the inverse transform method, acceptance-rejection technique, and special properties for distributions like normal, lognormal, and Erlang.
Handling missing data with expectation maximization algorithmLoc Nguyen
Expectation maximization (EM) algorithm is a powerful mathematical tool for estimating parameter of statistical models in case of incomplete data or hidden data. EM assumes that there is a relationship between hidden data and observed data, which can be a joint distribution or a mapping function. Therefore, this implies another implicit relationship between parameter estimation and data imputation. If missing data which contains missing values is considered as hidden data, it is very natural to handle missing data by EM algorithm. Handling missing data is not a new research but this report focuses on the theoretical base with detailed mathematical proofs for fulfilling missing values with EM. Besides, multinormal distribution and multinomial distribution are the two sample statistical models which are concerned to hold missing values.
This document provides information on measures of central tendency and dispersion in statistics. It defines the mode, median and mean as common measures of central tendency, and how to calculate each one. For measures of dispersion, it discusses standard deviation, range, quartile deviation and variance. It provides examples of calculating each measure and their appropriate uses and limitations. The document is from an online statistics service that provides statistical analysis and calculations.
The document discusses methods for calculating sample sizes for various study designs, including measuring prevalence, cross-sectional studies, case-control studies, and clinical trials. It provides formulas and examples for calculating sample sizes needed to measure a dichotomous outcome and a continuous outcome. For measuring prevalence, the sample size depends on the expected prevalence rate, desired precision level, and confidence interval. For studies comparing two groups, the sample size depends on the event rates in each group and the desired power and significance level to detect a difference between groups.
Sampling is a process used in statistical analysis where a subset of a population, or sample, is used to estimate characteristics of the whole population. There are two main types of sampling: probability sampling, where every member of the population has a known chance of being selected; and non-probability sampling, where not every member has an equal chance of selection. Some common sampling techniques include simple random sampling, systematic random sampling, stratified random sampling, multi-stage random sampling, convenience sampling, quota sampling, and snowball sampling. The goal of sampling is to select a group that accurately represents the larger population to allow researchers to make inferences about the population.
Categorical data analysis refers to methods for analyzing discrete or categorical response variables. Common distributions for categorical data include the Bernoulli, binomial, Poisson, and multinomial distributions. Chi-square tests can be used to test goodness of fit, independence, and homogeneity for categorical data. The chi-square test statistic compares observed and expected frequencies in one or more categories. A larger chi-square value provides more evidence to reject the null hypothesis of a good fit or independence between variables.
The document discusses key concepts in research methodology including sampling, population, and bias. It defines population as the entire group of entities being studied and sampling as selecting a subset of units from the population. Probability and non-probability sampling methods are described. Probability methods like random, stratified, and cluster sampling aim for representativeness while non-probability methods like convenience sampling do not. Sources of error like non-sampling bias and sampling bias are also outlined.
This document discusses various methods for sampling populations and collecting data, including:
- Probability and non-probability sampling techniques like simple random sampling, stratified sampling, and cluster sampling.
- Data collection methods like questionnaires, literature reviews, observation, and interviews. It provides details on constructing questionnaires, conducting observations, and potential sources of error.
Sampling types-presentation-business researchHareesh M
This document discusses different sampling techniques used in research. It explains that sampling involves selecting a subset of a population to gather information about the whole population in a more efficient manner than a complete census. The key types of sampling discussed are probability sampling methods like simple random sampling, systematic sampling, and stratified sampling which aim to select representative samples, as well as non-probability methods like convenience sampling and snowball sampling which rely on availability and referrals. Factors that influence sample representativeness and potential sources of error in sampling are also outlined.
This document discusses sampling methods used in research. It defines key terms like population, sample, and sampling. There are two main types of sampling - probability sampling and non-probability sampling. Probability sampling uses random selection to ensure each member of the population has an equal chance of being selected, allowing for generalization of results. Common probability methods are simple random sampling, systematic sampling, stratified sampling, and cluster sampling. Non-probability sampling relies on personal judgment and does not allow for generalization beyond the sample. Common non-probability methods are convenience sampling, purposive sampling, snowball sampling, and quota sampling. The document outlines the process, advantages, and disadvantages of different sampling techniques.
Sampling involves selecting representative samples from a larger population or lot for analysis in a laboratory. There are different types of sampling that can be used including simple random sampling, stratified random sampling, and multi-stage sampling. The key steps in sampling are to obtain a representative bulk sample from the lot, then prepare this sample by ensuring it is homogeneous and converting it into a form suitable for chemical analysis while removing interfering substances. Sample preparation is important for obtaining accurate and precise measurement results.
Random sampling avoids bias and gives everyone an equal chance of being selected, but it may not result in a truly representative sample if certain variables are left out. Quota sampling is quick but biased based on appearance. Stratified sampling provides a representative sample by selecting participants based on variables, but requires detailed population information. Snowball and volunteer sampling can access hard-to-reach groups but results will not be generalizable due to non-representativeness. Convenience sampling is cheap and easy but results in a biased sample.
Qualitative sampling design is a key step in qualitative research, especially for rural development, researchers
this document provides the necessary details on the procedures to follow
This document provides an overview of survey sampling techniques. It discusses why samples are used instead of censuses, defines key terms like population and sample, and describes different probability and non-probability sampling methods. The central limit theorem states that as sample size increases, the sample mean will converge on the population mean. There are sampling errors from using a sample instead of a census, as well as non-sampling errors from things like measurement error. Steps in sampling include defining the population, finding a sampling frame, drawing a random sample, and ensuring it is representative and unbiased.
The document discusses different sampling methods and terminology used in sampling theory. It defines key terms like population, sample, parameter, and statistics. It then describes four main sampling methods - simple random sampling, stratified random sampling, systematic sampling, and cluster sampling. For each method it provides examples, advantages, limitations and the procedures used to select samples.
The document provides an overview of research process module 2, which covers topics related to sampling design and methods. It defines key terms like population, sample, sampling, random and non-random sampling. It then describes various probability sampling techniques like simple random sampling, stratified random sampling, cluster sampling, systematic sampling, and multi-stage sampling. It also discusses non-probability sampling techniques like convenience sampling and quota sampling. The document provides details on when and how to apply these various sampling methods.
The document discusses different sampling methods used in research. It defines sampling as selecting a subset of individuals from a larger population for investigation. There are two main types of sampling: probability sampling, where every individual has an equal chance of selection, and non-probability sampling, where not every individual has an equal chance. Some examples of probability sampling techniques provided are random sampling, systematic sampling, stratified sampling, and cluster sampling. Examples of non-probability sampling include convenience sampling, purposive sampling, snowball sampling, and quota sampling. The key difference between probability and non-probability sampling is that probability sampling allows results to be generalized to the overall population, while non-probability sampling does not due to its non-random nature.
The document discusses various sampling strategies used in qualitative research. It defines key concepts like population, sample, sampling frame, and parameters. It describes probability sampling techniques that give all units an equal chance of selection as well as non-probability techniques like convenience sampling, quota sampling, purposive sampling, snowball sampling, deviant case sampling, and adaptive sampling. Each technique is explained along with examples of how and when it would be used to gather samples in qualitative research.
types of data in research, measurement level, sampling techniques, sampling t...SRM UNIVERSITY, SIKKIM
This document discusses various topics related to sampling and data collection, including:
1. It describes different types of data sources like primary data collected by the researcher and secondary data collected by others. It notes the advantages and disadvantages of each.
2. It discusses different levels of measurement for data like nominal, ordinal, interval, and ratio scales.
3. It covers sampling techniques including probability methods like simple random sampling, systematic sampling, stratified random sampling, and cluster sampling as well as non-probability methods like purposive sampling, quota sampling, snowball sampling, and convenience sampling.
4. It provides an overview of scale construction techniques for developing measurement scales.
This document discusses sampling and different sampling methods. It defines sampling as selecting a small group from a larger population to make conclusions about the whole group. There are probability and non-probability sampling methods. Probability methods like simple random, stratified, cluster, and systematic sampling give reliable representations by randomly selecting participants. Non-probability methods like convenience, judgmental, snowball, and quota sampling rely on researcher judgment and cannot generalize to the full population. The document provides examples and explanations of each sampling method.
This document discusses sampling and different sampling methods. It defines sampling as selecting a small group from a larger population to make conclusions about the whole group. There are probability and non-probability sampling methods. Probability methods like simple random, stratified, cluster, and systematic sampling give reliable representations if everyone has an equal chance of selection. Non-probability methods like convenience, judgmental, snowball, and quota sampling rely on the researcher's judgment and cannot generalize to the full population. The document provides examples and explanations of each sampling method.
Sampling Techniques literture-Dr. Yasser Mohammed Hassanain Elsayed.pptxYasserMohammedHassan1
The document provides definitions and explanations of key concepts related to sampling techniques used in research. It discusses the differences between a population and a sample, and describes several probability and non-probability sampling methods, including simple random sampling, systematic sampling, stratified sampling, cluster sampling, and non-probability sampling. The document emphasizes the importance of selecting the appropriate sampling technique based on the research question and of clearly explaining the sampling method used in research studies.
This document discusses sampling and various sampling methods. It defines sampling as selecting a small group from a larger population to make inferences about the whole population. There are two main types of sampling methods: probability and non-probability. Probability methods like simple random, stratified, cluster, and systematic sampling give reliable representations if done correctly. Non-probability methods like convenience, judgmental, snowball, and quota sampling rely on researcher judgment and cannot be generalized. The document provides details on each sampling technique.
Arc 323 human studies in architecture fall 2018 lecture 6-data collectionGalala University
This document discusses procedures for collecting quantitative data for research in architectural engineering. It covers obtaining permissions from institutions and participants, selecting participants through probability and non-probability sampling methods, identifying variable types and data collection methods, and developing instruments and procedures to reliably obtain and record data. Key aspects include securing multi-level approvals, choosing a sufficiently sized random or stratified sample, operationalizing variables, and locating or creating valid and reliable instruments to collect data.
Probability and non-probability sampling techniques are used to select samples from populations. Probability sampling uses random selection so each member has an equal chance of selection, allowing results to be generalized. Common methods are simple random, stratified, cluster, and systematic sampling. Non-probability techniques like convenience, judgmental, snowball, and quota sampling rely on the researcher's judgment and cannot be generalized. The document provides definitions and examples of different sampling methods.
1) Sampling involves selecting a subset of a larger population to gather data from. It allows researchers to study large populations in a more efficient manner.
2) There are two main types of sampling methods - probability sampling and non-probability sampling. Probability sampling involves random selection to ensure representativeness, while non-probability sampling relies on convenience.
3) Common probability sampling methods include simple random sampling, stratified random sampling, systematic random sampling, and cluster sampling. Non-probability methods include quota sampling, convenience sampling, and purposive sampling. The document provides details on how each method is implemented.
Similar to PROBABILISTIC AND NONPROBABILISTIC SAMPLING (20)
This document contains a 30 question job satisfaction survey with questions that can be answered yes or no. Respondents are instructed to give themselves 2 points for each yes answer. The total points are then used to evaluate job satisfaction on a scale ranging from a depressing job to a great job. Background information is provided on the survey's author and organization. The Wellness Council of America is introduced as the publisher of the survey and a trusted source for worksite wellness information and products. Contact details are listed.
Educational leadership style and teacher job satisfaction- InstrumentSYIKIN MARIA
This study examined the relationship between educational leadership styles, teachers' years of experience, and teacher job satisfaction at two middle schools in South Texas. The researcher collected data using the Multifactor Leadership Questionnaire, Job Satisfaction Survey, and a demographic questionnaire from 67 teachers via SurveyMonkey. The results indicated that teachers reported moderately high job satisfaction and utilized transformational, transactional, and passive leadership styles moderately often, with the strongest correlation between transformational leadership and job satisfaction. There was no statistically significant relationship between job satisfaction and teachers' years of experience.
Correlational designs allow researchers to examine relationships between two or more variables by collecting data on all variables at the same point in time. Key aspects of correlational designs include correlating predictor and criterion variables to predict outcomes, displaying scores in scatter plots and matrices to show associations between variables, and using techniques like partial correlations and multiple regression to analyze multiple variables. Conducting high quality correlational research requires adequately sampling participants, selecting appropriate statistical tests, and properly interpreting results to understand the direction, magnitude, and strength of relationships between variables.
Narrative research design focuses on studying individuals by collecting and telling stories about their lives and experiences. It derives from narrating or telling stories in detail. Researchers describe lives through stories, experiences, and narratives. It is used when individuals are willing to share their stories chronologically. Key aspects include collecting first-person accounts, restorying while following a chronological structure, identifying themes, and collaborating closely with participants. The design was developed in education in 1990 and involves multiple steps from identifying phenomena to validating reports. Ethical considerations are authenticity, data distortion, and ownership. Evaluations note its individual focus, use of chronology, context description, and theme emergence.
The document provides an overview of grounded theory, including its definition, history, uses, and evaluation. Grounded theory was developed in the 1960s by Glaser and Strauss as a qualitative research methodology to build theories inductively from data rather than testing existing hypotheses. The key steps include collecting data through methods like interviews, coding the data to identify concepts and categories, and developing a theory grounded in the data to explain a process. The theory is evaluated based on its connection to the raw data and usefulness in explaining the phenomenon under study.
The document defines experimental research and provides details on key aspects of experimental design. It discusses that experimental research involves testing ideas to determine their effect on outcomes. Random assignment of participants to groups is a critical characteristic, as it helps control for extraneous variables. Various types of experimental designs are described, including between-group designs like true experiments, quasi-experiments, and factorial designs, and within-group designs like time series experiments, repeated measures experiments, and single subject experiments. Threats to validity like internal, external, and statistical conclusion validity are also outlined. The document provides guidance on how to properly conduct an experiment and evaluate its quality.
This document provides an overview of ethnographic research methodology. It defines ethnography as writing about groups of people through observation and interviews to understand their culture, including behaviors, beliefs, and language. There are different types of ethnographic designs like realist, case studies, and critical ethnographies. Realist ethnographies take a third-person objective viewpoint while critical ethnographies aim to advocate for marginalized groups. Key aspects of ethnography include identifying a culture-sharing group, collecting emic and etic data, describing cultural themes, and interpreting findings through detailed descriptions and thematic analysis within its cultural context. The document outlines steps for conducting ethnography, including gaining access and approval, collecting multiple sources of data through fieldwork, and
Action research is a method used by teachers and educators to study practical problems and improve their practices. It involves identifying an issue, collecting and analyzing data, and implementing changes. There are two main types - practical action research focuses on improving specific situations, while participatory action research takes a more social and collaborative approach aimed at emancipation. Action research was developed in the 1930s and involves teachers studying their own classrooms. The process is cyclical as findings are used to revise practices.
This document discusses mixed methods research, which involves collecting and analyzing both quantitative and qualitative data within a single study. It provides an overview of the main mixed methods research designs, including convergent parallel, explanatory sequential, exploratory sequential, embedded, and transformative designs. For each design, it outlines the purpose, priority of quantitative and qualitative data collection and analysis, and how the different data sources are integrated. The document also discusses evaluating mixed methods studies and some potential ethical issues to consider in mixed methods research designs.
Organization performance and leadership style issues in education servicesSYIKIN MARIA
This document summarizes a study that examined the relationship between leadership styles (transformational, transactional, laissez-faire) and organizational performance among academic leaders in Malaysian public universities. The study found a positive correlation between transformational leadership and organizational performance, as well as transactional leadership and organizational performance. Transformational leadership had a medium correlation while transactional leadership had a small correlation. The study concluded that transformational leadership was the most commonly practiced and effective style among academic leaders.
Main Java[All of the Base Concepts}.docxadhitya5119
This is part 1 of my Java Learning Journey. This Contains Custom methods, classes, constructors, packages, multithreading , try- catch block, finally block and more.
Communicating effectively and consistently with students can help them feel at ease during their learning experience and provide the instructor with a communication trail to track the course's progress. This workshop will take you through constructing an engaging course container to facilitate effective communication.
Strategies for Effective Upskilling is a presentation by Chinwendu Peace in a Your Skill Boost Masterclass organisation by the Excellence Foundation for South Sudan on 08th and 09th June 2024 from 1 PM to 3 PM on each day.
LAND USE LAND COVER AND NDVI OF MIRZAPUR DISTRICT, UPRAHUL
This Dissertation explores the particular circumstances of Mirzapur, a region located in the
core of India. Mirzapur, with its varied terrains and abundant biodiversity, offers an optimal
environment for investigating the changes in vegetation cover dynamics. Our study utilizes
advanced technologies such as GIS (Geographic Information Systems) and Remote sensing to
analyze the transformations that have taken place over the course of a decade.
The complex relationship between human activities and the environment has been the focus
of extensive research and worry. As the global community grapples with swift urbanization,
population expansion, and economic progress, the effects on natural ecosystems are becoming
more evident. A crucial element of this impact is the alteration of vegetation cover, which plays a
significant role in maintaining the ecological equilibrium of our planet.Land serves as the foundation for all human activities and provides the necessary materials for
these activities. As the most crucial natural resource, its utilization by humans results in different
'Land uses,' which are determined by both human activities and the physical characteristics of the
land.
The utilization of land is impacted by human needs and environmental factors. In countries
like India, rapid population growth and the emphasis on extensive resource exploitation can lead
to significant land degradation, adversely affecting the region's land cover.
Therefore, human intervention has significantly influenced land use patterns over many
centuries, evolving its structure over time and space. In the present era, these changes have
accelerated due to factors such as agriculture and urbanization. Information regarding land use and
cover is essential for various planning and management tasks related to the Earth's surface,
providing crucial environmental data for scientific, resource management, policy purposes, and
diverse human activities.
Accurate understanding of land use and cover is imperative for the development planning
of any area. Consequently, a wide range of professionals, including earth system scientists, land
and water managers, and urban planners, are interested in obtaining data on land use and cover
changes, conversion trends, and other related patterns. The spatial dimensions of land use and
cover support policymakers and scientists in making well-informed decisions, as alterations in
these patterns indicate shifts in economic and social conditions. Monitoring such changes with the
help of Advanced technologies like Remote Sensing and Geographic Information Systems is
crucial for coordinated efforts across different administrative levels. Advanced technologies like
Remote Sensing and Geographic Information Systems
9
Changes in vegetation cover refer to variations in the distribution, composition, and overall
structure of plant communities across different temporal and spatial scales. These changes can
occur natural.
it describes the bony anatomy including the femoral head , acetabulum, labrum . also discusses the capsule , ligaments . muscle that act on the hip joint and the range of motion are outlined. factors affecting hip joint stability and weight transmission through the joint are summarized.
Beyond Degrees - Empowering the Workforce in the Context of Skills-First.pptxEduSkills OECD
Iván Bornacelly, Policy Analyst at the OECD Centre for Skills, OECD, presents at the webinar 'Tackling job market gaps with a skills-first approach' on 12 June 2024
ISO/IEC 27001, ISO/IEC 42001, and GDPR: Best Practices for Implementation and...PECB
Denis is a dynamic and results-driven Chief Information Officer (CIO) with a distinguished career spanning information systems analysis and technical project management. With a proven track record of spearheading the design and delivery of cutting-edge Information Management solutions, he has consistently elevated business operations, streamlined reporting functions, and maximized process efficiency.
Certified as an ISO/IEC 27001: Information Security Management Systems (ISMS) Lead Implementer, Data Protection Officer, and Cyber Risks Analyst, Denis brings a heightened focus on data security, privacy, and cyber resilience to every endeavor.
His expertise extends across a diverse spectrum of reporting, database, and web development applications, underpinned by an exceptional grasp of data storage and virtualization technologies. His proficiency in application testing, database administration, and data cleansing ensures seamless execution of complex projects.
What sets Denis apart is his comprehensive understanding of Business and Systems Analysis technologies, honed through involvement in all phases of the Software Development Lifecycle (SDLC). From meticulous requirements gathering to precise analysis, innovative design, rigorous development, thorough testing, and successful implementation, he has consistently delivered exceptional results.
Throughout his career, he has taken on multifaceted roles, from leading technical project management teams to owning solutions that drive operational excellence. His conscientious and proactive approach is unwavering, whether he is working independently or collaboratively within a team. His ability to connect with colleagues on a personal level underscores his commitment to fostering a harmonious and productive workplace environment.
Date: May 29, 2024
Tags: Information Security, ISO/IEC 27001, ISO/IEC 42001, Artificial Intelligence, GDPR
-------------------------------------------------------------------------------
Find out more about ISO training and certification services
Training: ISO/IEC 27001 Information Security Management System - EN | PECB
ISO/IEC 42001 Artificial Intelligence Management System - EN | PECB
General Data Protection Regulation (GDPR) - Training Courses - EN | PECB
Webinars: https://pecb.com/webinars
Article: https://pecb.com/article
-------------------------------------------------------------------------------
For more information about PECB:
Website: https://pecb.com/
LinkedIn: https://www.linkedin.com/company/pecb/
Facebook: https://www.facebook.com/PECBInternational/
Slideshare: http://www.slideshare.net/PECBCERTIFICATION
বাংলাদেশের অর্থনৈতিক সমীক্ষা ২০২৪ [Bangladesh Economic Review 2024 Bangla.pdf] কম্পিউটার , ট্যাব ও স্মার্ট ফোন ভার্সন সহ সম্পূর্ণ বাংলা ই-বুক বা pdf বই " সুচিপত্র ...বুকমার্ক মেনু 🔖 ও হাইপার লিংক মেনু 📝👆 যুক্ত ..
আমাদের সবার জন্য খুব খুব গুরুত্বপূর্ণ একটি বই ..বিসিএস, ব্যাংক, ইউনিভার্সিটি ভর্তি ও যে কোন প্রতিযোগিতা মূলক পরীক্ষার জন্য এর খুব ইম্পরট্যান্ট একটি বিষয় ...তাছাড়া বাংলাদেশের সাম্প্রতিক যে কোন ডাটা বা তথ্য এই বইতে পাবেন ...
তাই একজন নাগরিক হিসাবে এই তথ্য গুলো আপনার জানা প্রয়োজন ...।
বিসিএস ও ব্যাংক এর লিখিত পরীক্ষা ...+এছাড়া মাধ্যমিক ও উচ্চমাধ্যমিকের স্টুডেন্টদের জন্য অনেক কাজে আসবে ...
2. Outlines
• Sample definition
• Types of sampling in quantitative researches
• Types of sampling in qualitative researches
3. • In random sampling, the
researcher selects individuals
from the population who are
representative of the
population
The sample can make generalization
to the population
4. SAMPLING…
The process of selecting a number of
individuals for a study in such a way
that the individuals represent the
larger group from which they are
selected
5. Quantitative Sampling
• Purpose – to identify participants from whom to seek some information
• Issues
- Nature of the sample (random samples)
- Size of the sample
- Method of selecting the sample
6. Quantitative Sampling
Important Issues
Representation – the extent to which the sample is representative of the population
Generalization – the extent to which the results of the study can be reasonably
extended from the sample to the population
Sampling error
The chance occurrence that a randomly selected sample is not representative of
the population due to errors inherent in the sampling technique.
• Sampling bias
7.
8. Selecting Random Samples
• Known as probability sampling
• Best method to achieve a representative sample
• Four technique
1. Random Sampling
2. Systematic Sampling
3. Stratified Random Sampling
4. Cluster Sampling
9. 1. Simple Random Sampling
• Selecting subjects so that all members of a population have an equal and
independent chance of being selected
Advantages
1. Easy to conduct
2 High probability of achieving a representative sample
3 Meets assumptions of many statistical procedures
Disadvantages
1. Identification of all members of the population can be difficult
2. Contacting all members of the sample can be difficult
10. Selection process
1. Identify and define the population.
2. Determine the desired sample size.
3. List all members of the population.
4. Assign all members on the list a consecutive number
5. Select an arbitrary starting point from a table of random numbers and read
the appropriate number of digits
11. 2. Systematic Sampling
• Researcher choose every nth
individual in the population until
reached the desired sample size.
• May not be as precise but more
convenient as the people do not
have to be numbered and does
not require a random number
tables.
Advantage
-Very easily done
Disadvantages
- subgroups
- some members of the
population don’t have an equal
chance of being included
12. Cont..
Selection process
- Identify and define the population
- Determine the desired sample size
- Obtain a list of the population
- Determine what nth is equal to by dividing the size of the population by the desired
sample size
- Start at some random place in the population list
- Take every nth individual on the list
13. 3. Stratified Sampling
• The population is divided into two
or more groups called strata,
according to some criterion, such as
geographic location, grade level, age,
or income, and subsamples are
randomly selected from each strata.
Advantages
- More accurate sample
- Can be used for both proportional and
nonproportional samples
- Representation of subgroups in the
sample
Disadvantages
- Identification of all members of the
population can be difficult
- Identifying members of all subgroups
can be difficult
14. The procedure consists of (a) dividing the population by the stratum (b)
sampling within each group in the stratum so that the individuals selected are
proportional to their representation in the total population.
15. 4. Cluster Sampling
• The process of randomly selecting intact groups, not individuals, within the
defined population sharing similar characteristics
- Clusters are locations within which an intact group of members of the
population can be found
- Examples : Neighbourhood, School districts, Schools, Classrooms
16. Advantages
- Very useful when populations are large
and spread over a large geographic
region
- Convenient and expedient
- Do not need the names of everyone in
the population
Disadvantages
- Representation is likely to become an
issue
17. Non-probability Samples
• Researcher selects individuals because they are available, convenient, and
represent some characteristics the investigator seeks to study.
1. Convenience Sampling
2. Snowball Sampling
18. 1. Convenience Sampling
• The process of including whoever
happens to be available at the time
(advantage)
• Disadvantages: difficulty in
determining how much of the effect
(dependent variable) results from
the cause (independent variable)
19. 2. Snowball Sampling
• Researcher asks participants to identify others to become members of the sample.
• Advantage of recruiting large numbers of participants for the study.
• Disadvantage:
- Might not know the individuals who did not return the survey.
- Respondents may not be representative of the population
20. SAMPLING IN QUALITATIVE RESEARCH
• Researchers in qualitative research select their participants according to their :
• 1) characteristics
• 2) knowledge
21. Difference between Random Sampling and Purposeful (Qualtitative)
Sampling
Select representative individuals
To generalize from sample to
the population
Random “Quantitative” Sampling
To make “claims” about
the population
To build/test “theories”
that explains the
population
Random “Quantitative” Sampling
Select people/ sites that can best
help to understand our
phenomenon
To develop a detailed
understanding
That might provide
“useful” information
That might give voice to
“silenced” people
23. 1. Maximal Variation Sampling
• It is when you select individuals that differ on a certain characteristic.
• In this strategy you should first identify the characteristic and then find
individuals or sites which display that characteristic.
- Different age groups etc
24. 2. Typical Sampling
• It is when you study a person or a site that is “typical” to those unfamiliar
with the situation.
• You can select a typical sample by collecting demographic data or survey data
about all cases.
• Eg: teachers working form 15 years in the
same school
25. 3. Theory / Concept Sampling
• It is when you select individuals or sites because they can help you to
generate a theory or specific concepts within the theory. In this strategy you
need a full understanding of the concept or the theory expected to discover
during the study.
26. 4. Homogenous Sampling
• It is when you select certain sites or people because they possess similar
characteristics. In this strategy, you need to identify the characteristics and
find individuals or sites that possess it.
27. 5. Critical Sampling
• It is when you study an exceptional case represents the central phenomenon
in dramatic terms.
28. 6. Opportunistic Sampling
• It is used after data collection begins, when you may find that you need to
collect new information to answer your research questions.
• Lead to novel ideas and surprising findings
29. References
• Creswell, J., W. (2012) Educational research: Planning, Conducting, and
Evaluating Quantitative and Qualitative Research, 4th ed.
• Patton, M.Q. (2002). Qualitative Research and Evaluation Methods.
Thousand Oaks, CA: Sage.