The document discusses the process of solidification where metals transition from liquid to solid states. There are three main points:
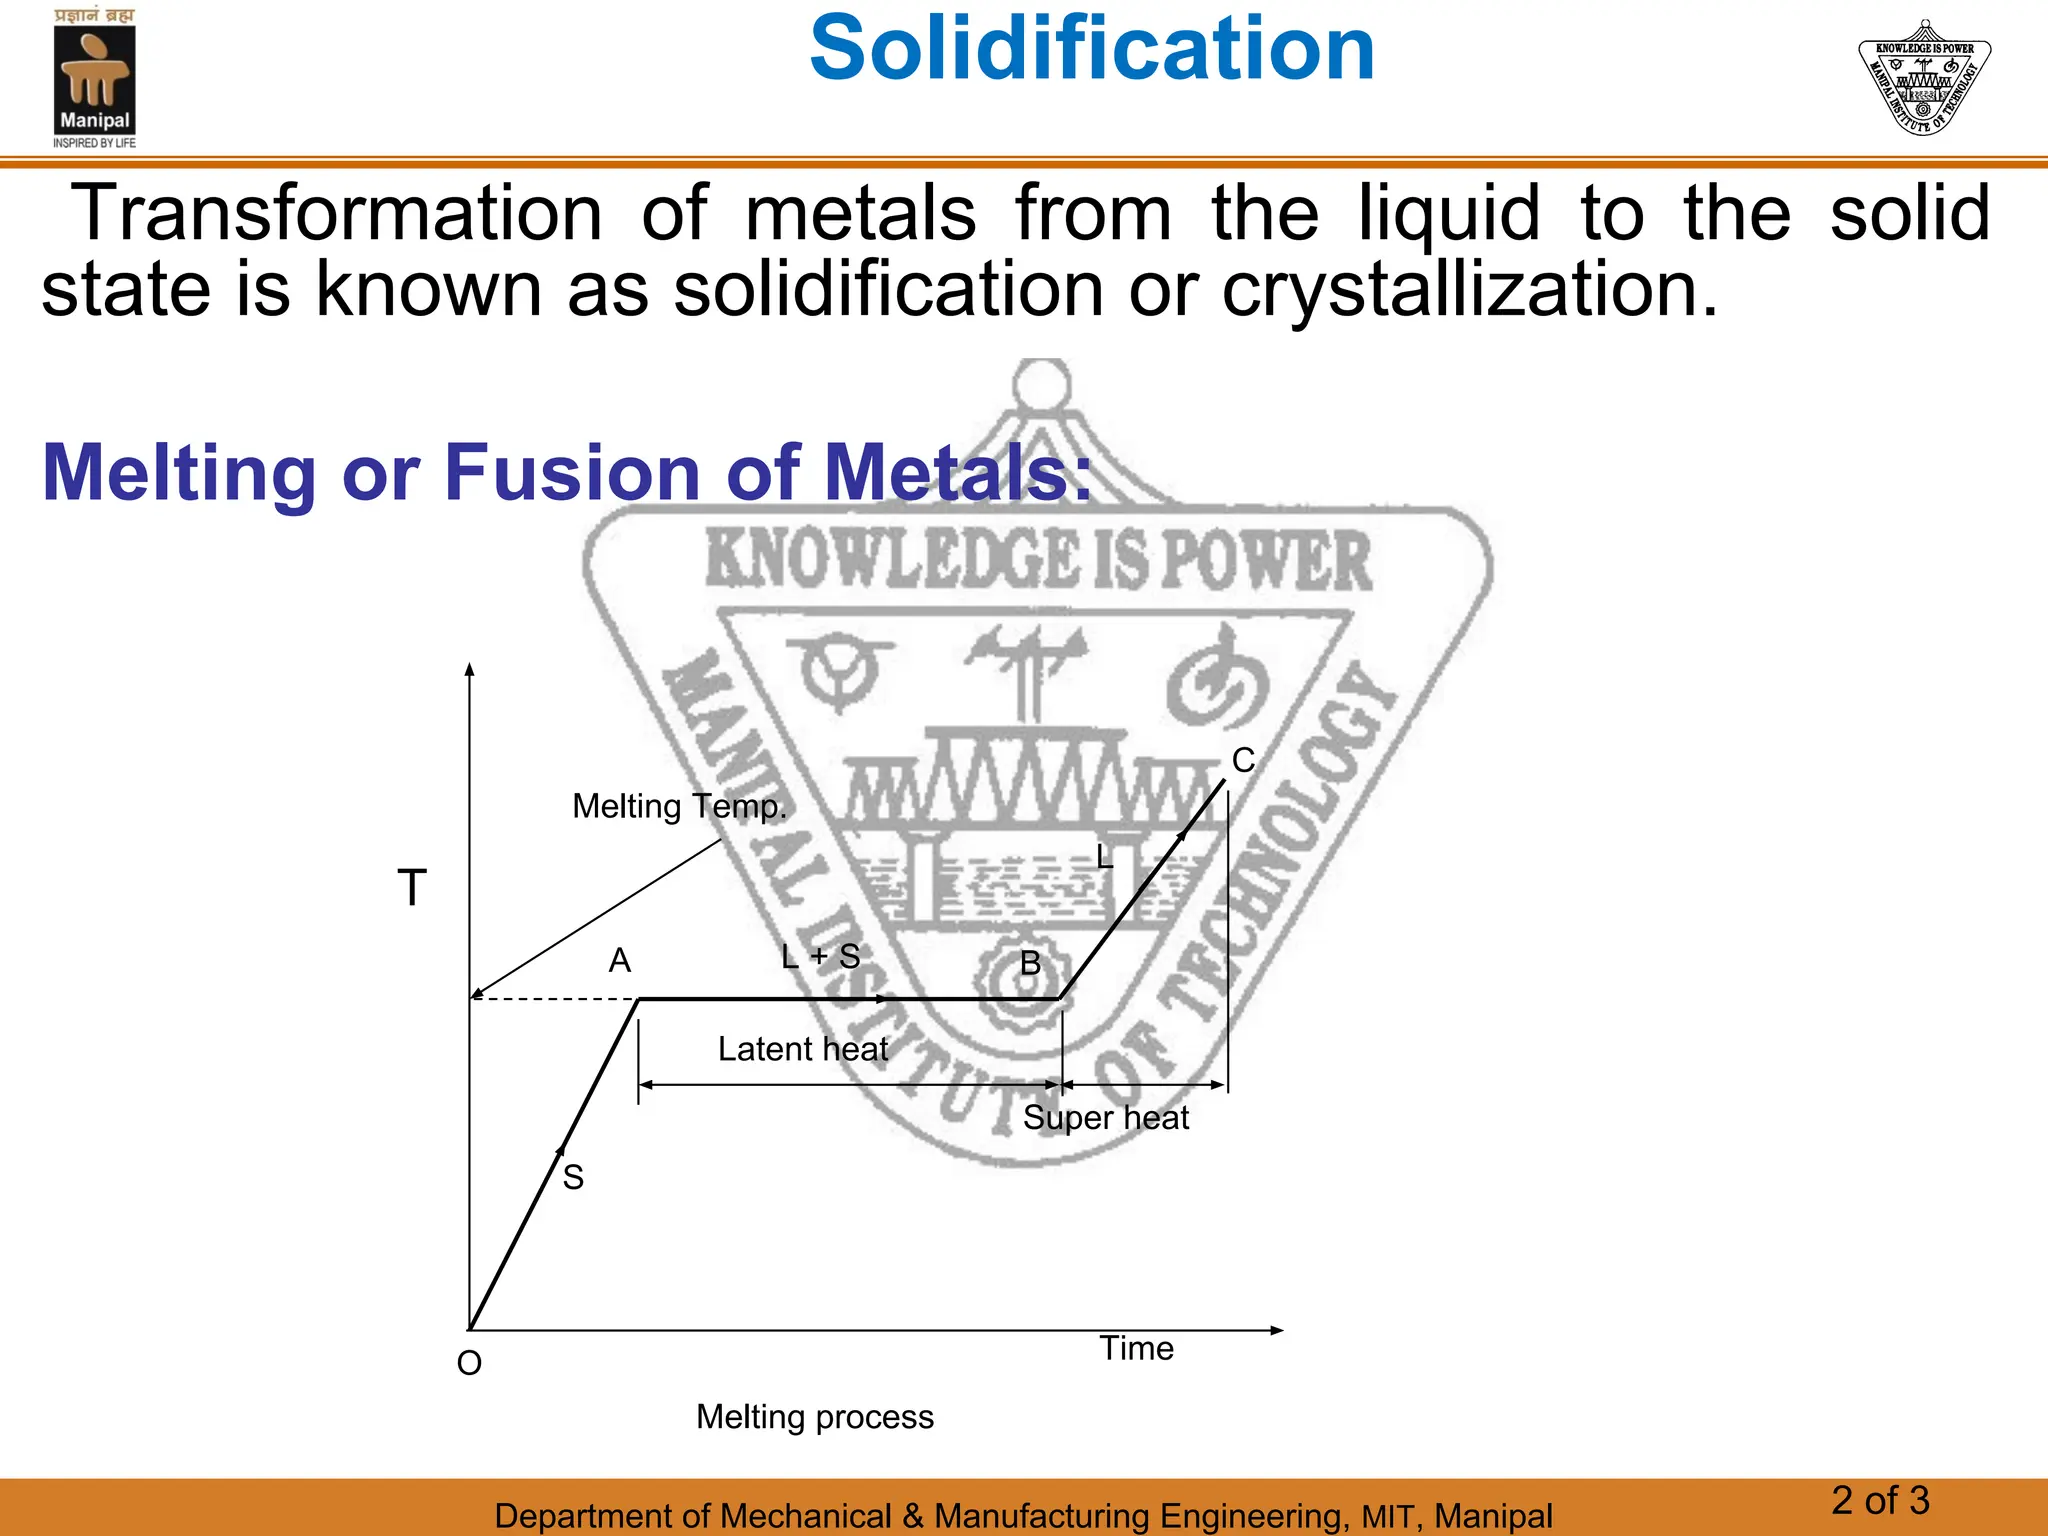
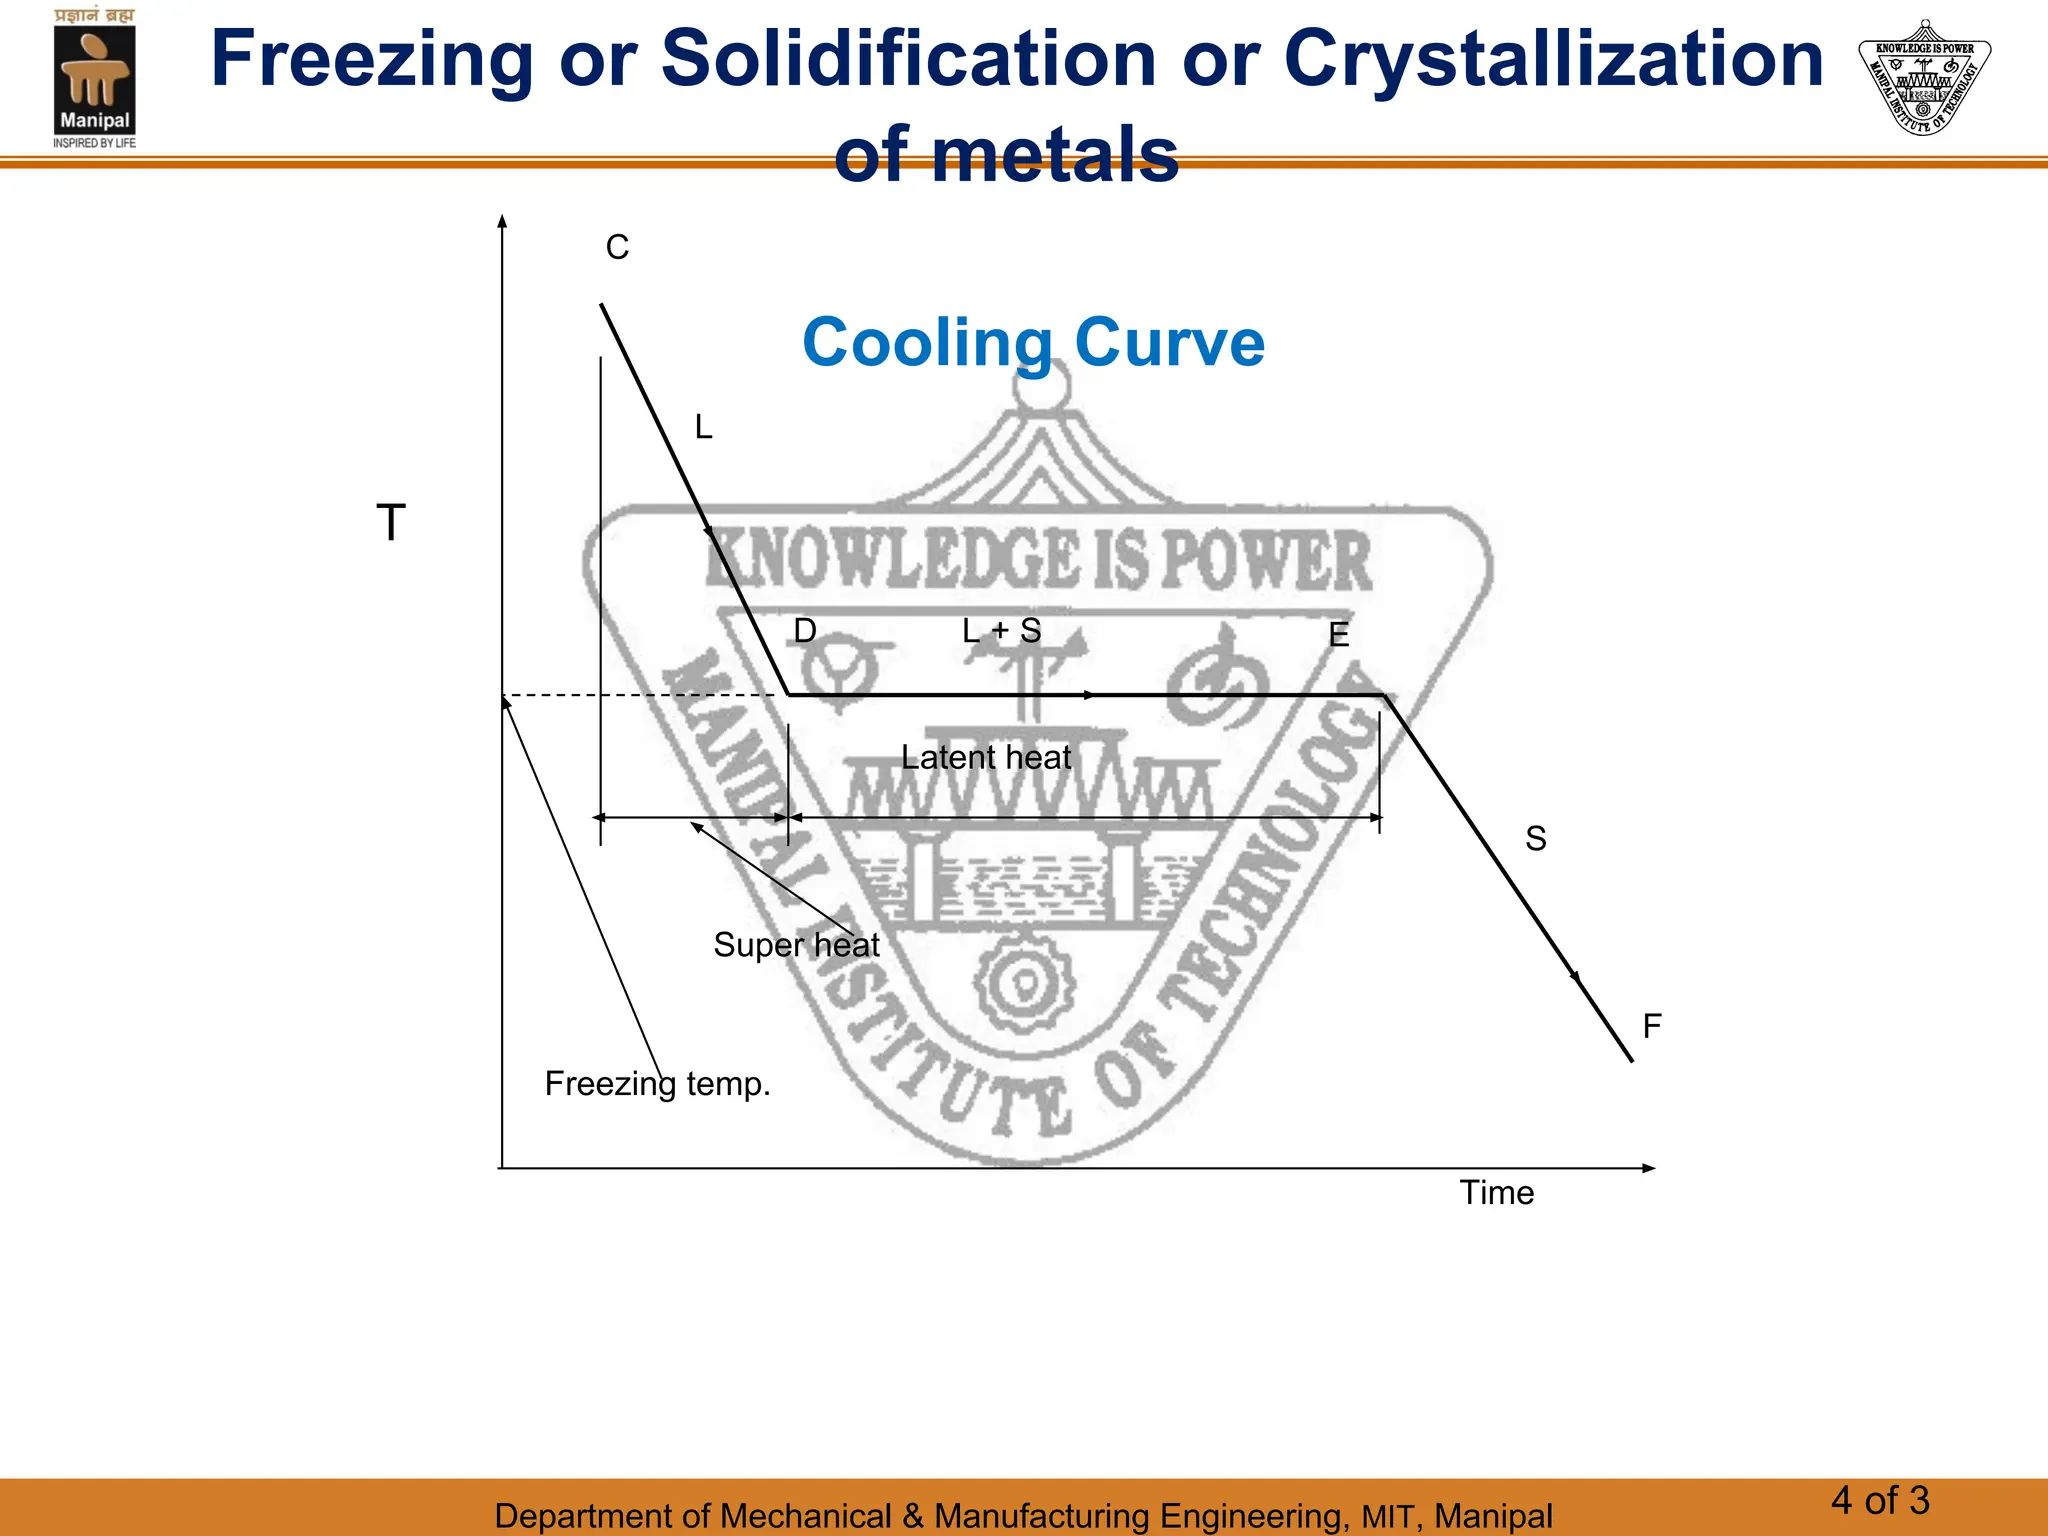
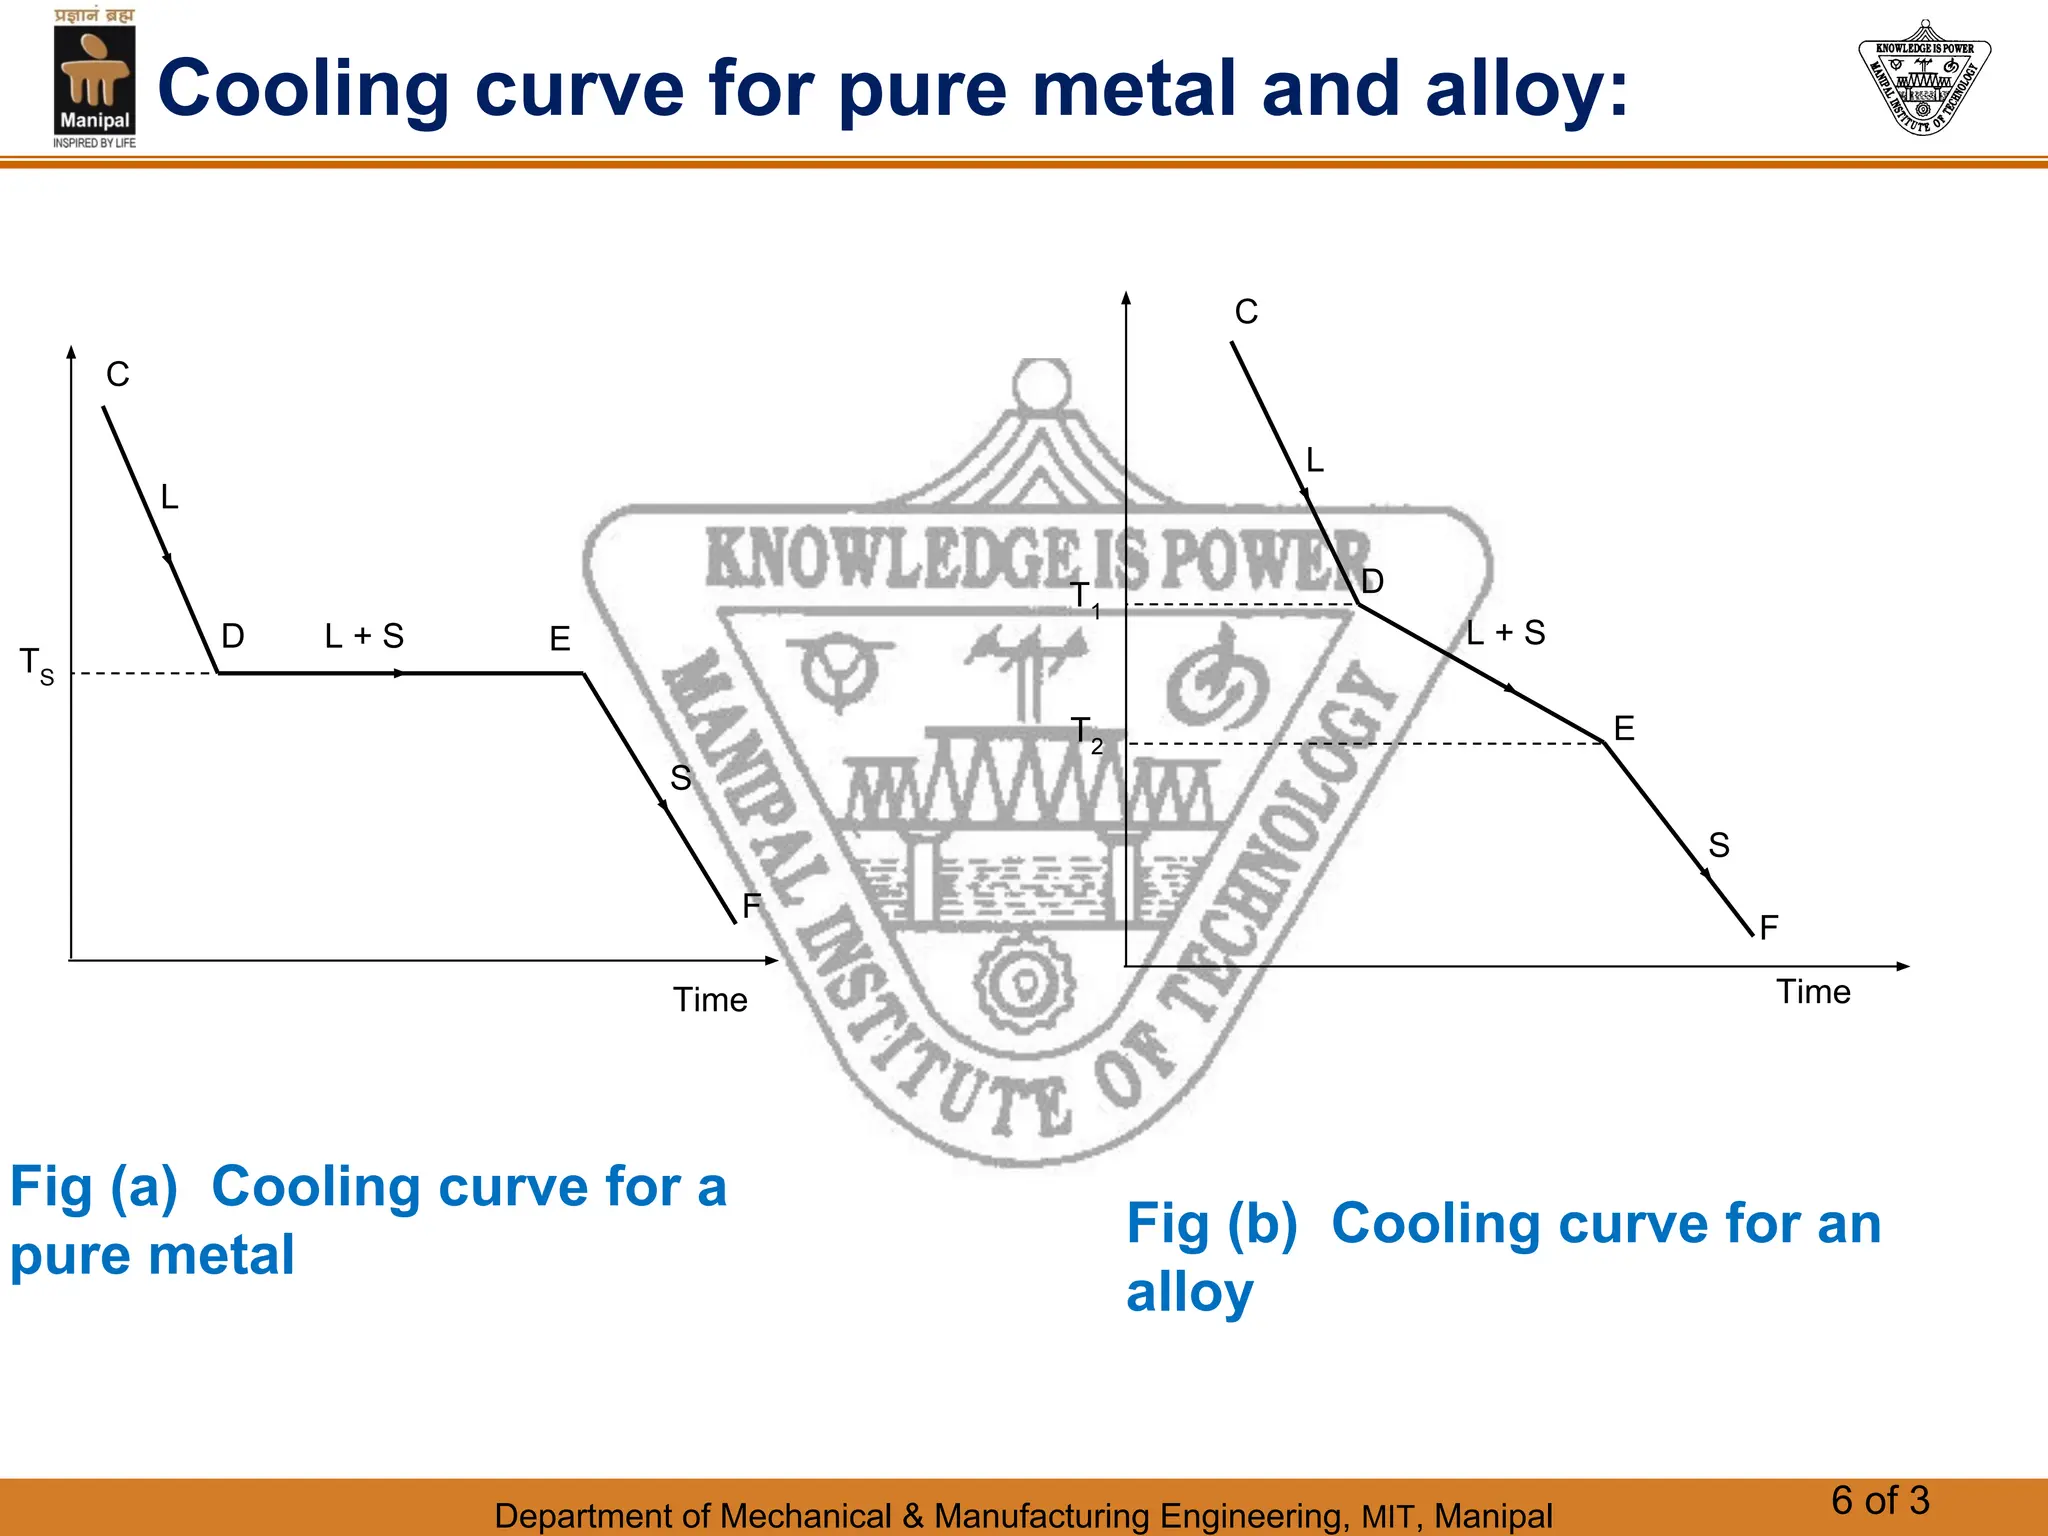
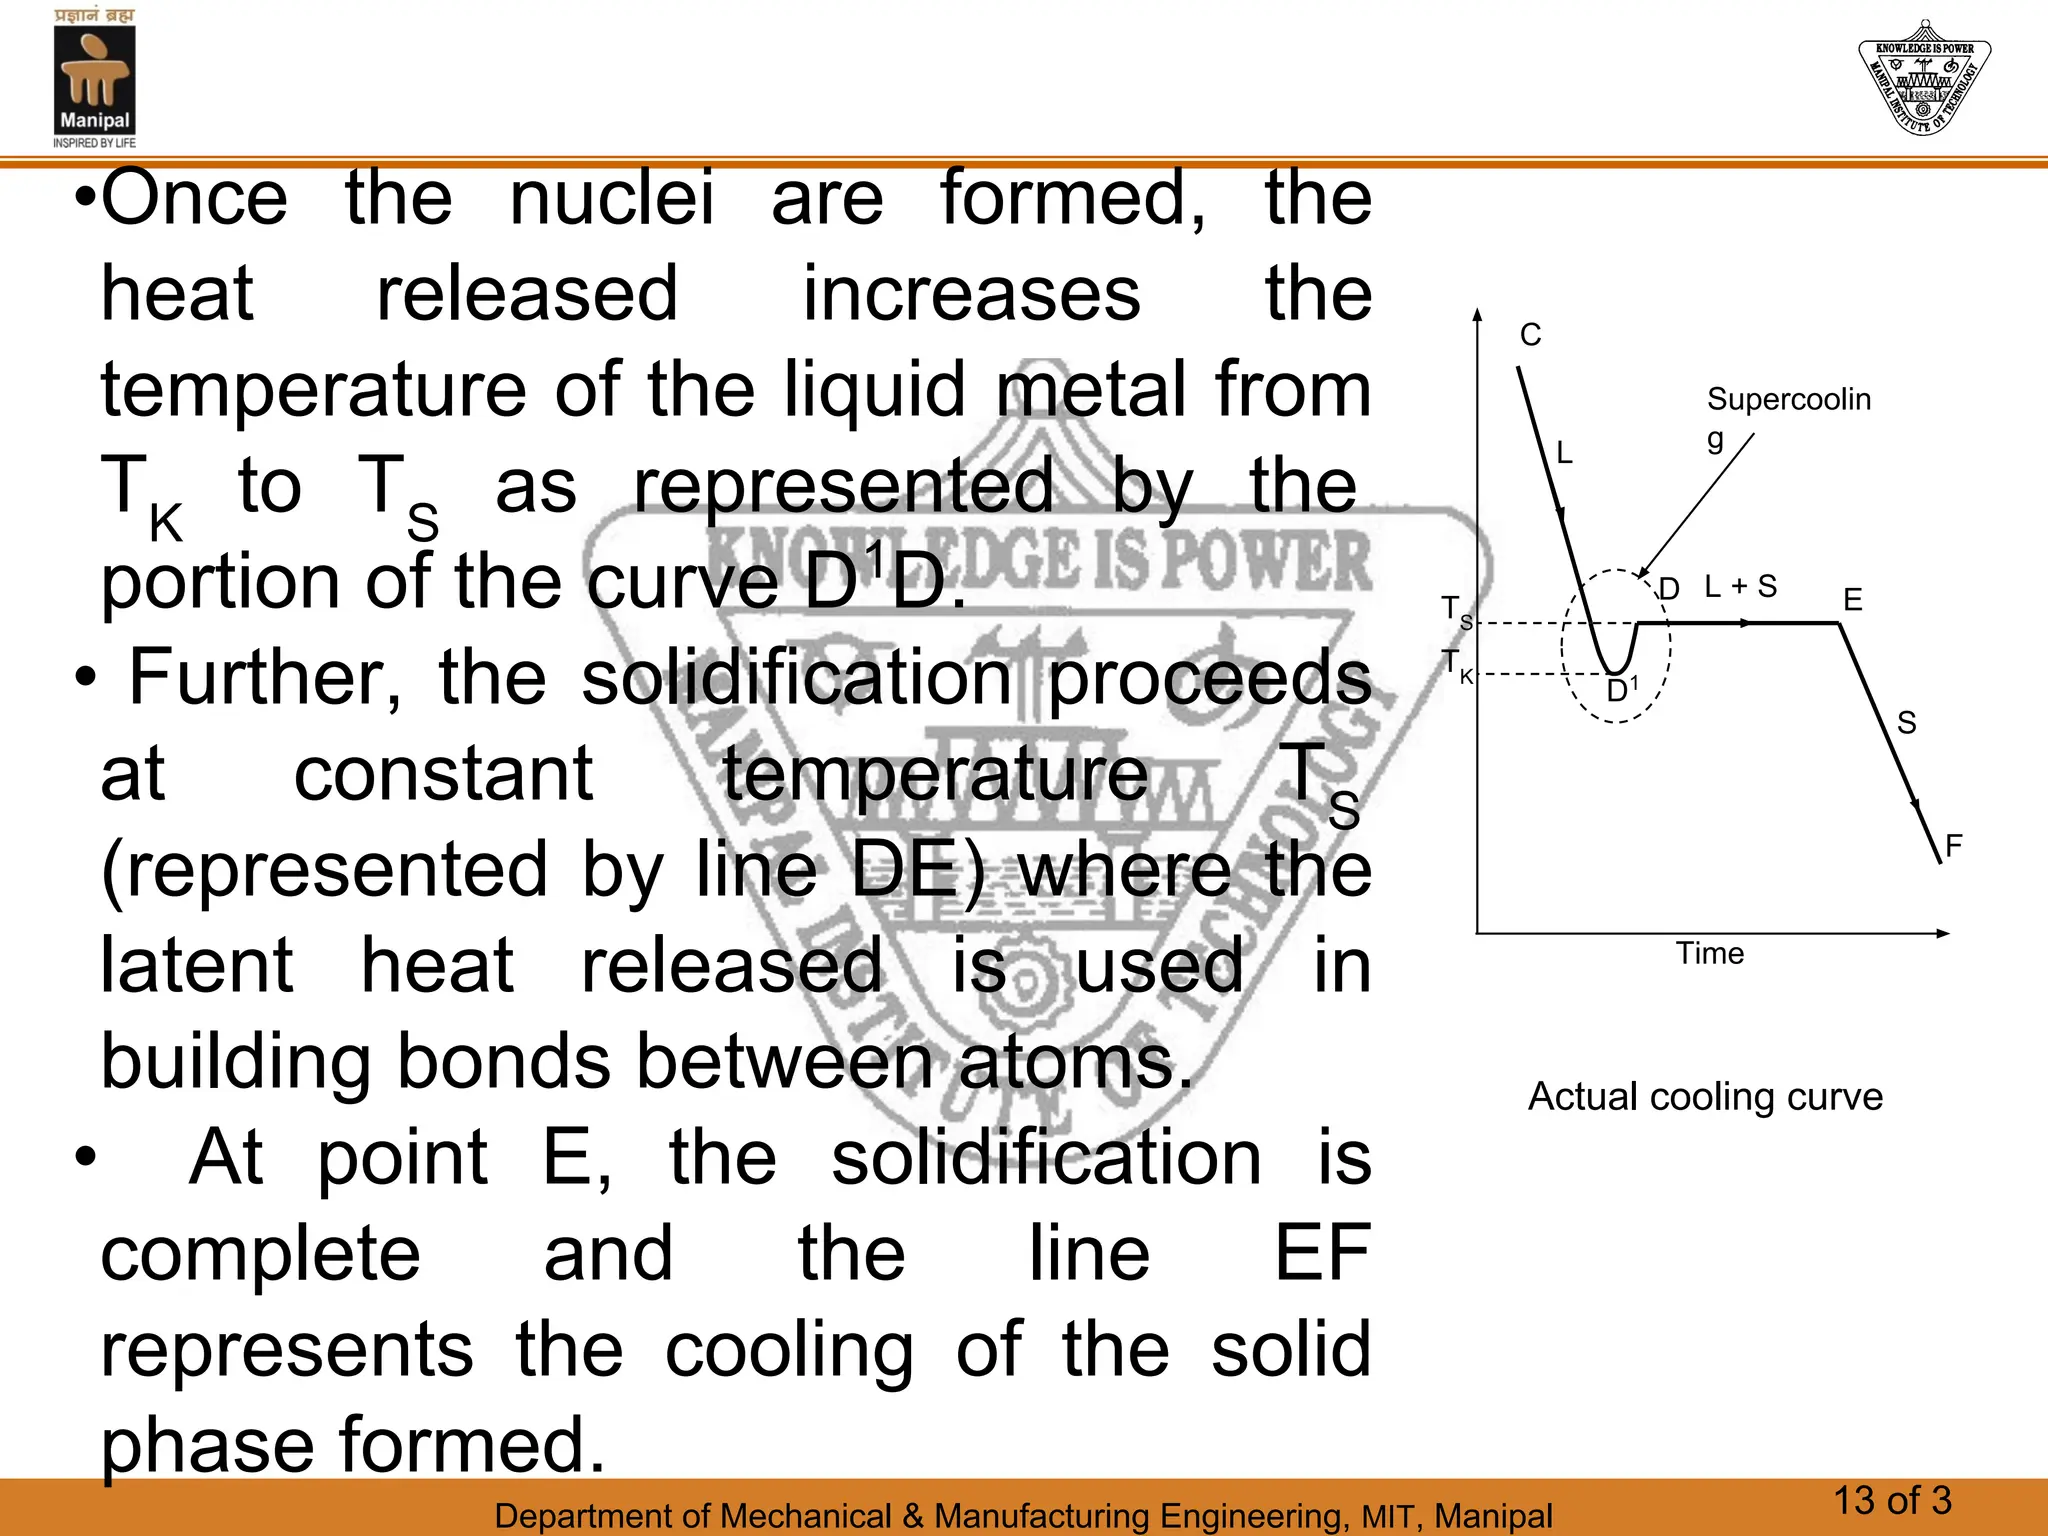
1. Solidification is the reverse of melting and occurs when a molten metal cools and crystallizes into a solid form. This involves releasing latent heat at a constant freezing temperature.
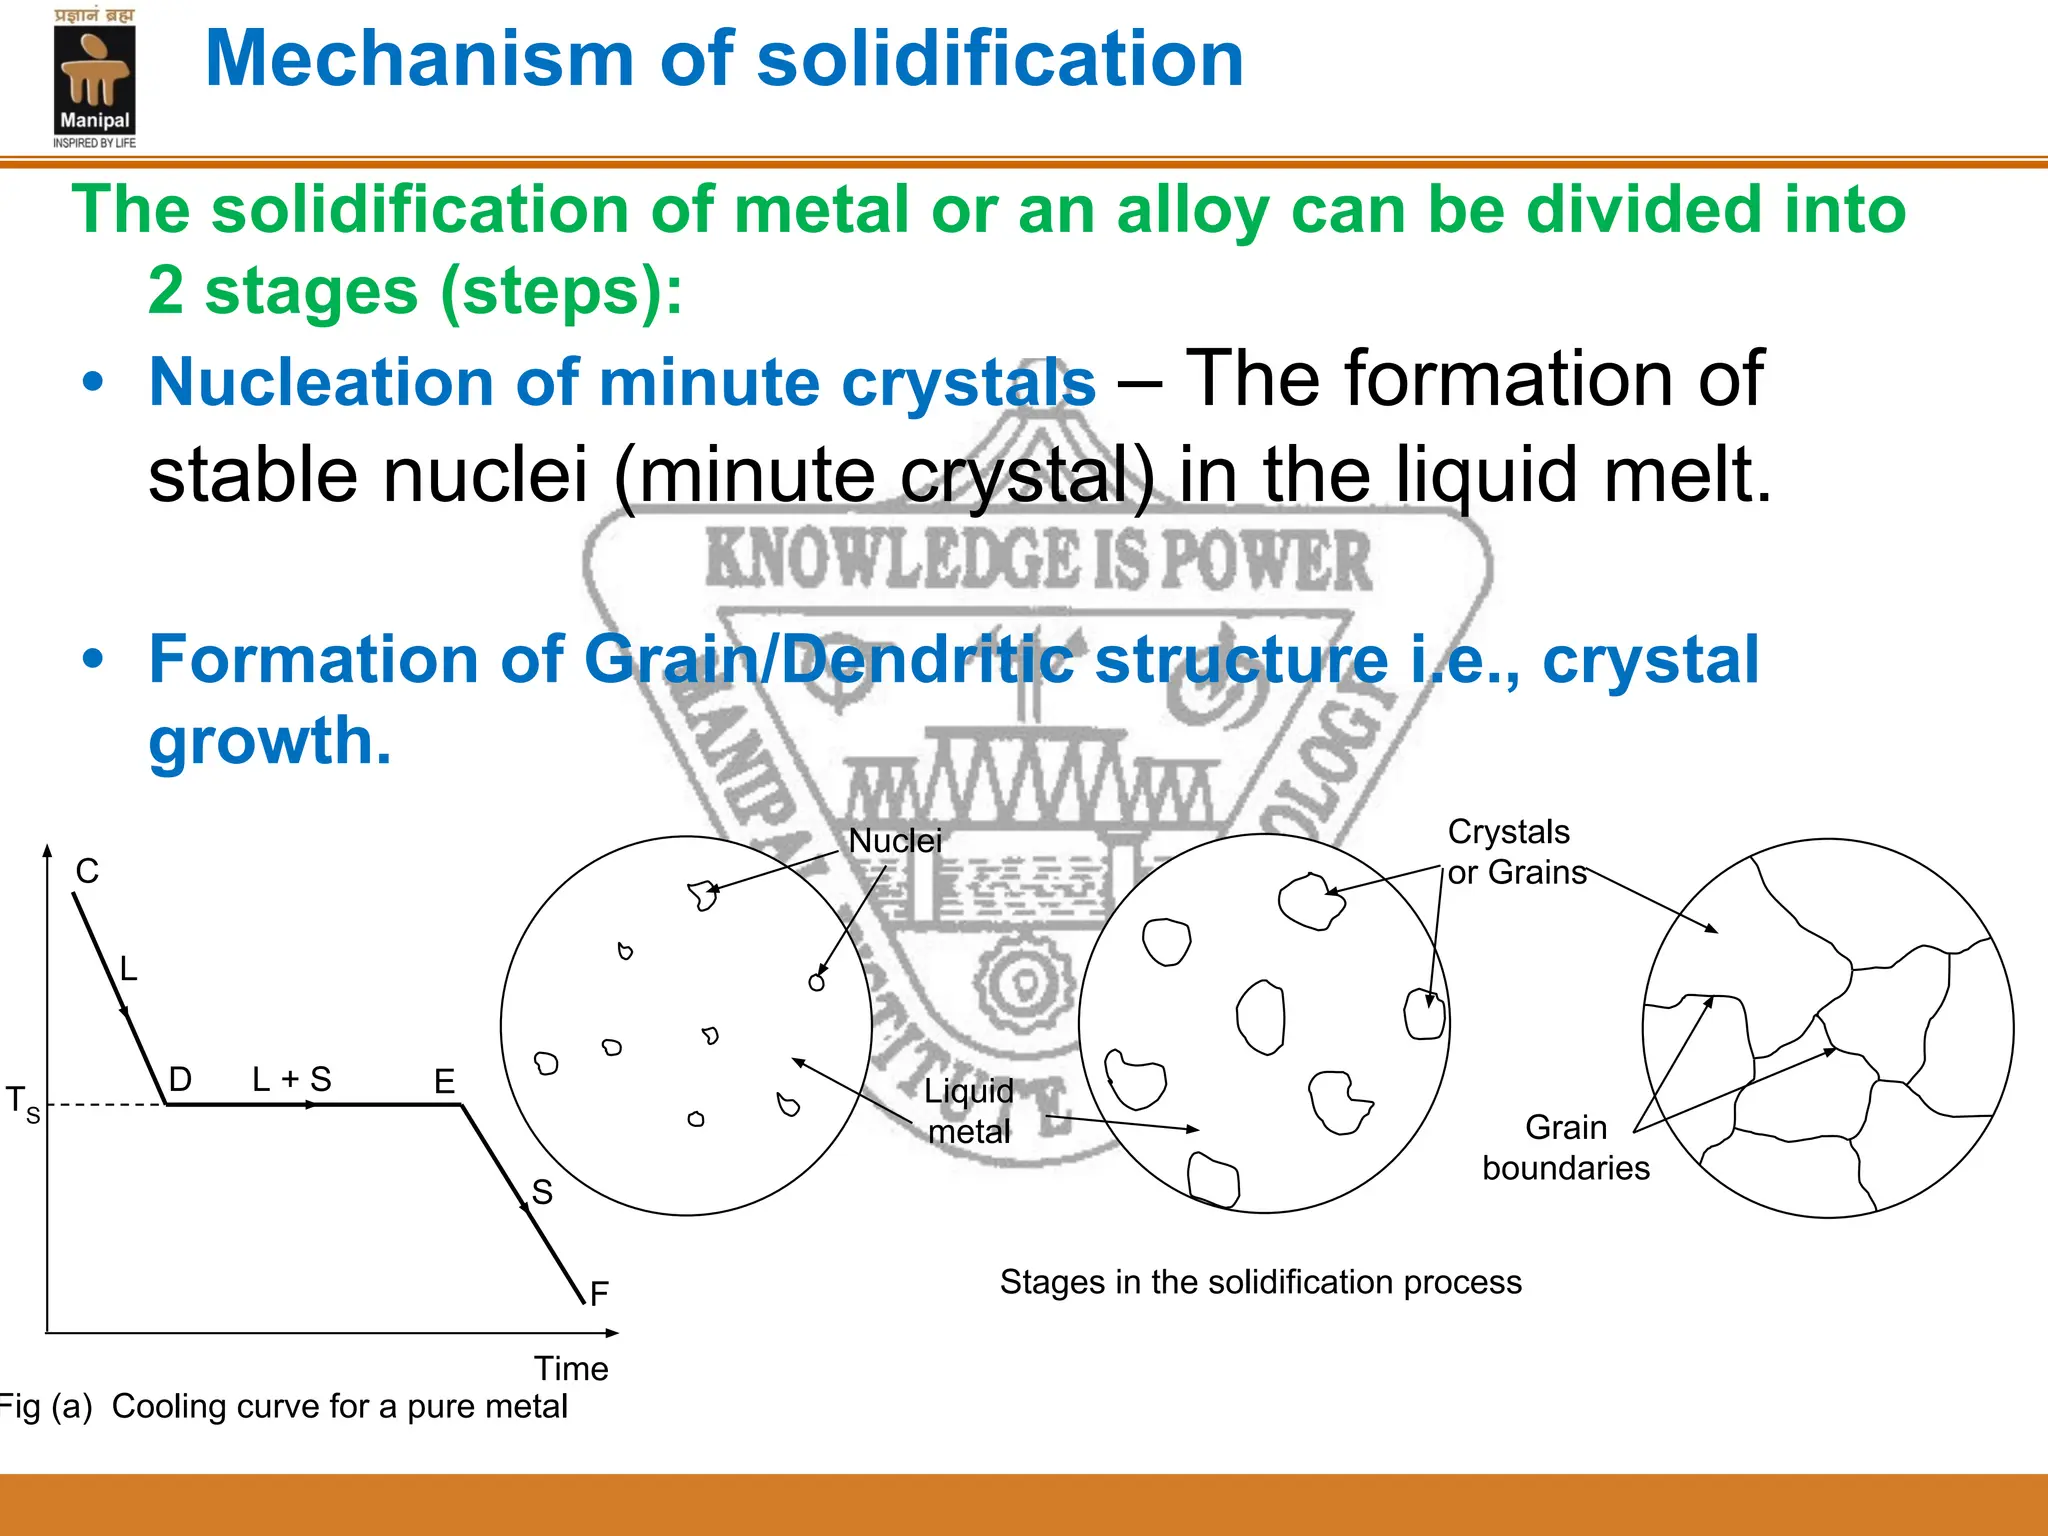
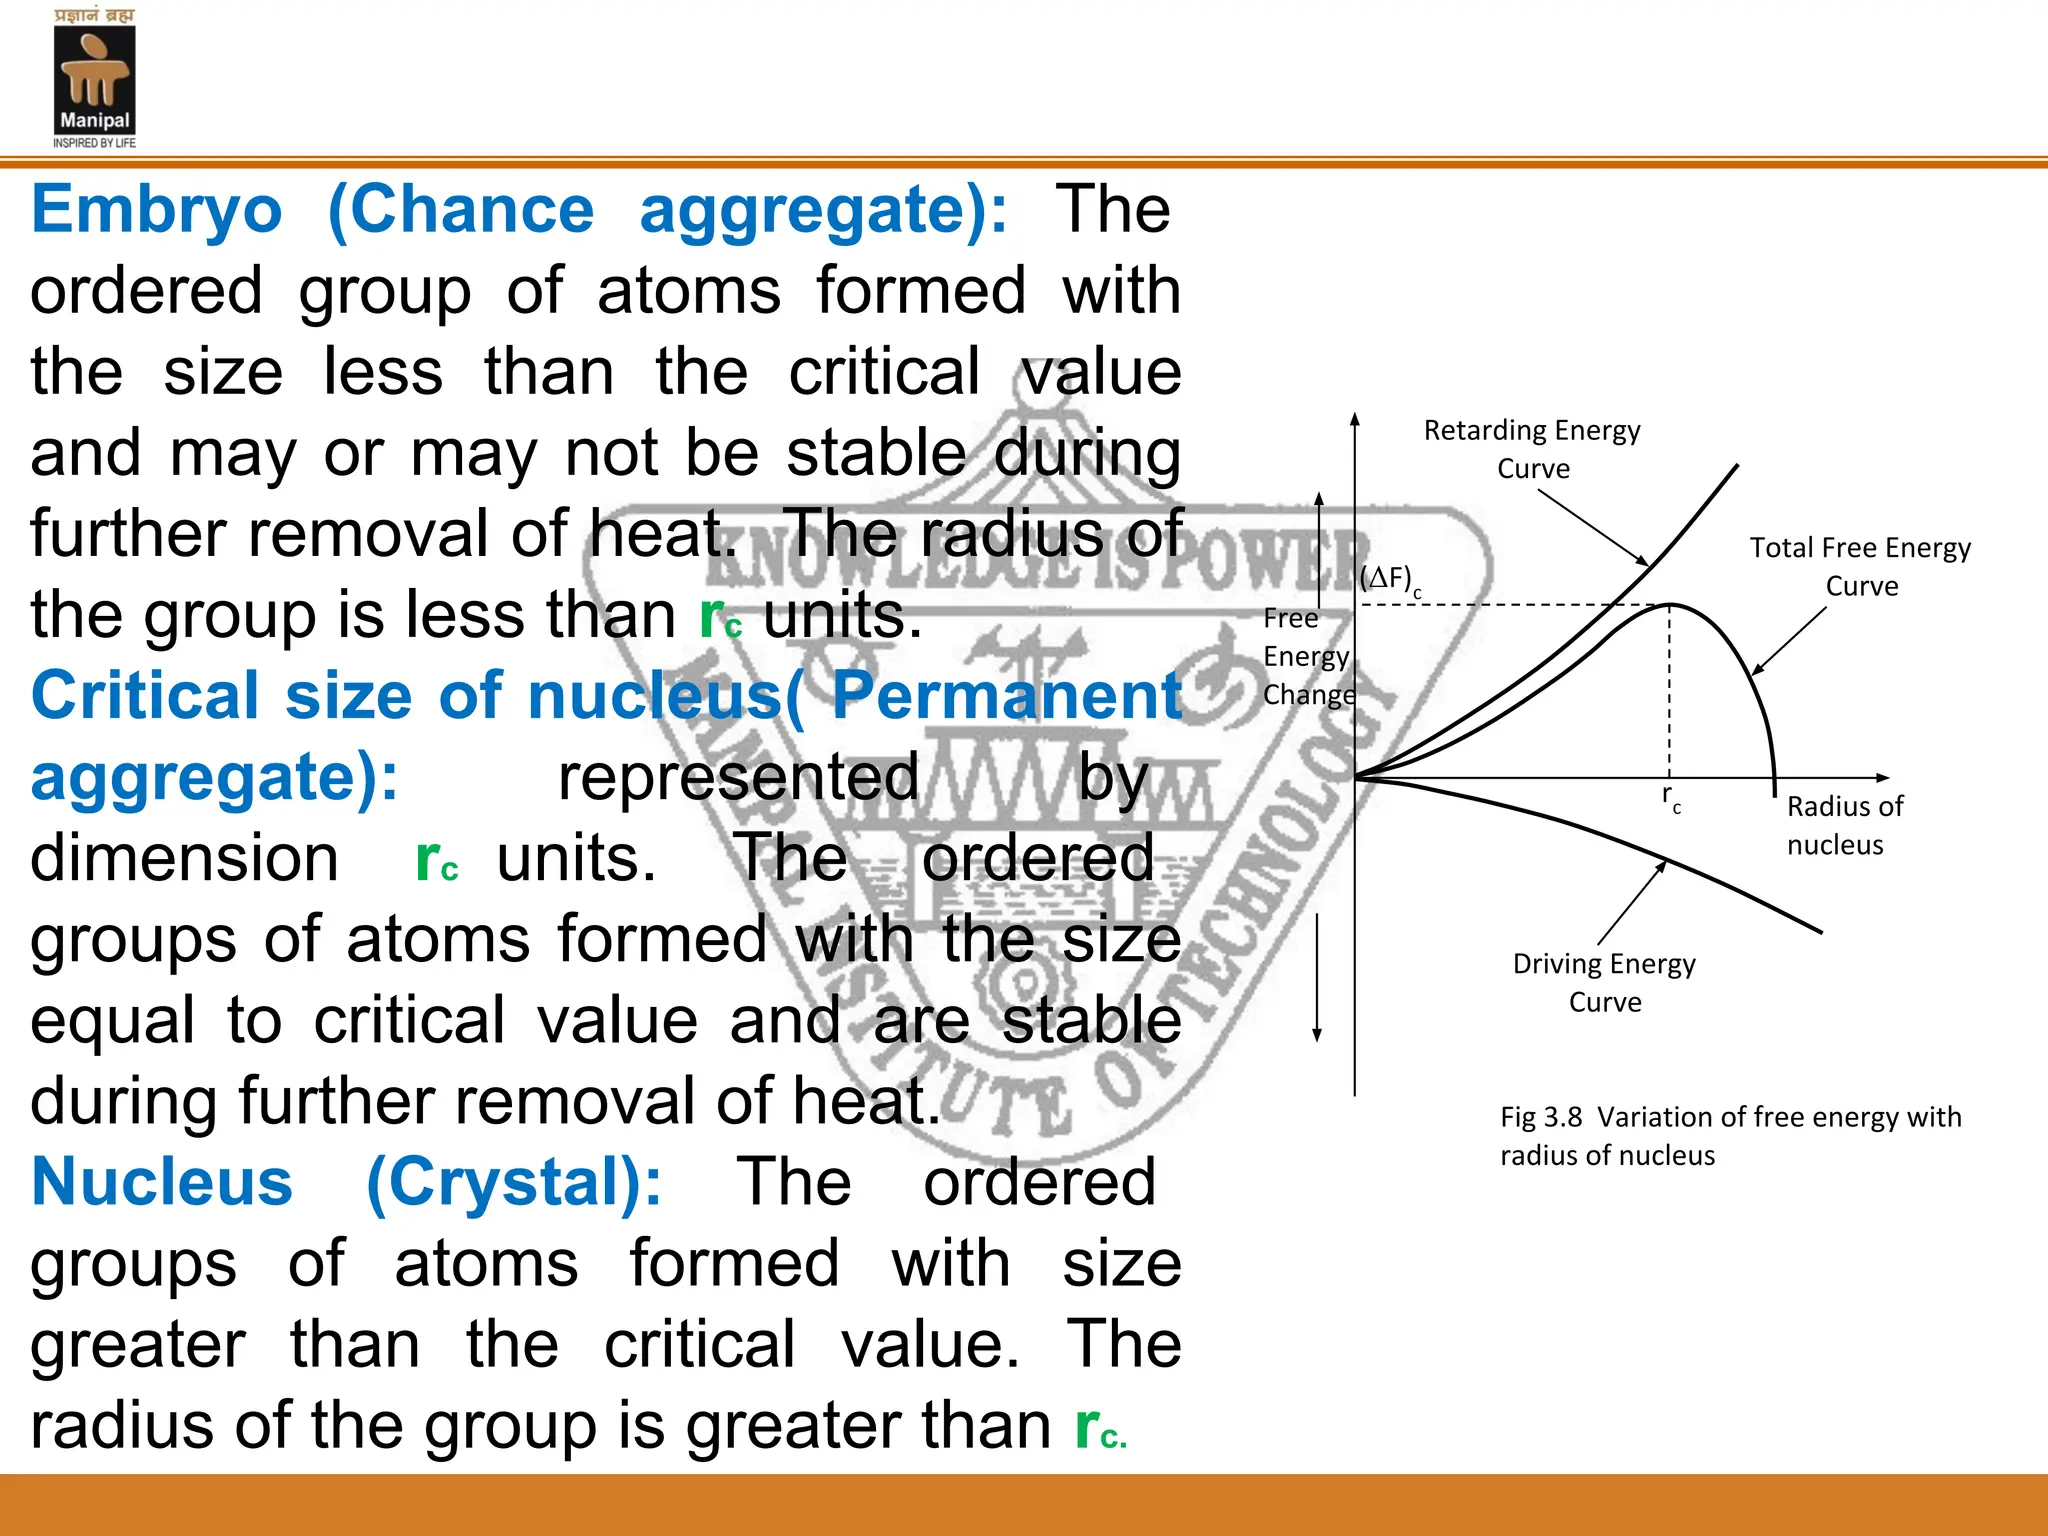
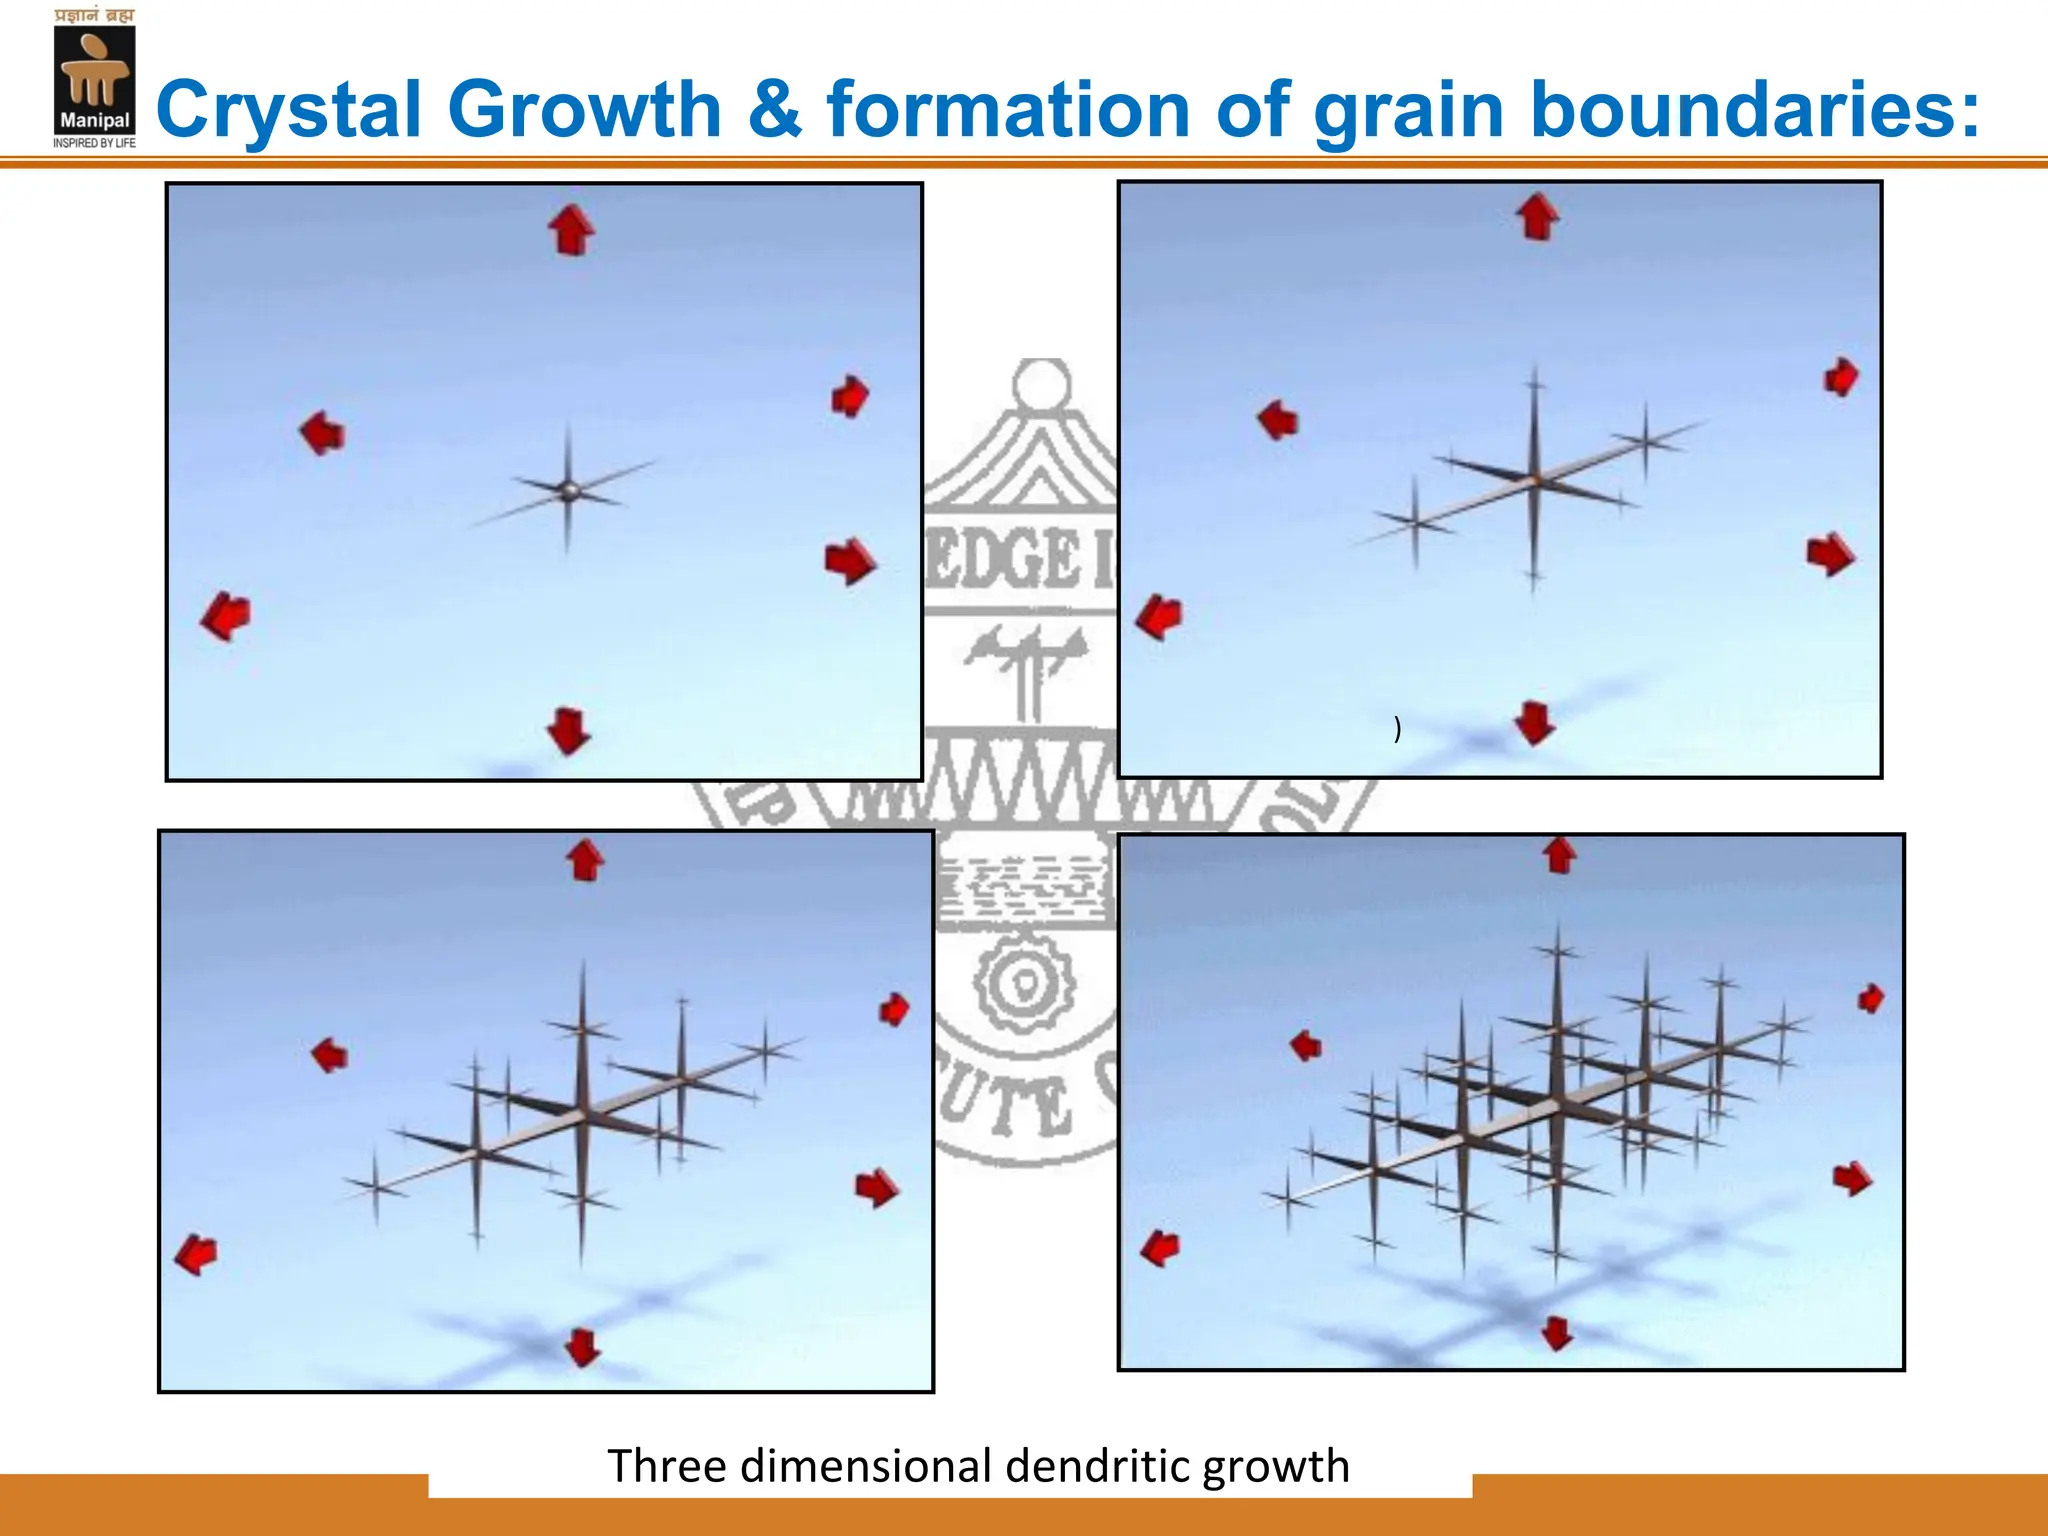
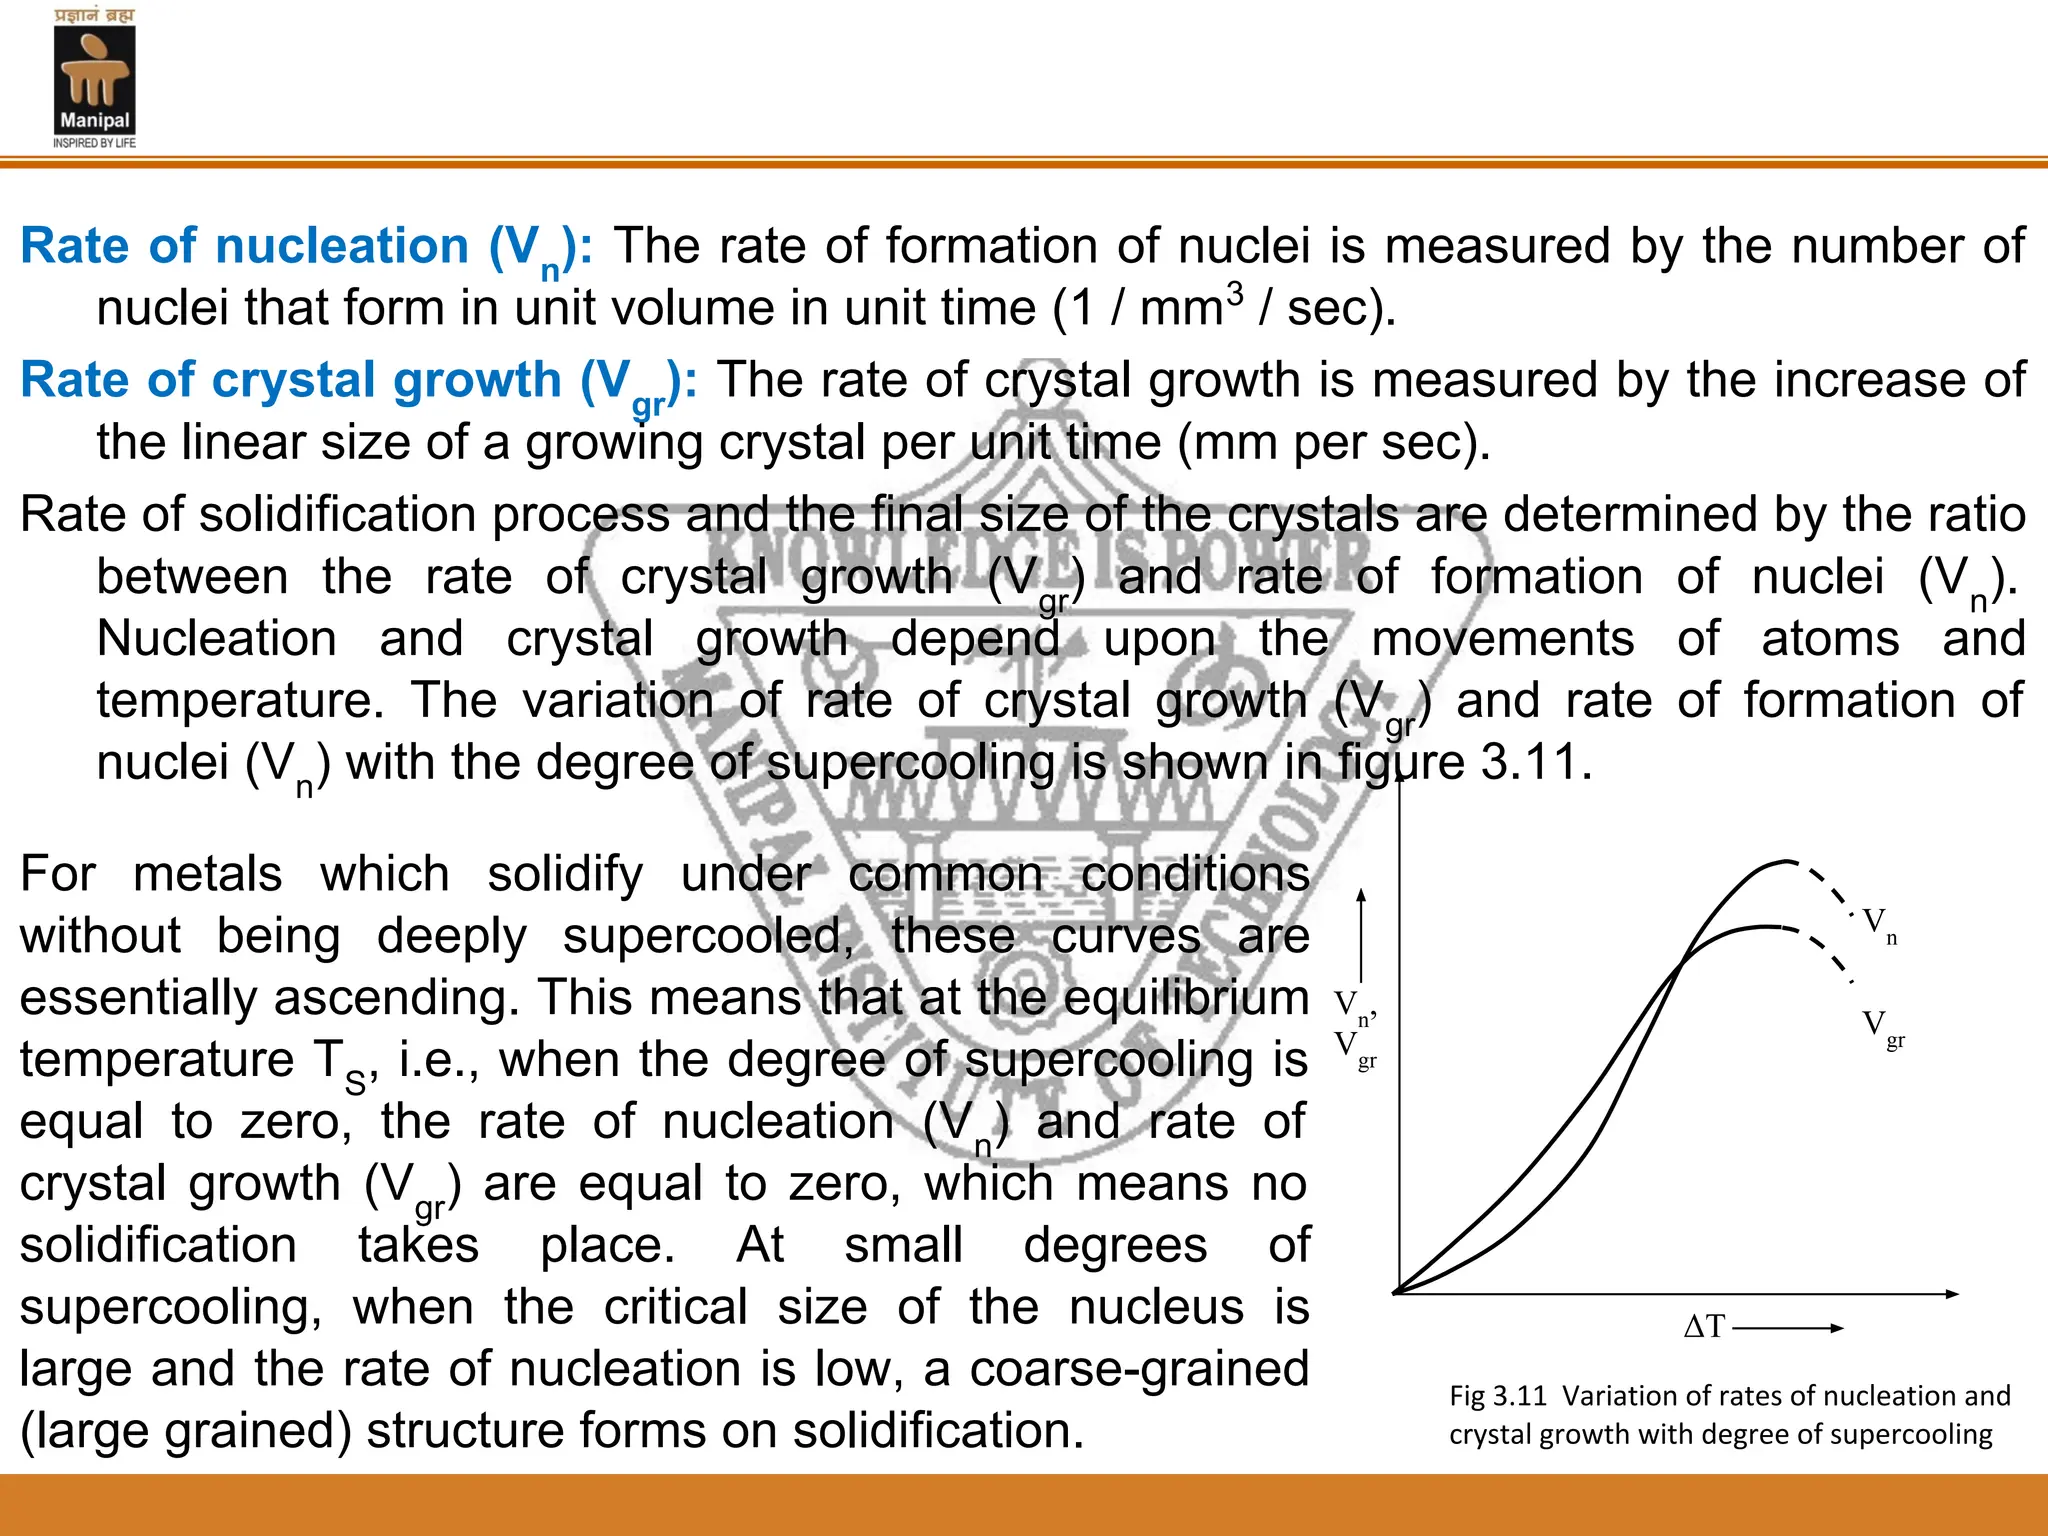
2. Nucleation and crystal growth are the two stages of solidification. Nucleation involves the formation of stable crystal nuclei in the liquid melt. Crystal growth then occurs as the nuclei develop into grains and a dendritic structure.
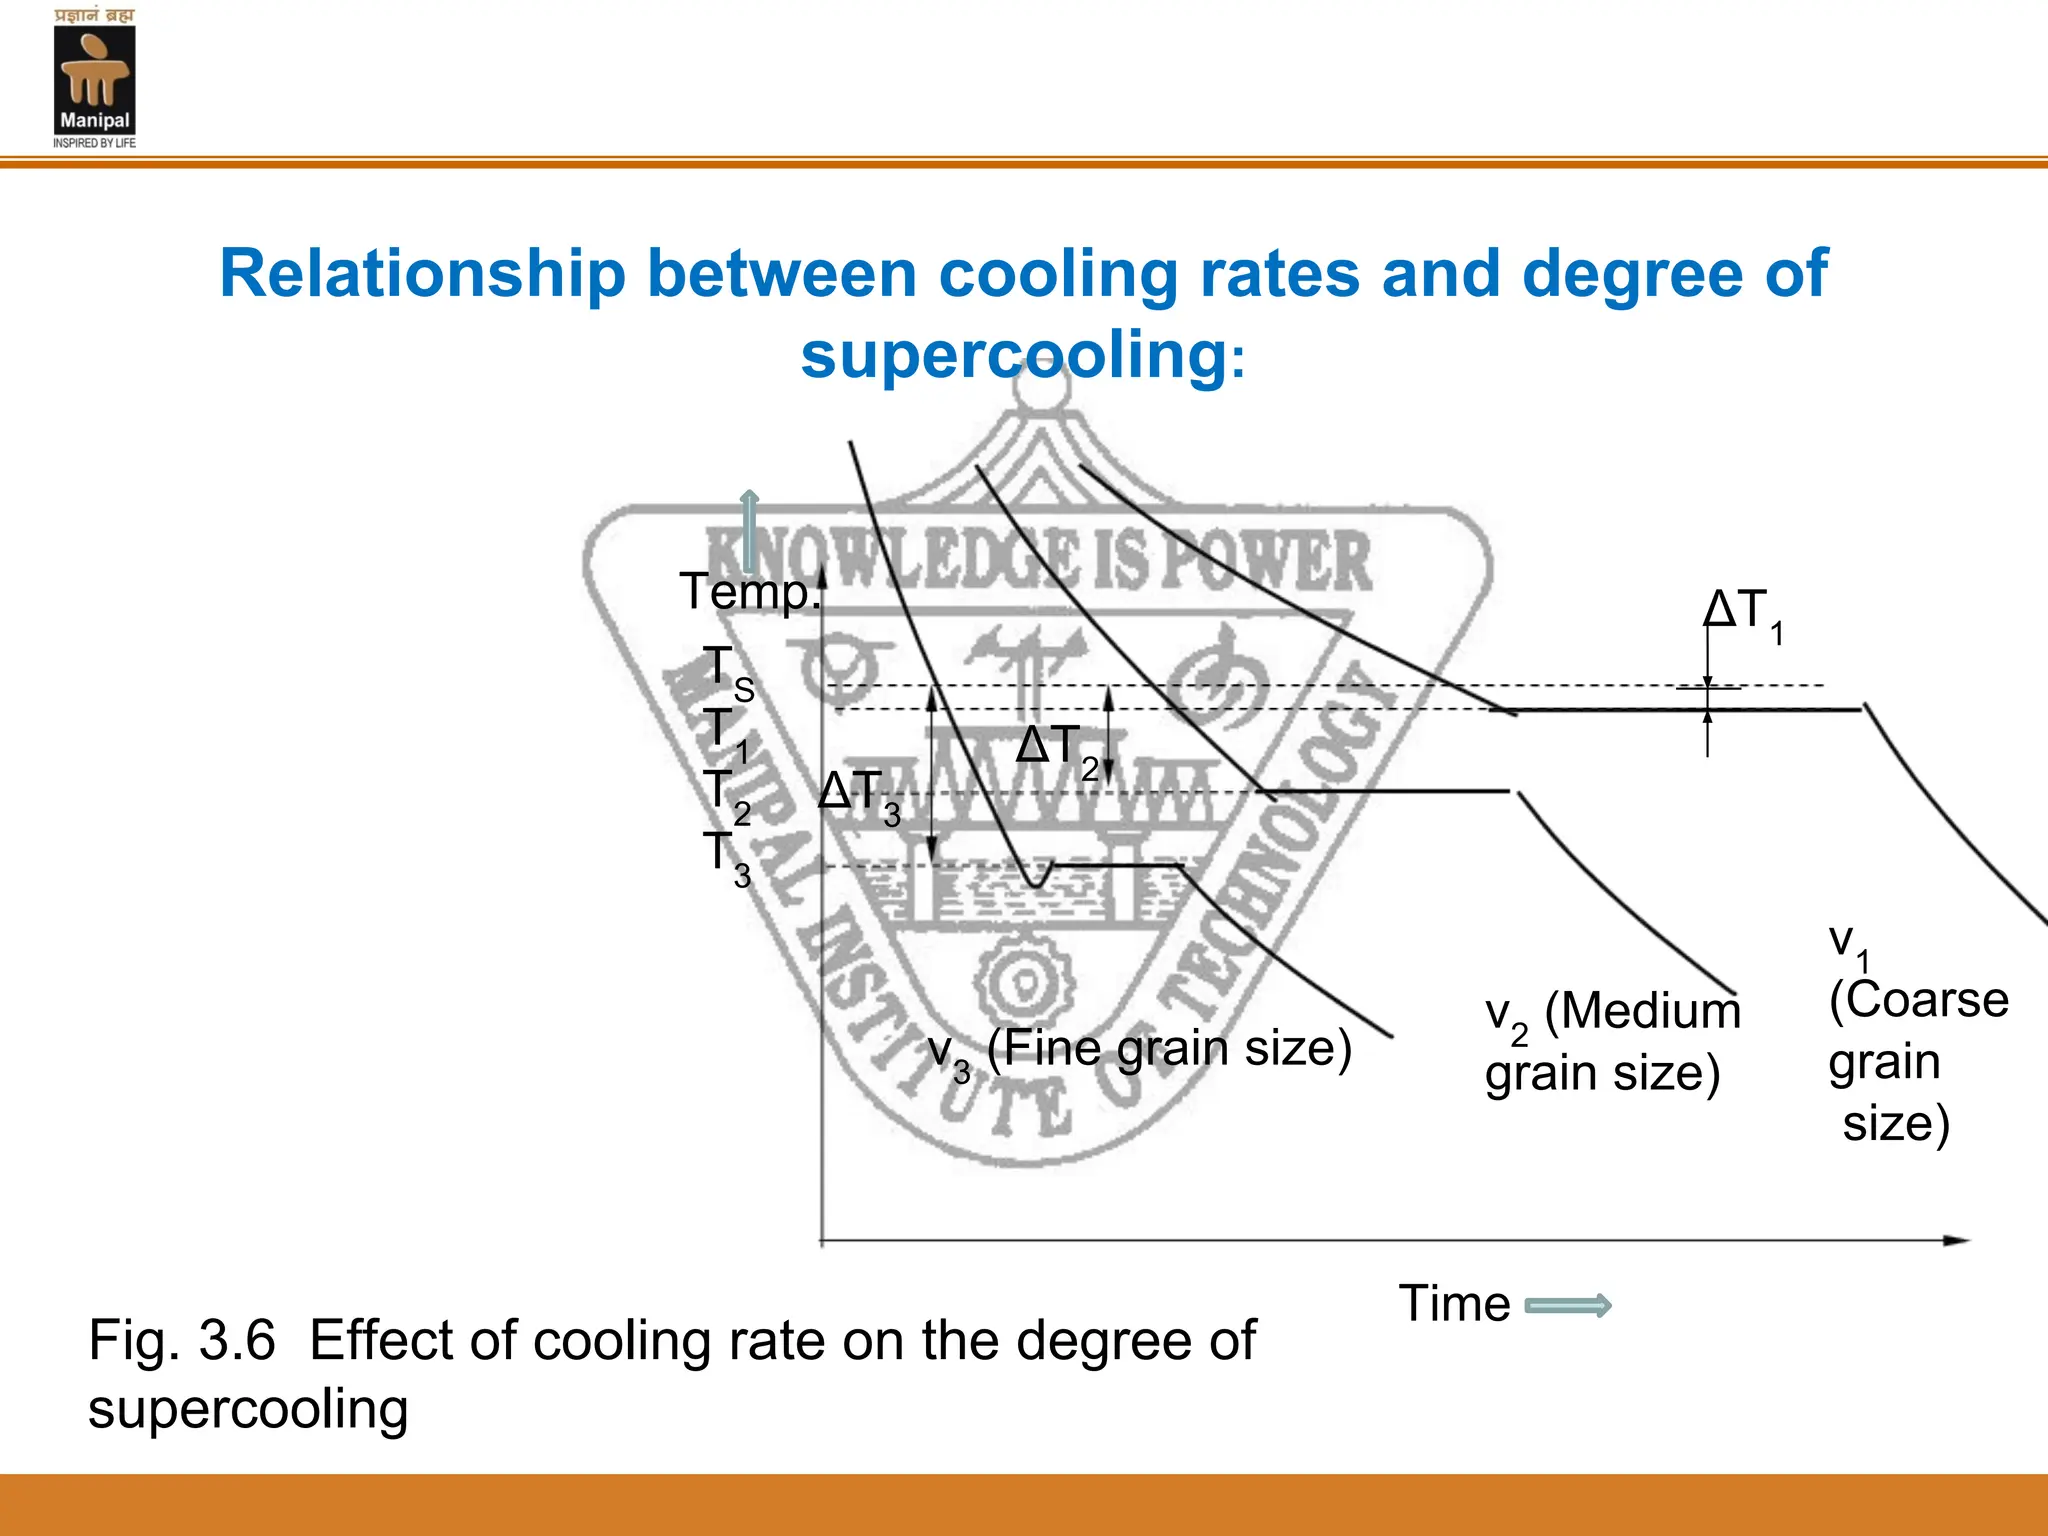
3. The rate of nucleation and crystal growth determine the final grain size, where a higher nucleation rate leads to a finer grain structure. Cooling rate also