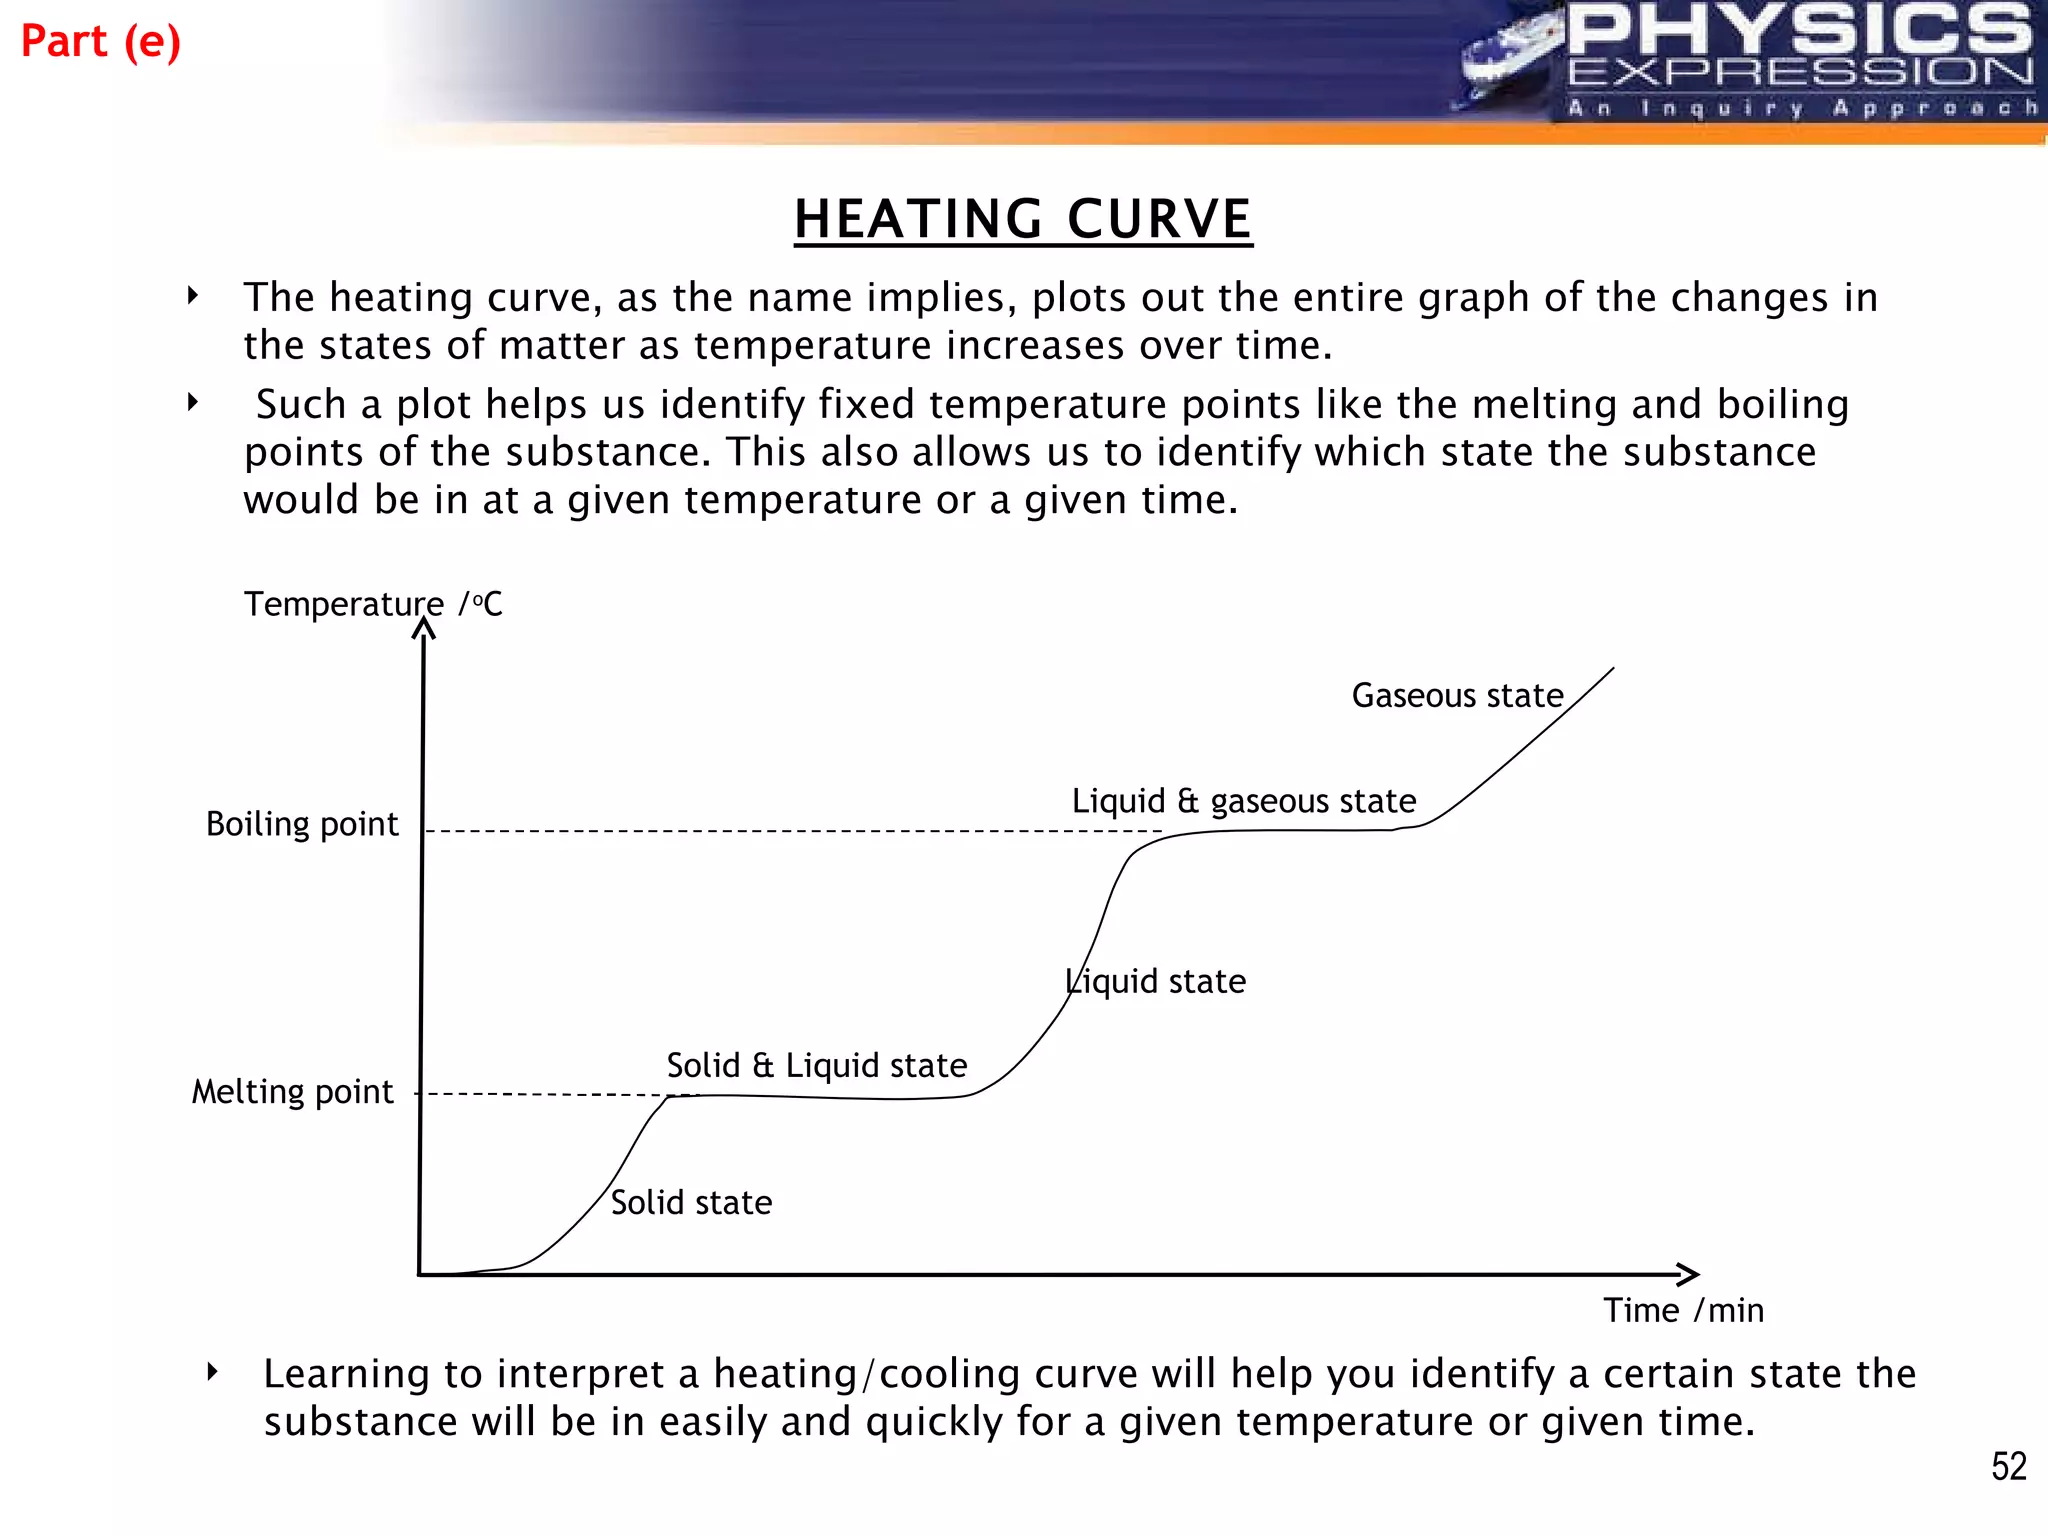
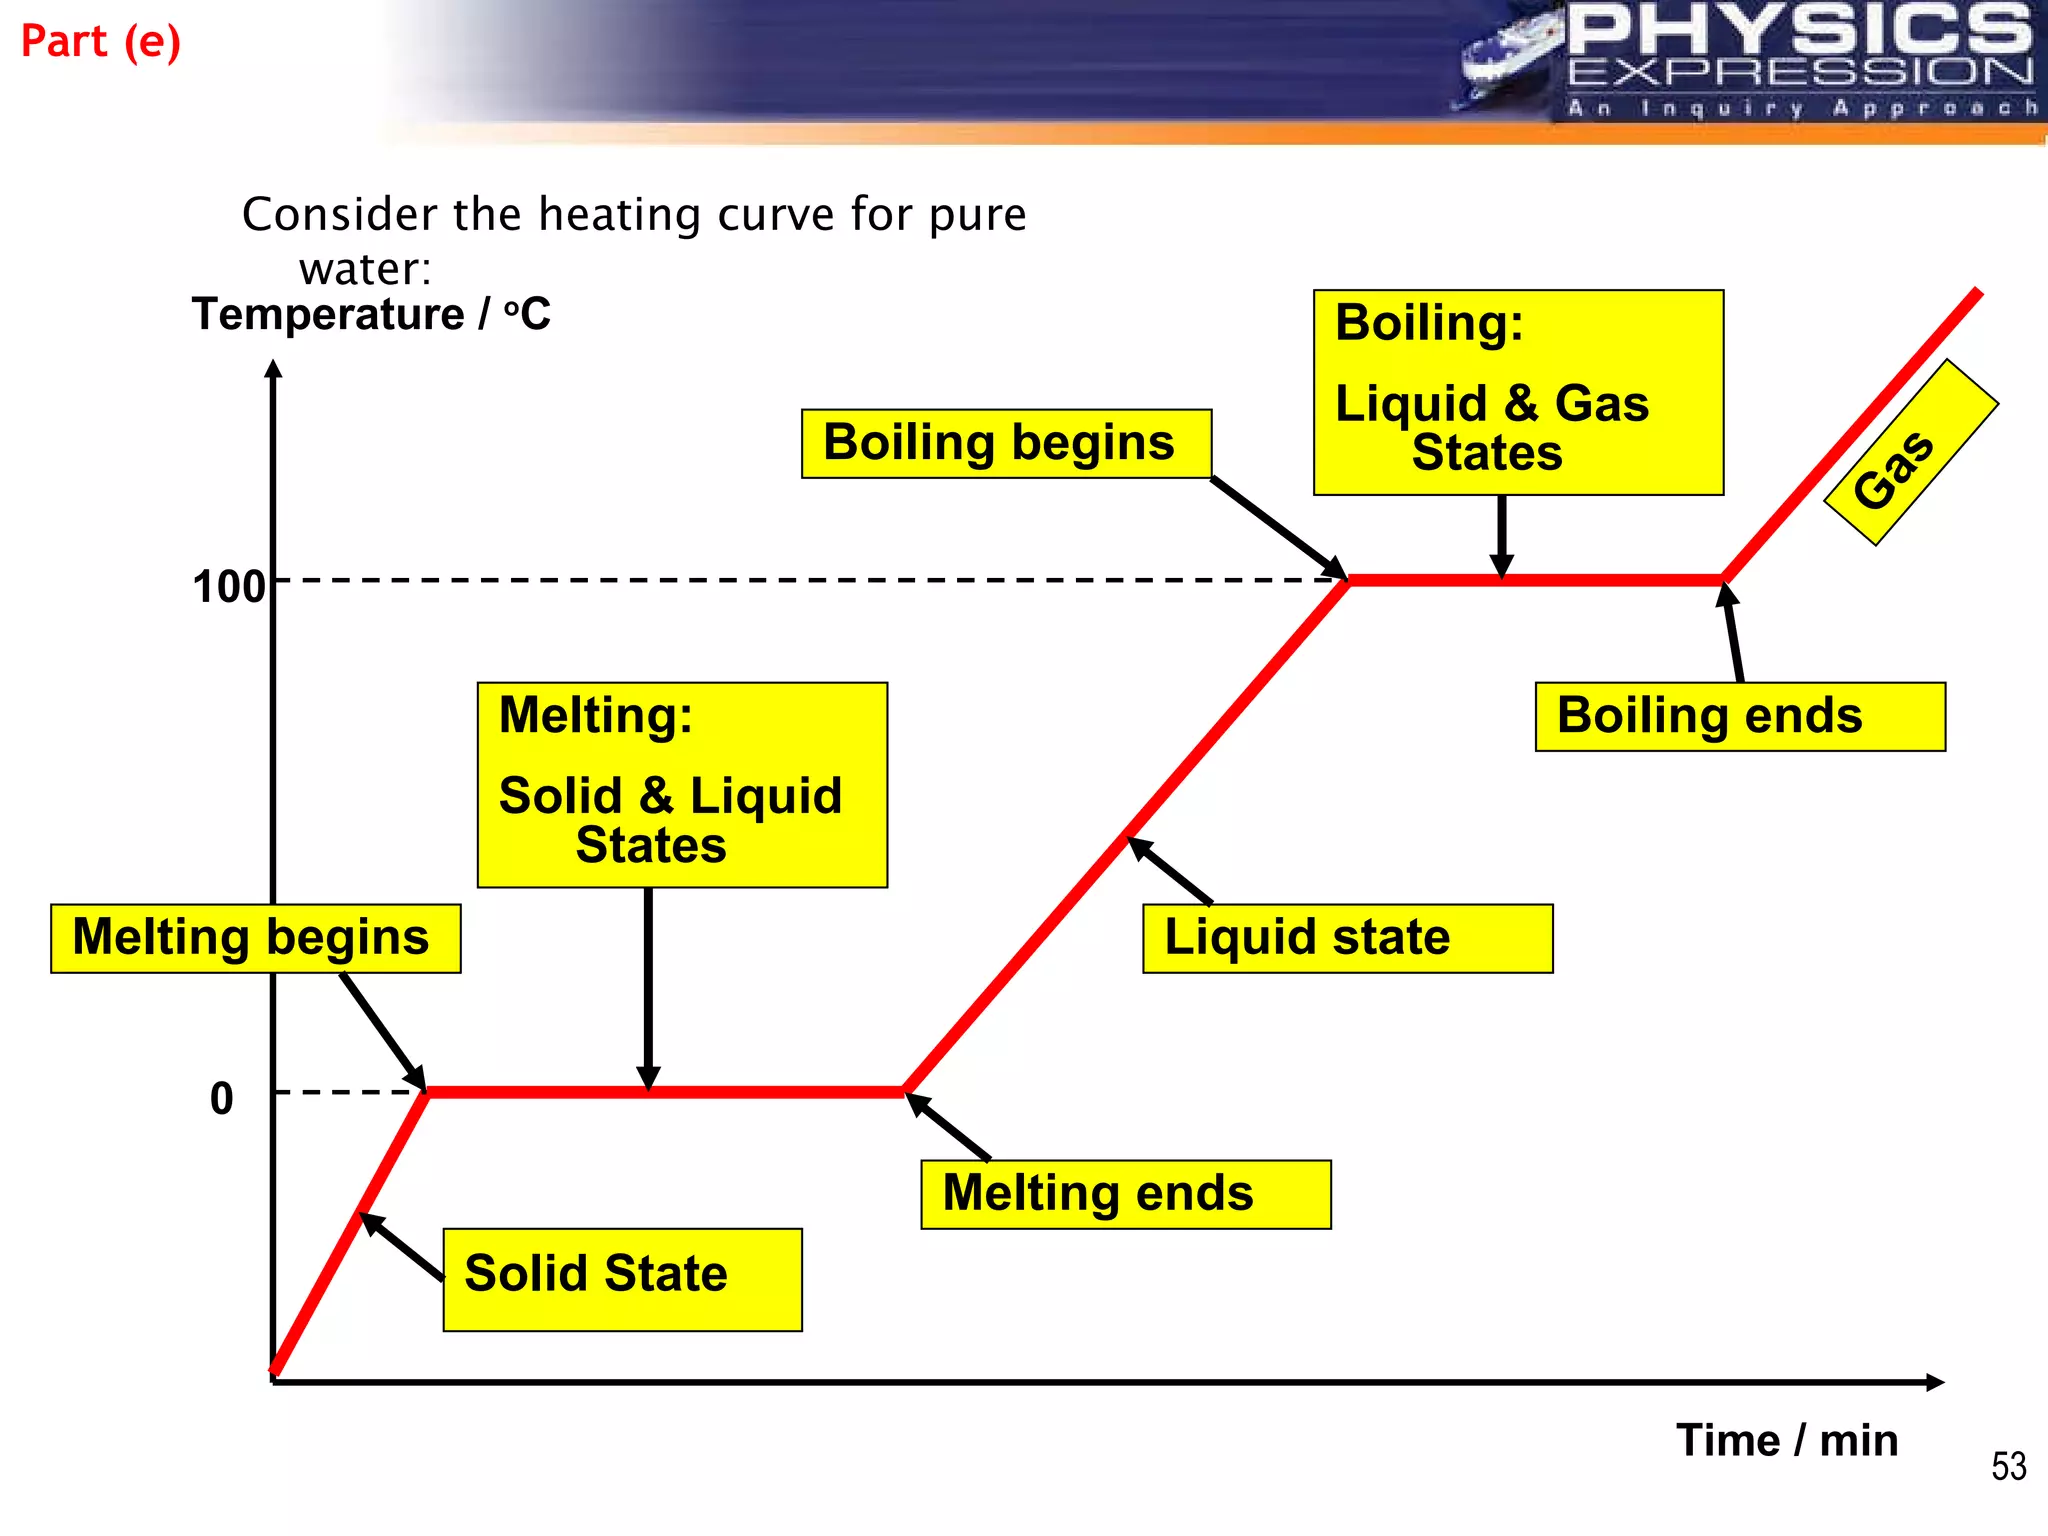
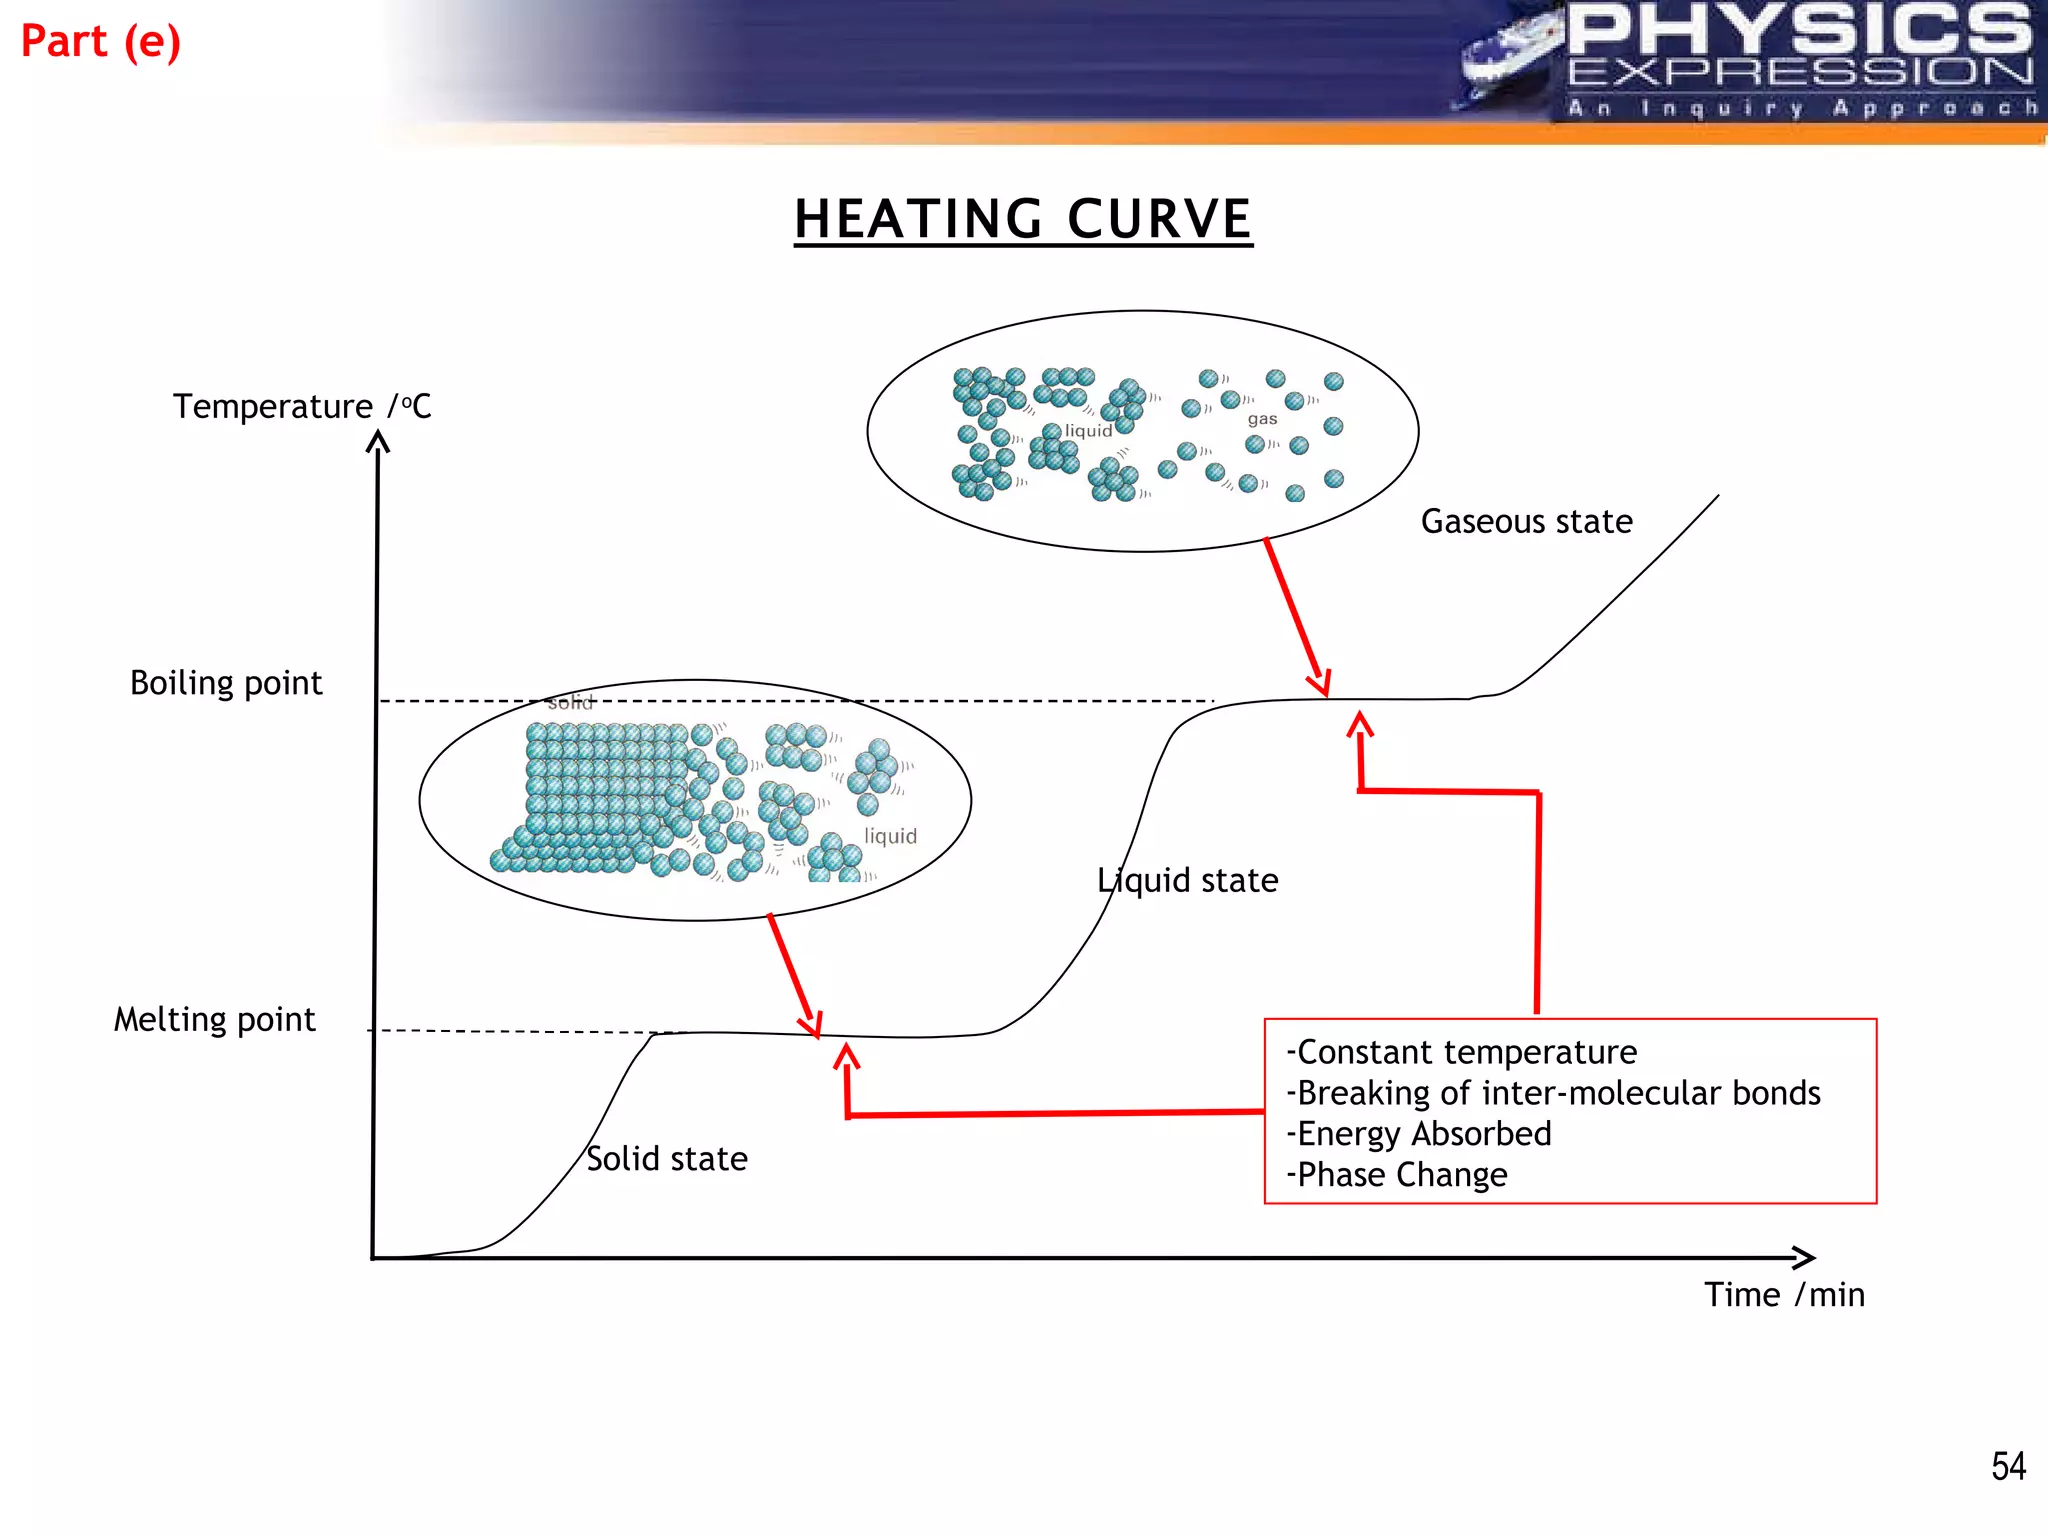
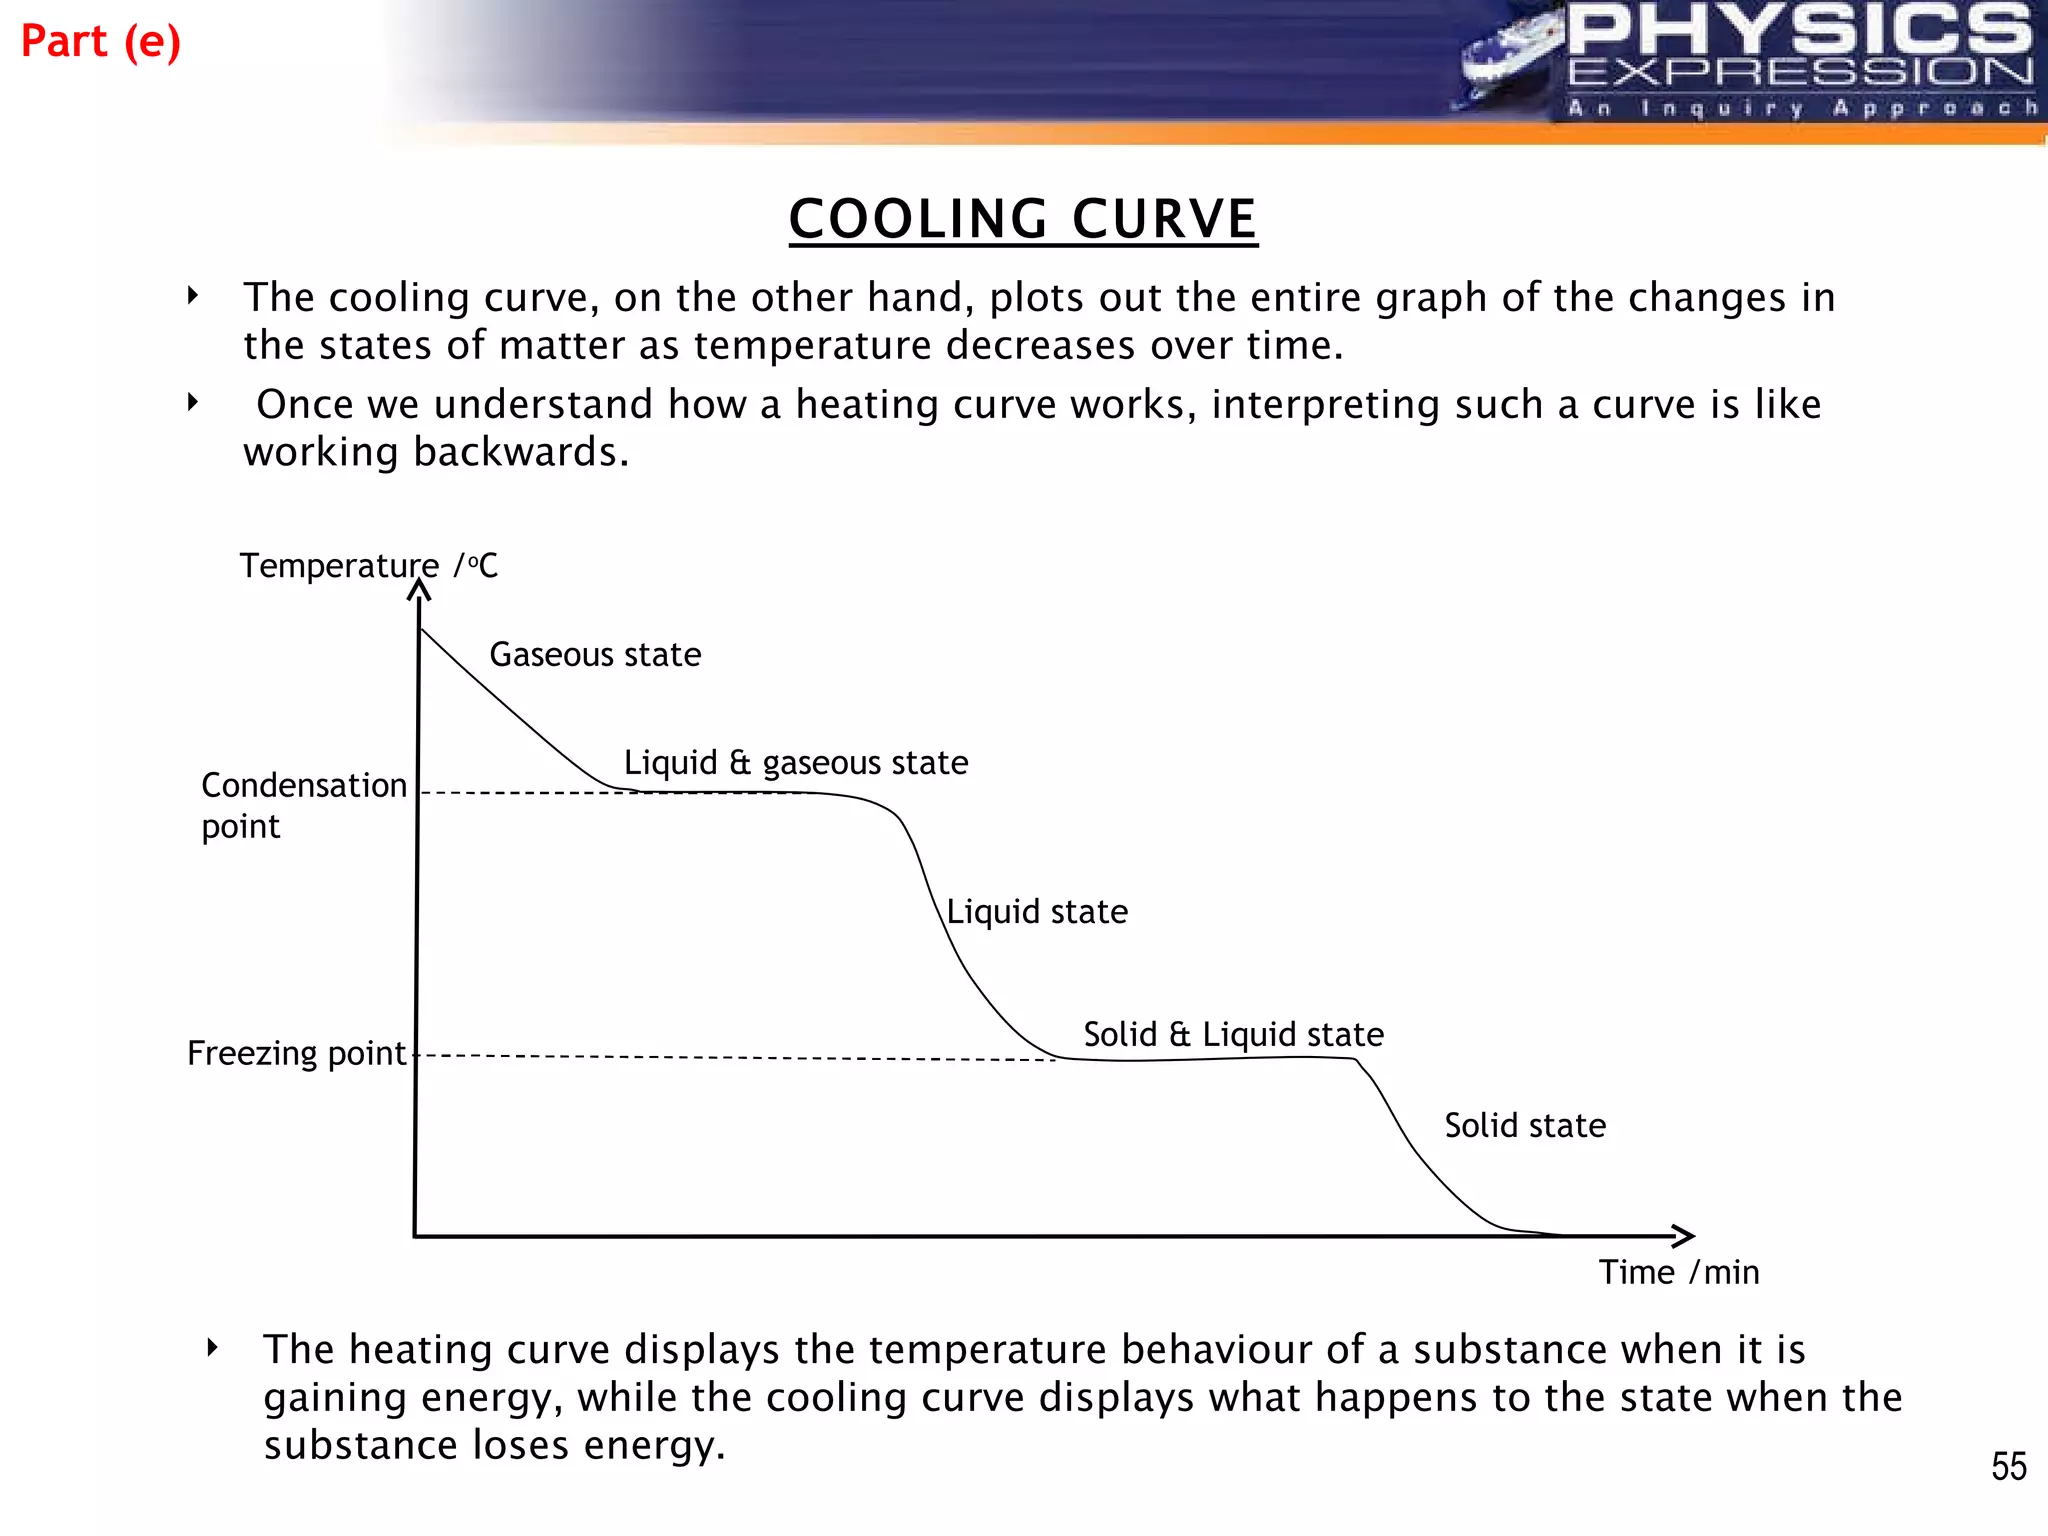
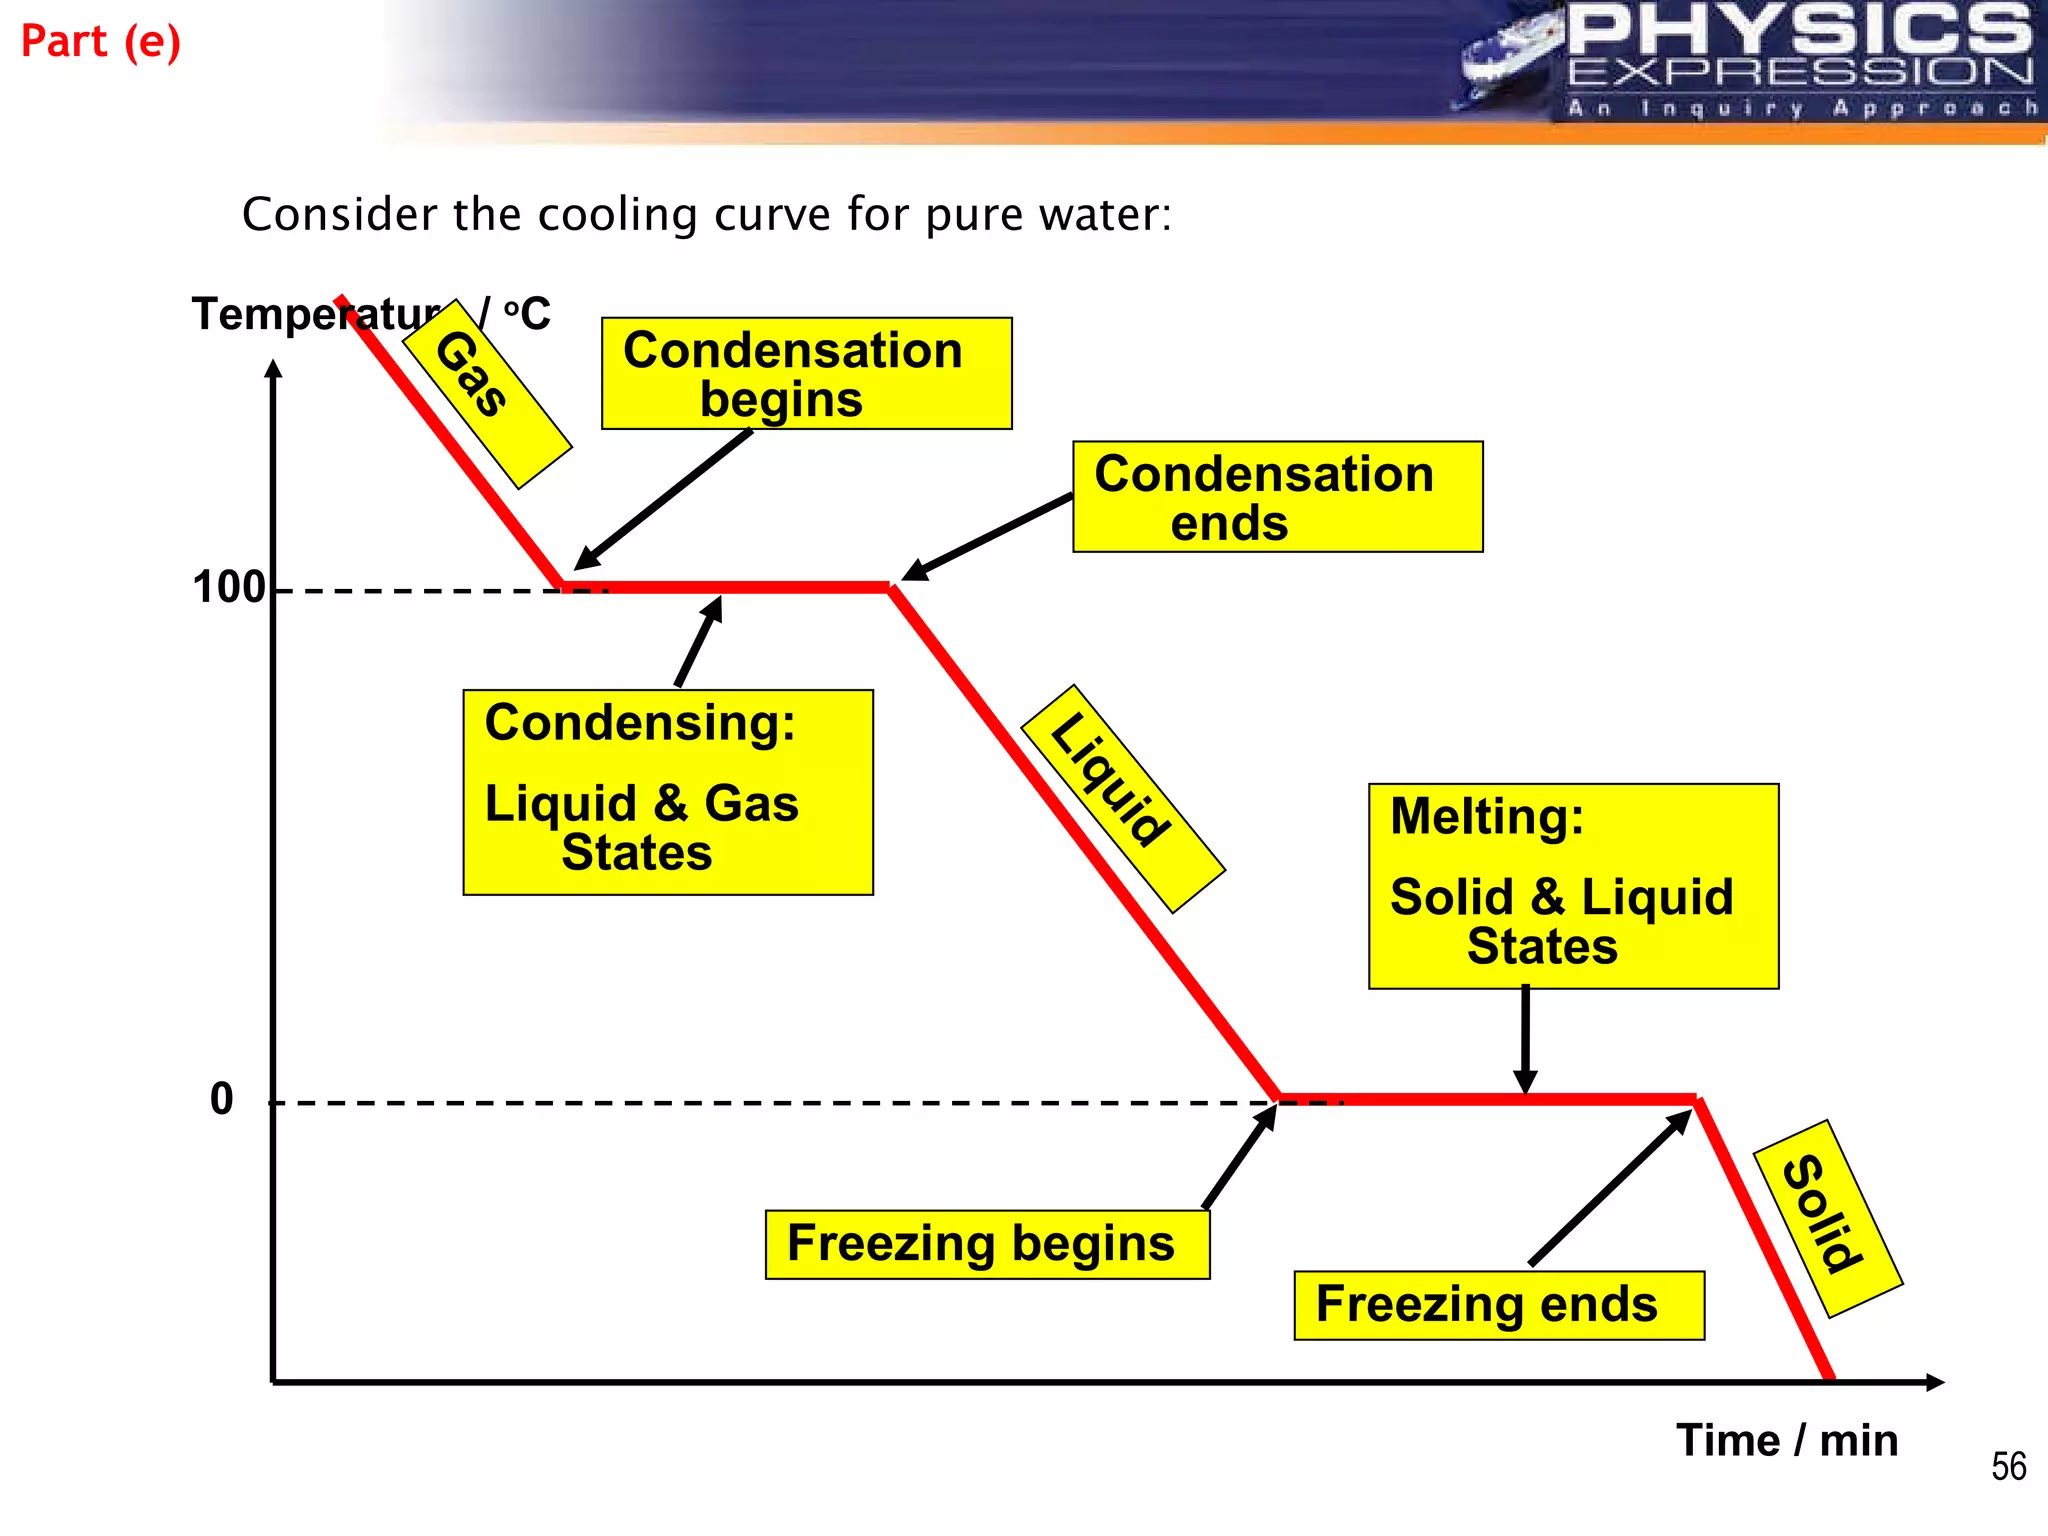
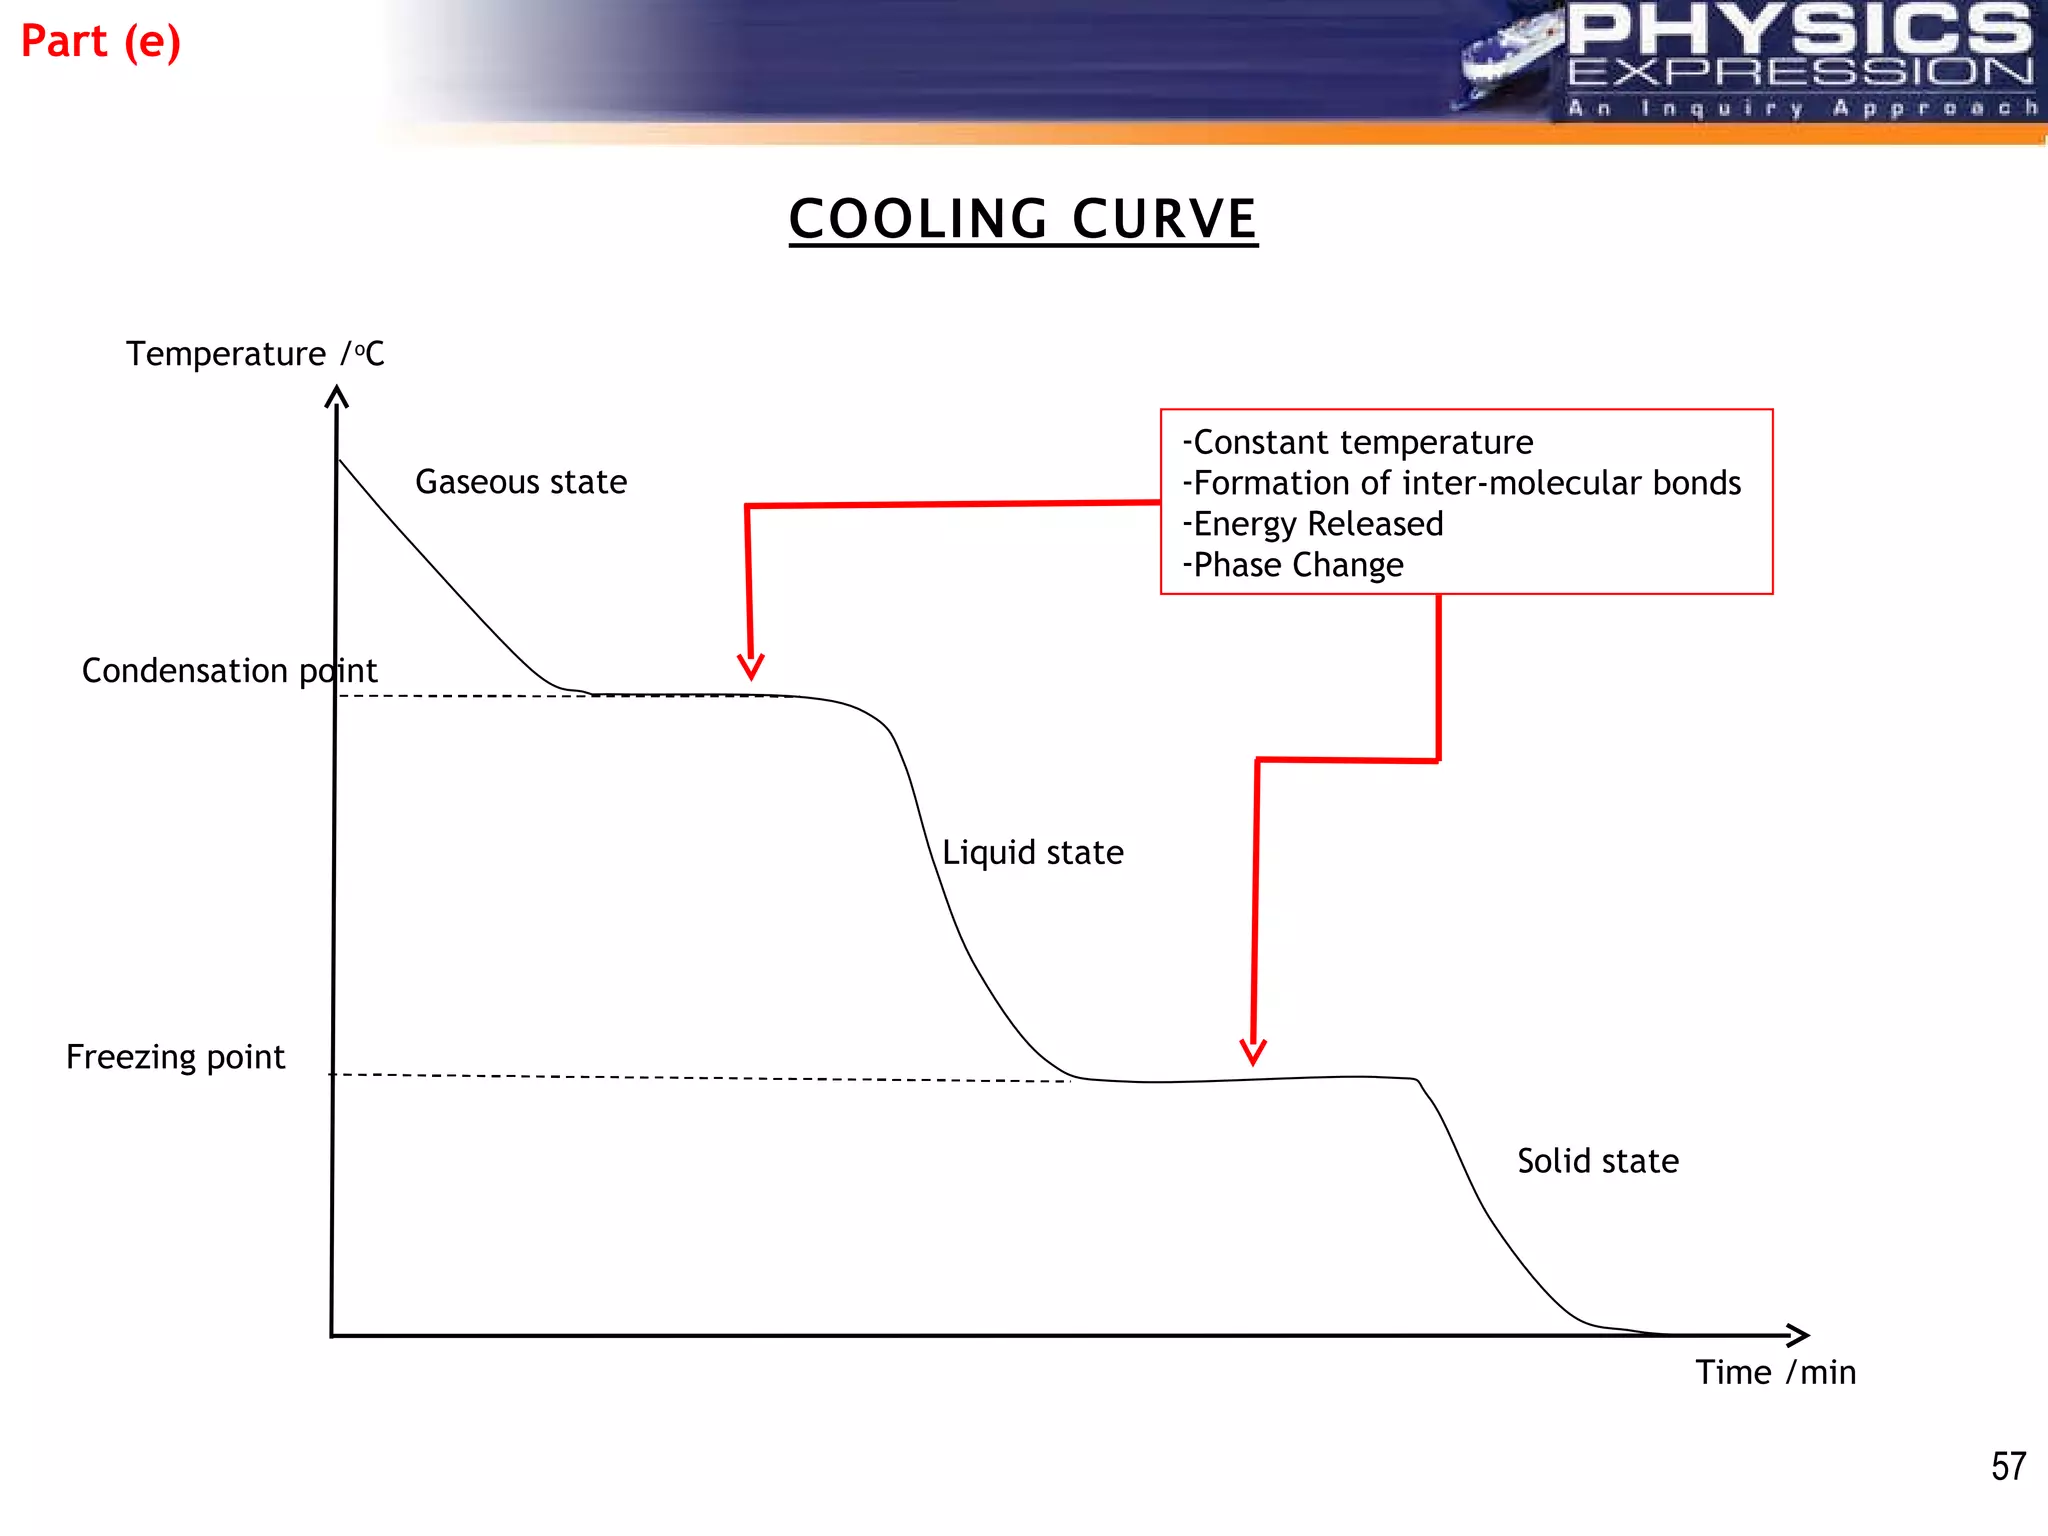
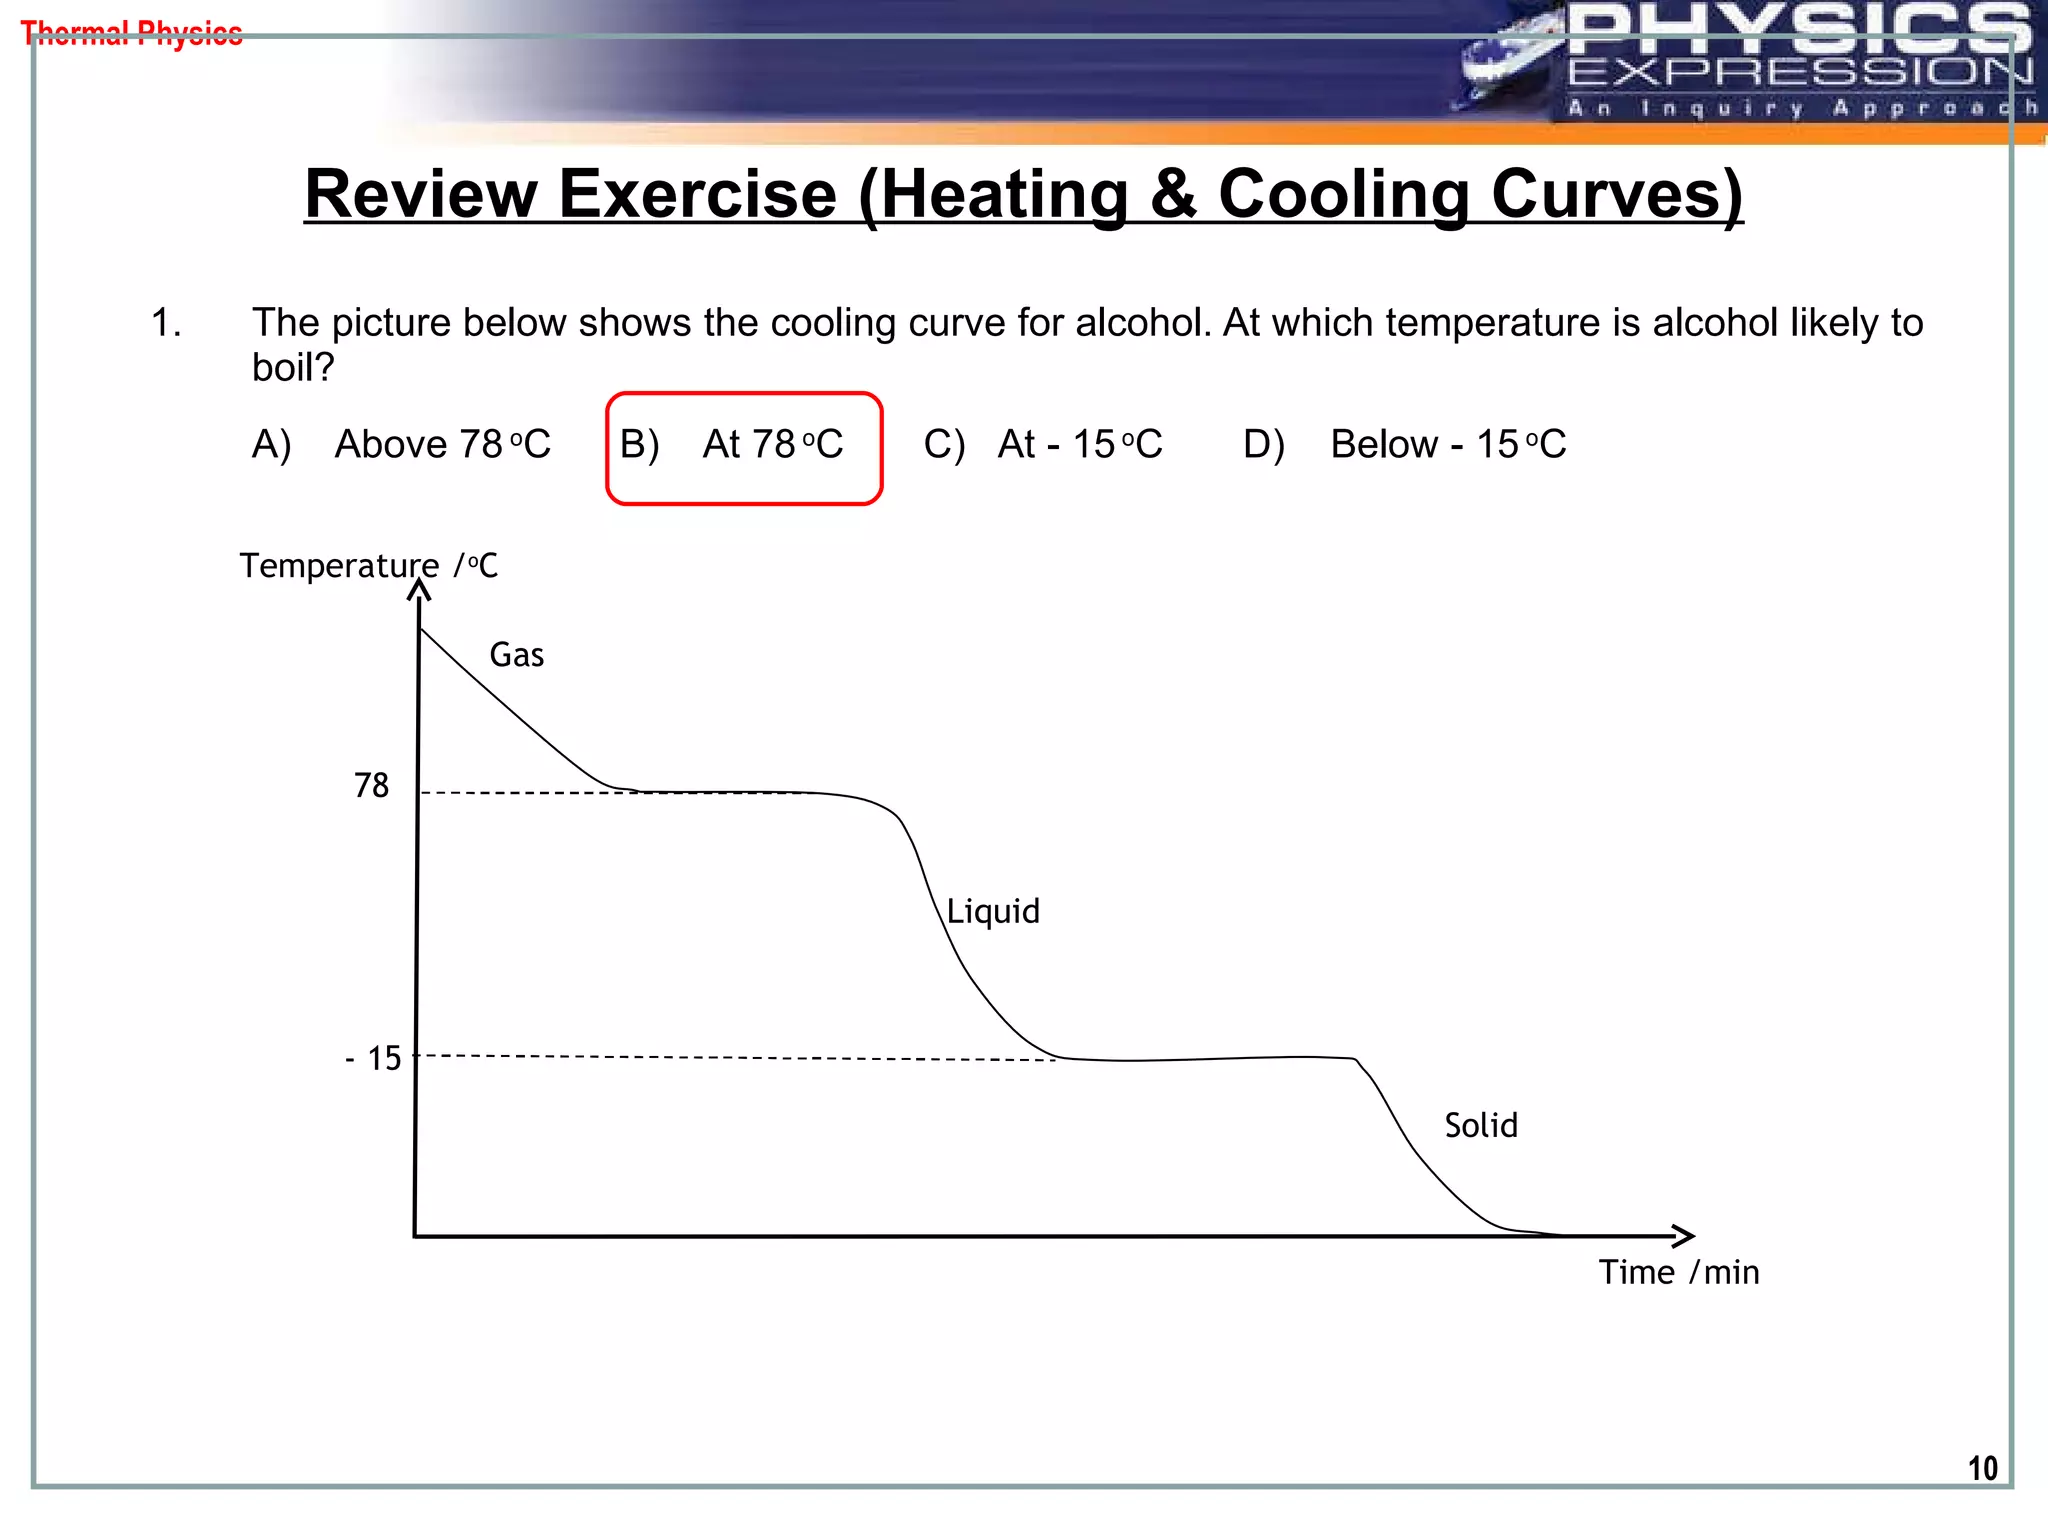
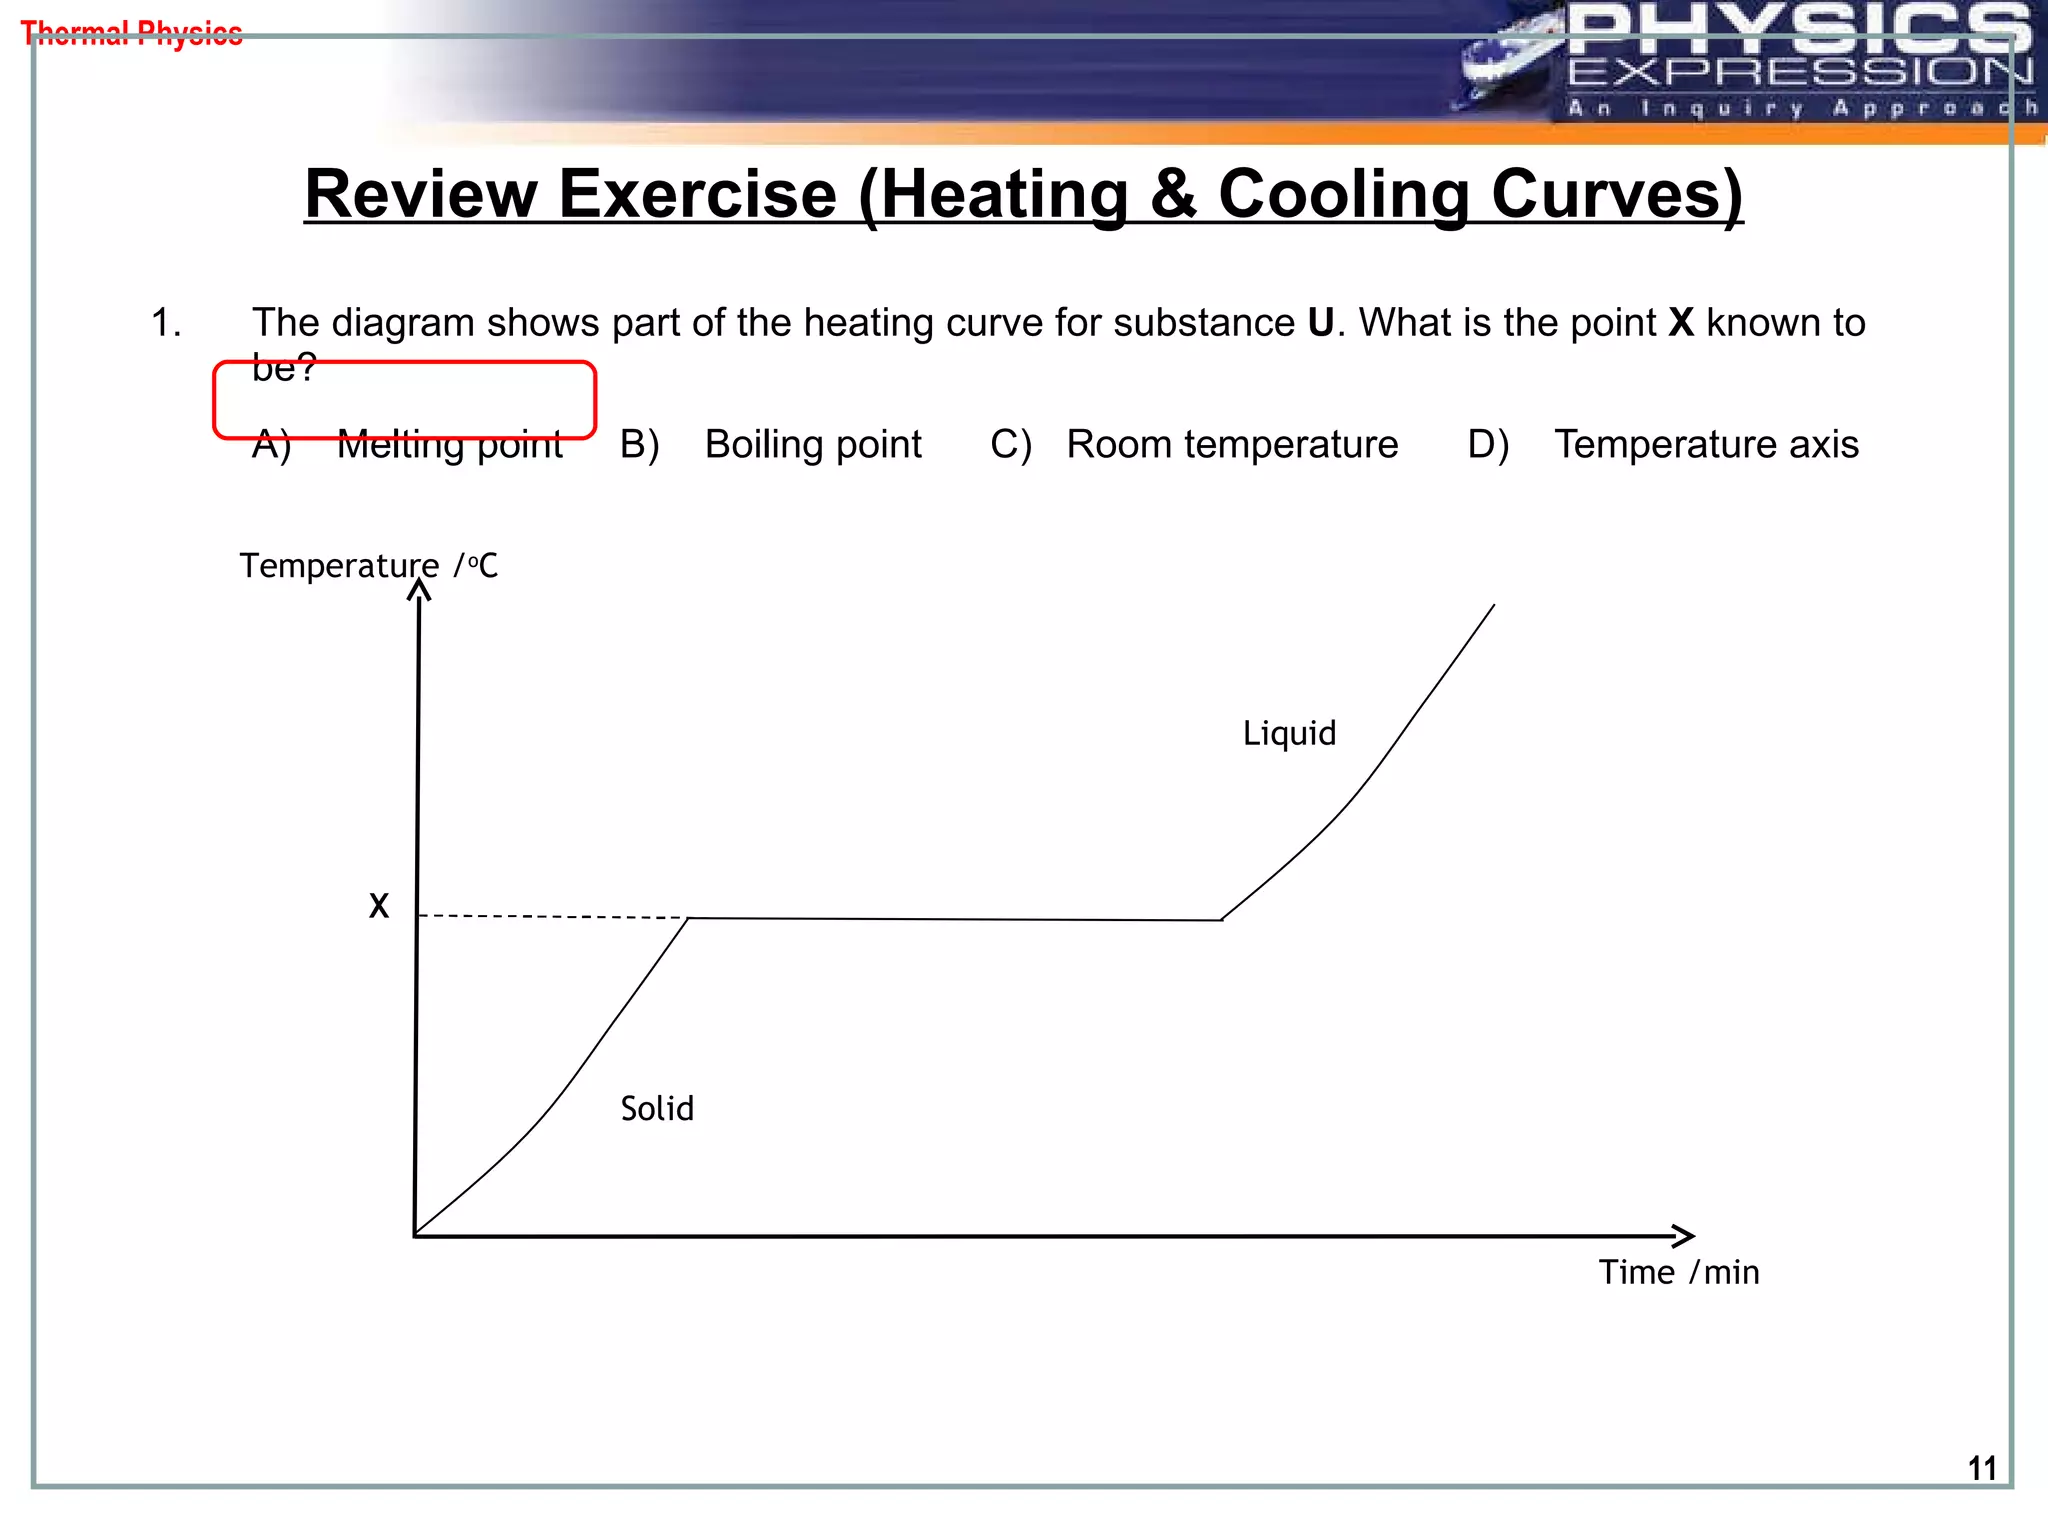
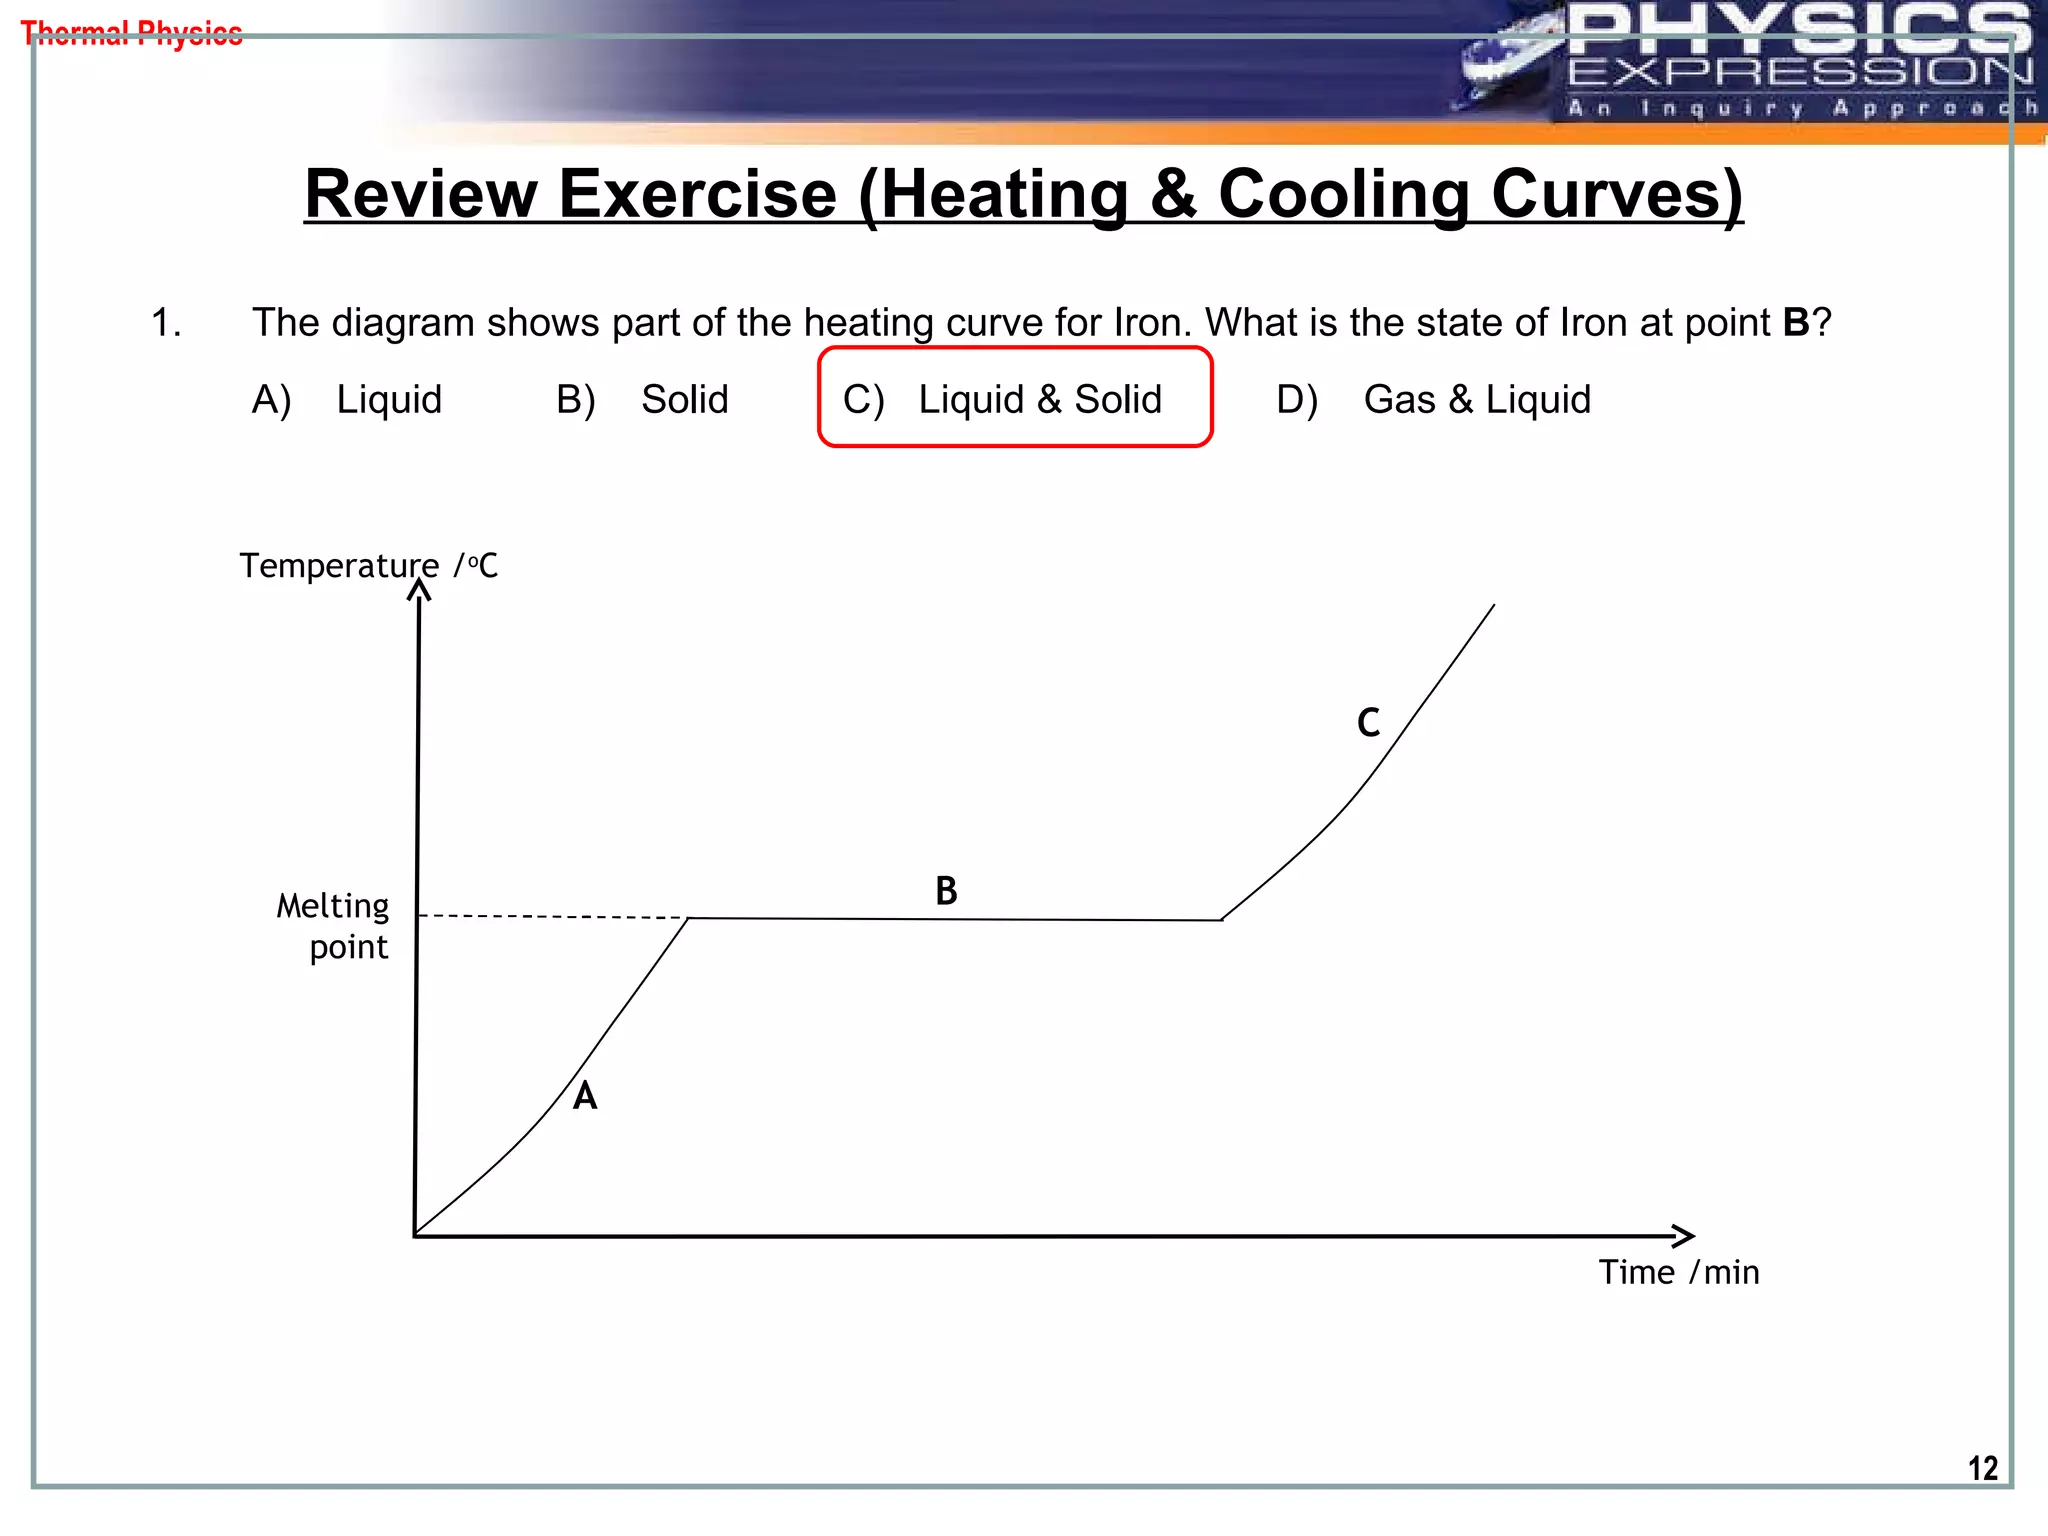
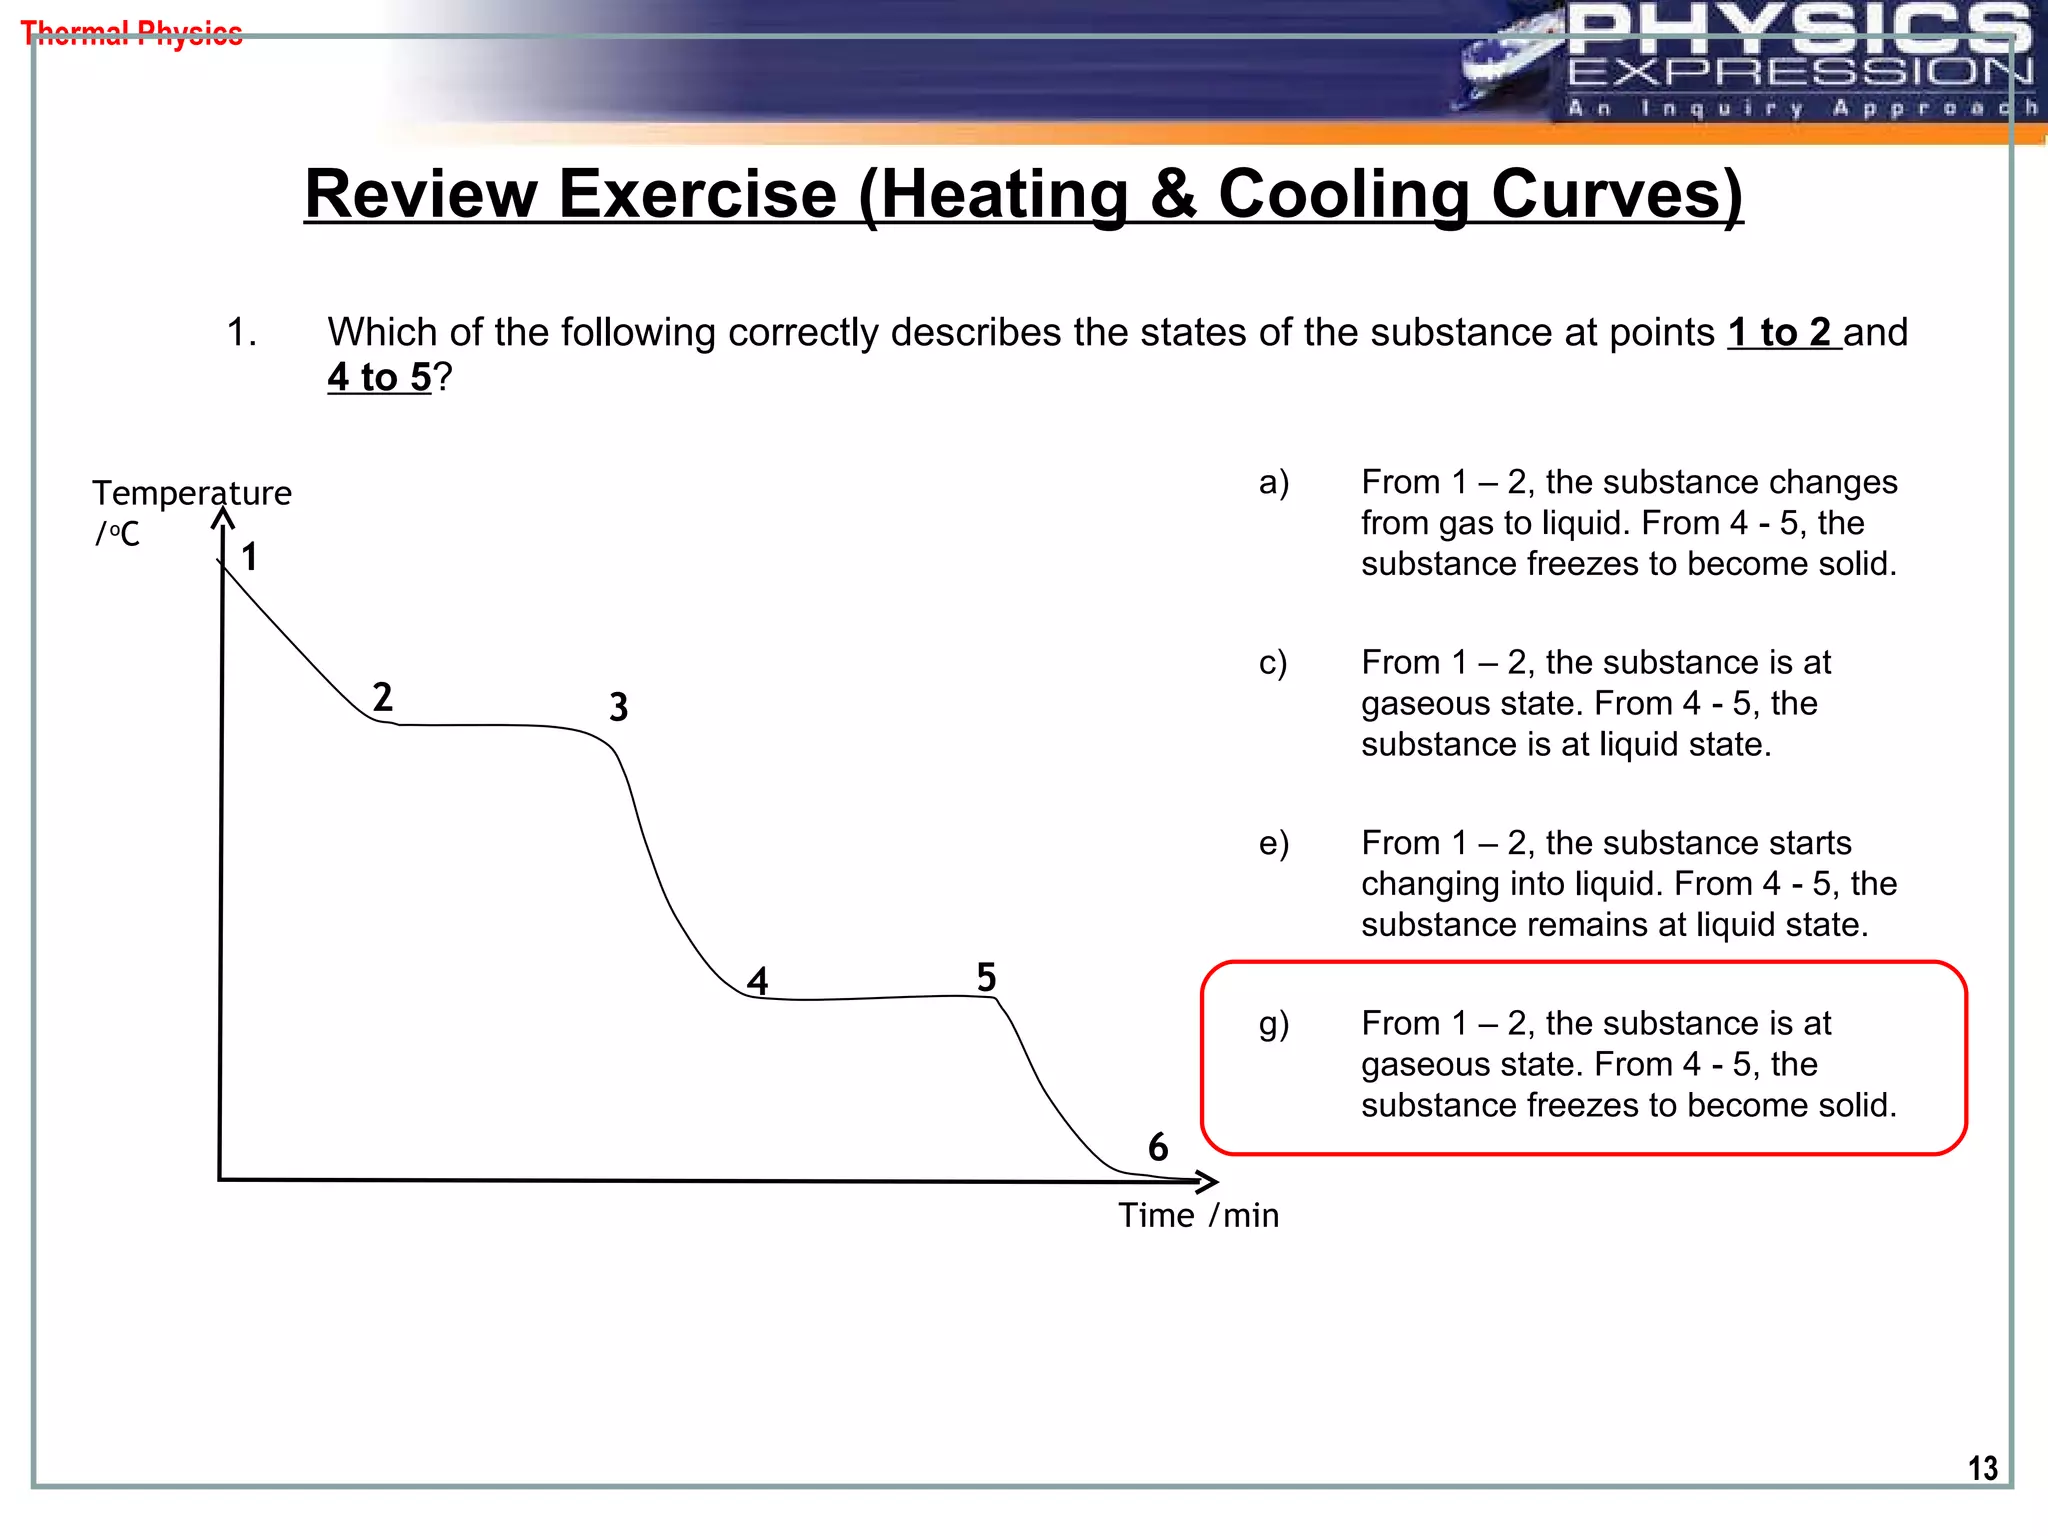
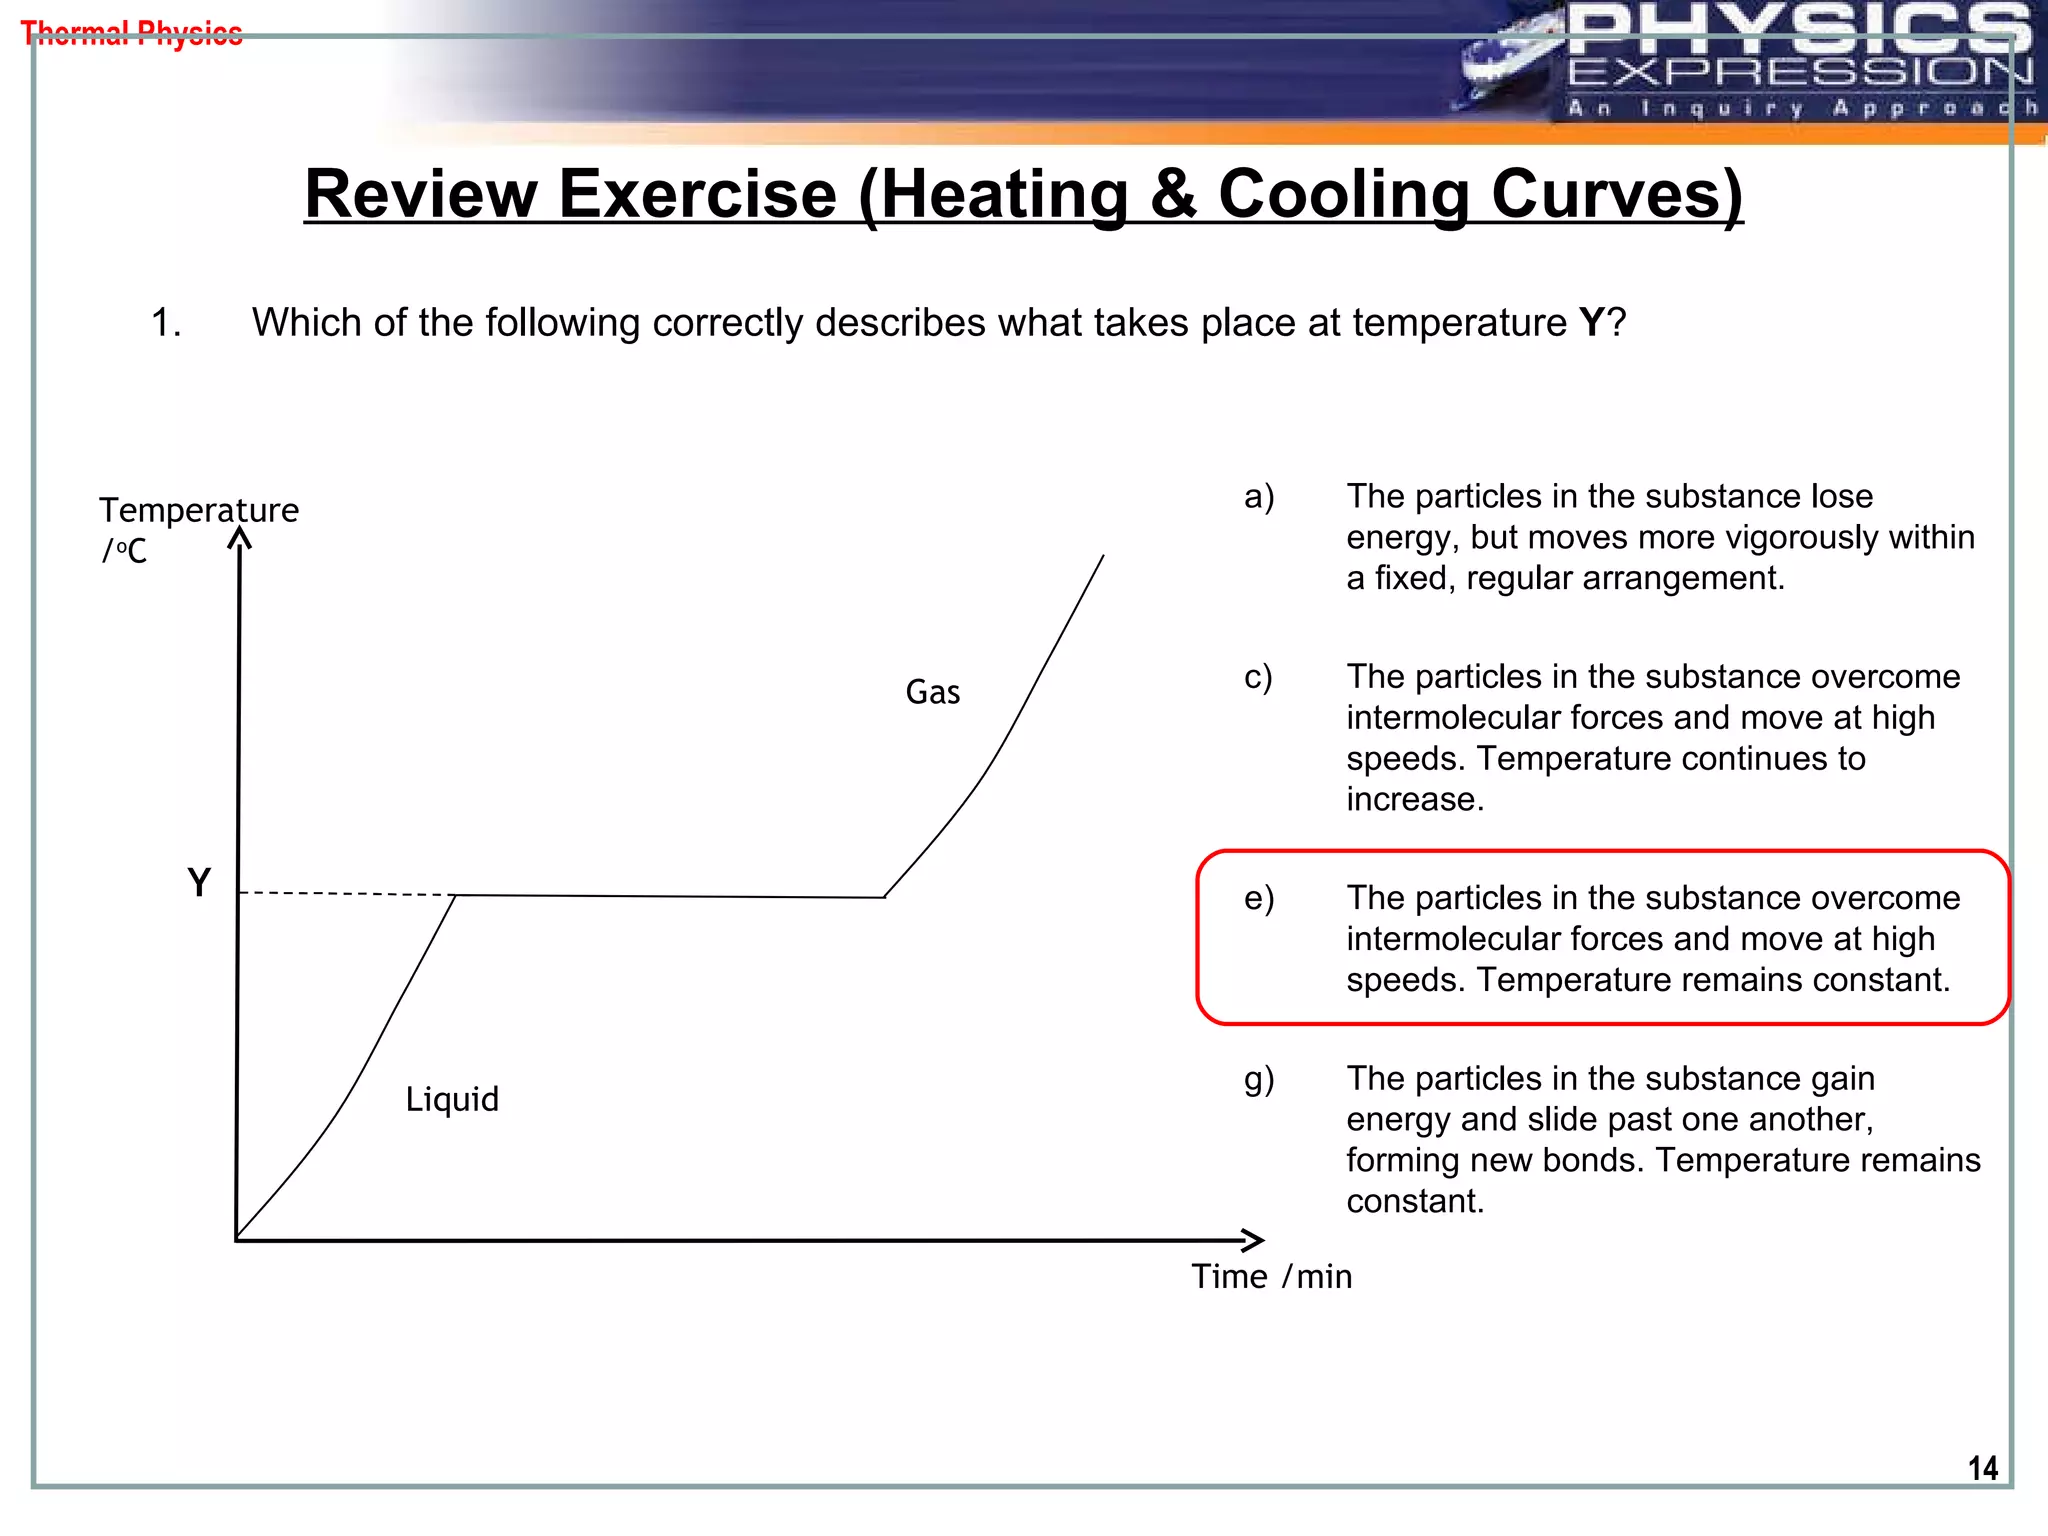
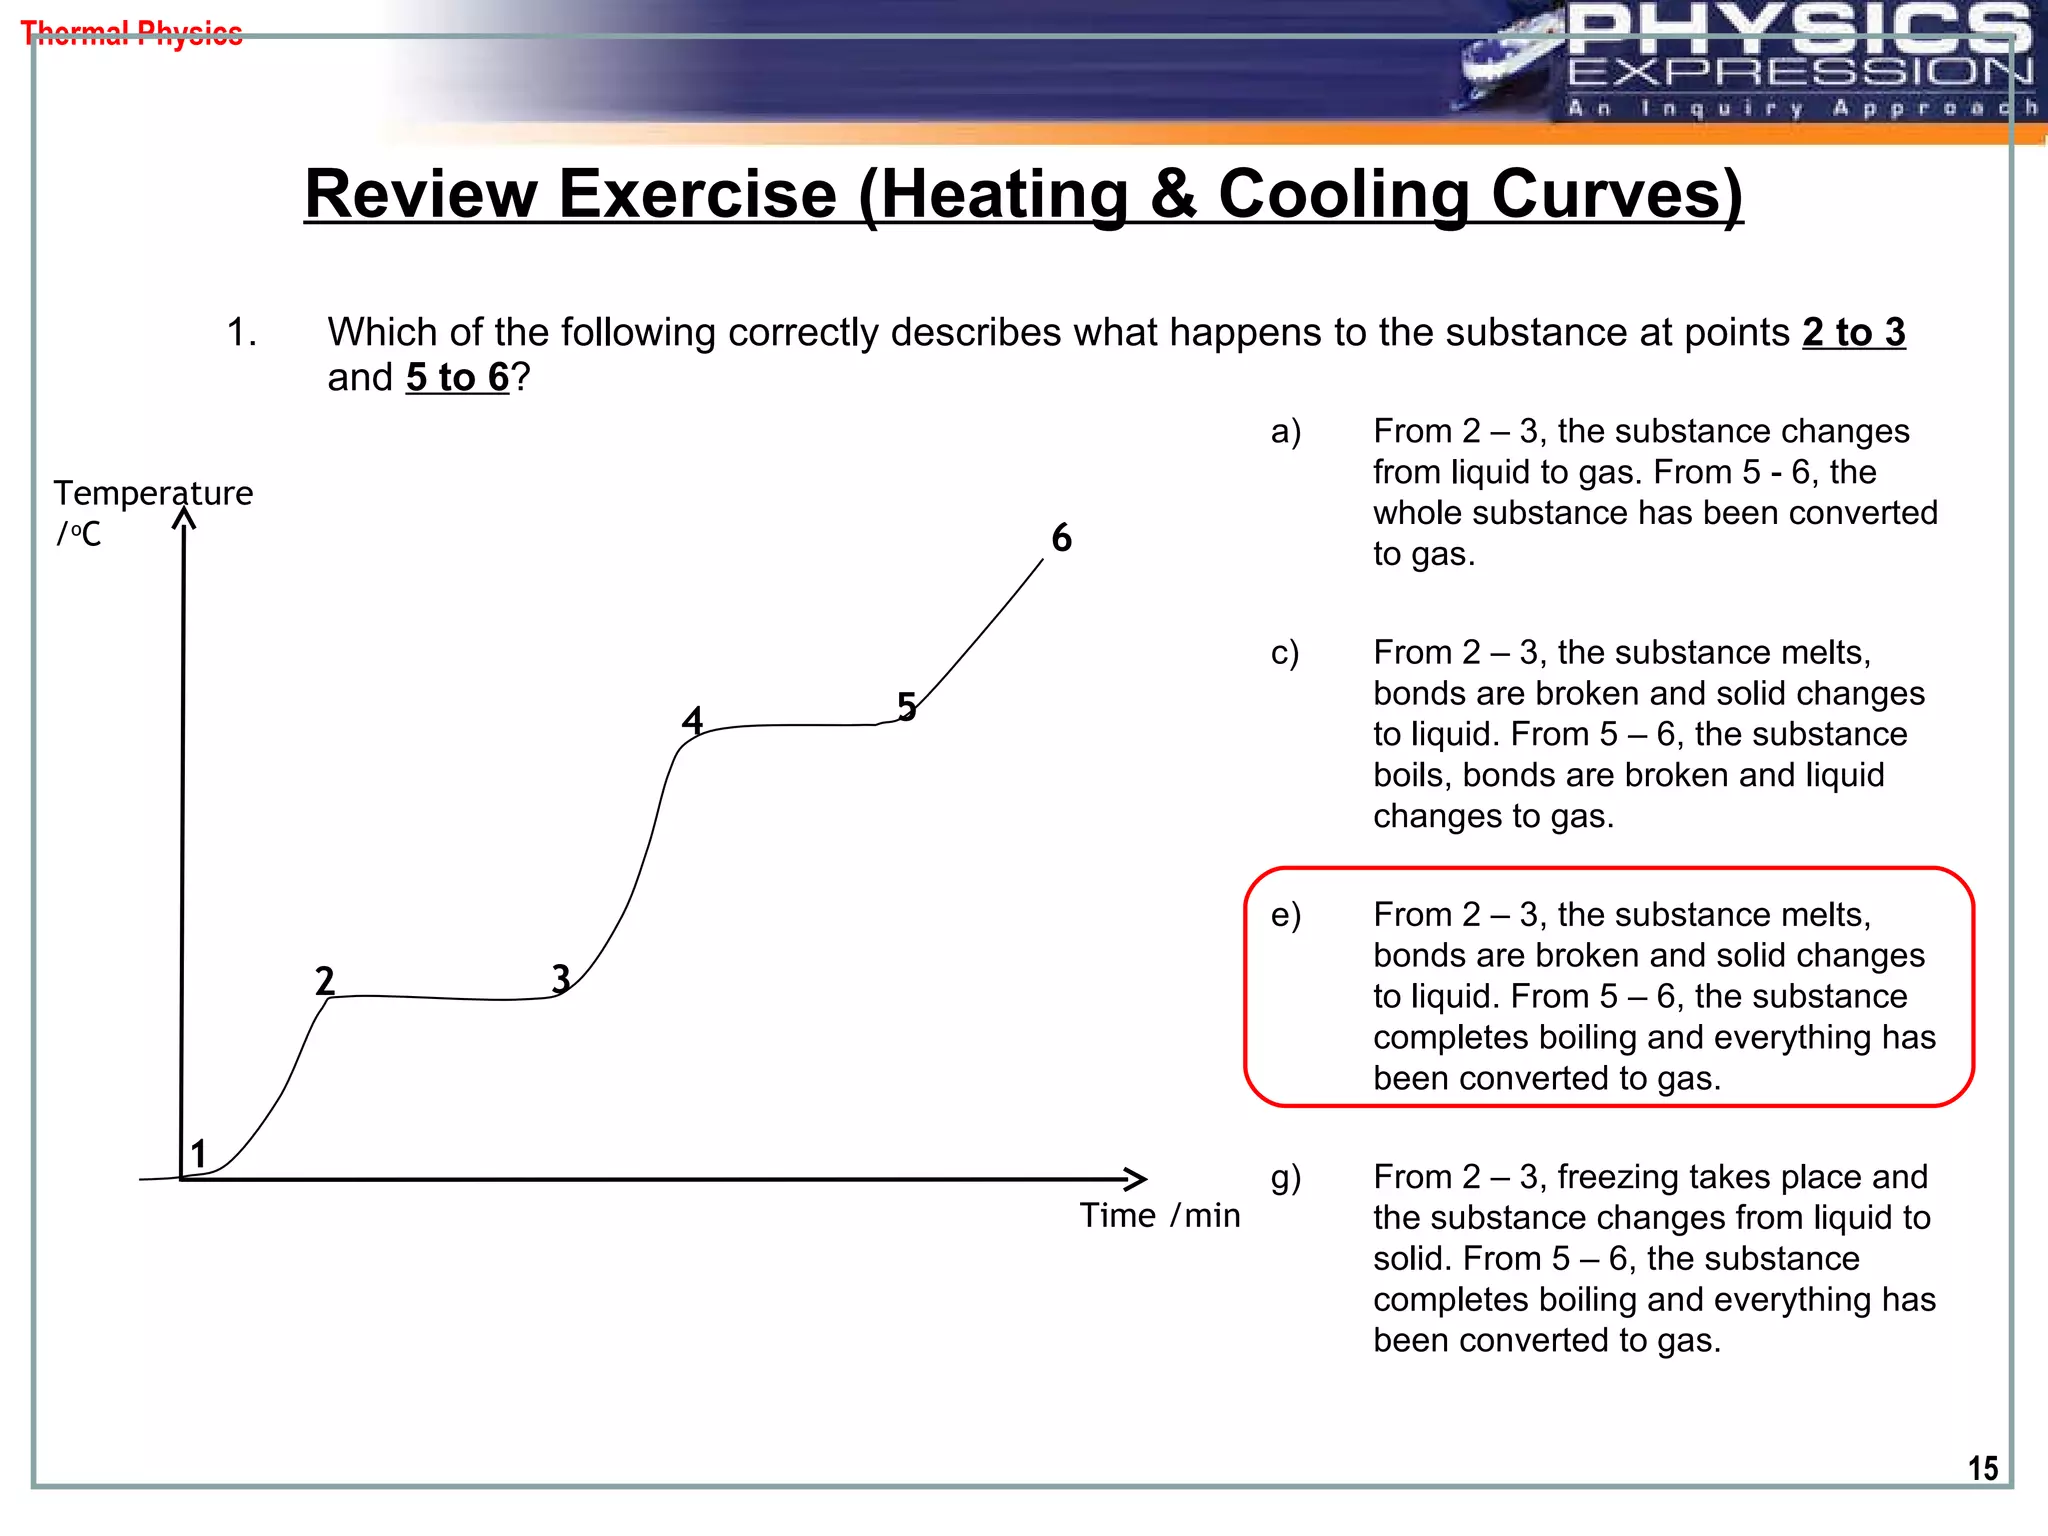
PARTICULATE MODEL  OF MATTER Interactive Science Volume A Chapter 11
Part (e) Heating & Cooling Curves
HEATING CURVE The heating curve, as the name implies, plots out the entire graph of the changes in the states of matter as temperature increases over time.  Such a plot helps us identify fixed temperature points like the melting and boiling points of the substance. This also allows us to identify which state the substance would be in at a given temperature or a given time. Part (e) Learning to interpret a heating/cooling curve will help you identify a certain state the substance will be in easily and quickly for a given temperature or given time. 52                                            Temperature / o C Time /min Boiling point Melting point Solid state Solid & Liquid state Liquid state Liquid & gaseous state Gaseous state
Temperature /  o C Time / min 0 100 Solid State Melting: Solid & Liquid States Melting begins Melting ends Liquid state Boiling: Liquid & Gas States Boiling begins Boiling ends Gas Consider the heating curve for pure water: Part (e) 53                                                                                        
HEATING CURVE Temperature / o C Time /min Boiling point Melting point Solid state Liquid state Gaseous state Part (e) Constant temperature Breaking of inter-molecular bonds Energy Absorbed Phase Change 54                                           
COOLING CURVE The cooling curve, on the other hand, plots out the entire graph of the changes in the states of matter as temperature decreases over time.  Once we understand how a heating curve works, interpreting such a curve is like working backwards. Part (e) The heating curve displays the temperature behaviour of a substance when it is gaining energy, while the cooling curve displays what happens to the state when the substance loses energy. 55                                            Temperature / o C Time /min Condensation point Freezing point Solid state Solid & Liquid state Liquid state Liquid & gaseous state Gaseous state
Temperature /  o C Time / min 0 100 Solid Melting: Solid & Liquid States Freezing begins Freezing ends Liquid Condensing: Liquid & Gas States Condensation begins Condensation ends Gas Consider the cooling curve for pure water: Part (e) 56                                                                                        
COOLING CURVE Part (e) Temperature / o C Time /min Condensation point Freezing point Solid state Liquid state Gaseous state Constant temperature Formation of inter-molecular bonds Energy Released Phase Change 57                                           
Let’s Review
The picture below shows the cooling curve for alcohol. At which temperature is alcohol likely to boil?  A)  Above 78  o C   B)  At 78  o C   C)  At - 15  o C   D)  Below - 15  o C Review Exercise (Heating & Cooling Curves) Temperature / o C Time /min 78 - 15 Solid  Liquid  Gas
The diagram shows part of the heating curve for substance  U . What is the point  X  known to be?  A)  Melting point  B)  Boiling point  C)  Room temperature  D)  Temperature axis Review Exercise (Heating & Cooling Curves) Temperature / o C Time /min X Solid  Liquid
The diagram shows part of the heating curve for Iron. What is the state of Iron at point  B ?  A)  Liquid  B)  Solid  C)  Liquid & Solid  D)  Gas & Liquid Review Exercise (Heating & Cooling Curves) Temperature / o C Time /min Melting point A  B  C
Which of the following correctly describes the states of the substance at points  1 to 2  and   4 to 5 ?  Review Exercise (Heating & Cooling Curves) Temperature / o C Time /min 1 2 3 4 5 6 From 1 – 2, the substance changes from gas to liquid. From 4 - 5, the substance freezes to become solid. From 1 – 2, the substance is at gaseous state. From 4 - 5, the substance is at liquid state. From 1 – 2, the substance starts changing into liquid. From 4 - 5, the substance remains at liquid state. From 1 – 2, the substance  is at gaseous state . From 4 - 5, the substance freezes to become solid.
Which of the following correctly describes what takes place at temperature  Y ?  Review Exercise (Heating & Cooling Curves) The particles in the substance lose energy, but moves more vigorously within a fixed, regular arrangement. The particles in the substance overcome intermolecular forces and move at high speeds. Temperature continues to increase.  The particles in the substance overcome intermolecular forces and move at high speeds. Temperature remains constant.  The particles in the substance gain energy and slide past one another, forming new bonds. Temperature remains constant. Temperature / o C Time /min Y Liquid  Gas
Which of the following correctly describes what happens to the substance at points  2 to 3  and   5 to 6 ?  Review Exercise (Heating & Cooling Curves) From 2 – 3, the substance changes from liquid to gas. From 5 - 6, the whole substance has been converted to gas. From 2 – 3, the substance melts, bonds are broken and solid changes to liquid. From 5 – 6, the substance boils, bonds are broken and liquid changes to gas. From 2 – 3, the substance melts, bonds are broken and solid changes to liquid. From 5 – 6, the substance completes boiling and everything has been converted to gas. From 2 – 3, freezing takes place and the substance changes from liquid to solid. From 5 – 6, the substance completes boiling and everything has been converted to gas. Temperature / o C Time /min 1 2 3 4 5 6

11 particulate model (changes in state & temp curves)

  • 1.
    PARTICULATE MODEL OF MATTER Interactive Science Volume A Chapter 11
  • 2.
    Part (e) Heating& Cooling Curves
  • 3.
    HEATING CURVE Theheating curve, as the name implies, plots out the entire graph of the changes in the states of matter as temperature increases over time. Such a plot helps us identify fixed temperature points like the melting and boiling points of the substance. This also allows us to identify which state the substance would be in at a given temperature or a given time. Part (e) Learning to interpret a heating/cooling curve will help you identify a certain state the substance will be in easily and quickly for a given temperature or given time. 52                                         Temperature / o C Time /min Boiling point Melting point Solid state Solid & Liquid state Liquid state Liquid & gaseous state Gaseous state
  • 4.
    Temperature / o C Time / min 0 100 Solid State Melting: Solid & Liquid States Melting begins Melting ends Liquid state Boiling: Liquid & Gas States Boiling begins Boiling ends Gas Consider the heating curve for pure water: Part (e) 53                                                                                  
  • 5.
    HEATING CURVE Temperature/ o C Time /min Boiling point Melting point Solid state Liquid state Gaseous state Part (e) Constant temperature Breaking of inter-molecular bonds Energy Absorbed Phase Change 54                                        
  • 6.
    COOLING CURVE Thecooling curve, on the other hand, plots out the entire graph of the changes in the states of matter as temperature decreases over time. Once we understand how a heating curve works, interpreting such a curve is like working backwards. Part (e) The heating curve displays the temperature behaviour of a substance when it is gaining energy, while the cooling curve displays what happens to the state when the substance loses energy. 55                                         Temperature / o C Time /min Condensation point Freezing point Solid state Solid & Liquid state Liquid state Liquid & gaseous state Gaseous state
  • 7.
    Temperature / o C Time / min 0 100 Solid Melting: Solid & Liquid States Freezing begins Freezing ends Liquid Condensing: Liquid & Gas States Condensation begins Condensation ends Gas Consider the cooling curve for pure water: Part (e) 56                                                                                  
  • 8.
    COOLING CURVE Part(e) Temperature / o C Time /min Condensation point Freezing point Solid state Liquid state Gaseous state Constant temperature Formation of inter-molecular bonds Energy Released Phase Change 57                                        
  • 9.
  • 10.
    The picture belowshows the cooling curve for alcohol. At which temperature is alcohol likely to boil? A) Above 78 o C B) At 78 o C C) At - 15 o C D) Below - 15 o C Review Exercise (Heating & Cooling Curves) Temperature / o C Time /min 78 - 15 Solid Liquid Gas
  • 11.
    The diagram showspart of the heating curve for substance U . What is the point X known to be? A) Melting point B) Boiling point C) Room temperature D) Temperature axis Review Exercise (Heating & Cooling Curves) Temperature / o C Time /min X Solid Liquid
  • 12.
    The diagram showspart of the heating curve for Iron. What is the state of Iron at point B ? A) Liquid B) Solid C) Liquid & Solid D) Gas & Liquid Review Exercise (Heating & Cooling Curves) Temperature / o C Time /min Melting point A B C
  • 13.
    Which of thefollowing correctly describes the states of the substance at points 1 to 2 and 4 to 5 ? Review Exercise (Heating & Cooling Curves) Temperature / o C Time /min 1 2 3 4 5 6 From 1 – 2, the substance changes from gas to liquid. From 4 - 5, the substance freezes to become solid. From 1 – 2, the substance is at gaseous state. From 4 - 5, the substance is at liquid state. From 1 – 2, the substance starts changing into liquid. From 4 - 5, the substance remains at liquid state. From 1 – 2, the substance is at gaseous state . From 4 - 5, the substance freezes to become solid.
  • 14.
    Which of thefollowing correctly describes what takes place at temperature Y ? Review Exercise (Heating & Cooling Curves) The particles in the substance lose energy, but moves more vigorously within a fixed, regular arrangement. The particles in the substance overcome intermolecular forces and move at high speeds. Temperature continues to increase. The particles in the substance overcome intermolecular forces and move at high speeds. Temperature remains constant. The particles in the substance gain energy and slide past one another, forming new bonds. Temperature remains constant. Temperature / o C Time /min Y Liquid Gas
  • 15.
    Which of thefollowing correctly describes what happens to the substance at points 2 to 3 and 5 to 6 ? Review Exercise (Heating & Cooling Curves) From 2 – 3, the substance changes from liquid to gas. From 5 - 6, the whole substance has been converted to gas. From 2 – 3, the substance melts, bonds are broken and solid changes to liquid. From 5 – 6, the substance boils, bonds are broken and liquid changes to gas. From 2 – 3, the substance melts, bonds are broken and solid changes to liquid. From 5 – 6, the substance completes boiling and everything has been converted to gas. From 2 – 3, freezing takes place and the substance changes from liquid to solid. From 5 – 6, the substance completes boiling and everything has been converted to gas. Temperature / o C Time /min 1 2 3 4 5 6