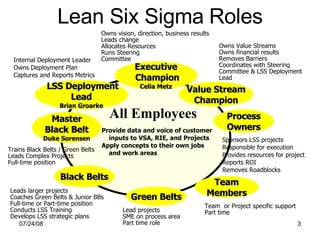
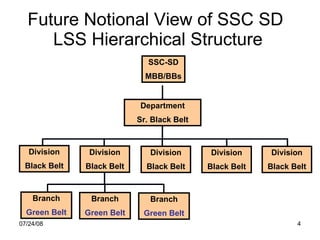
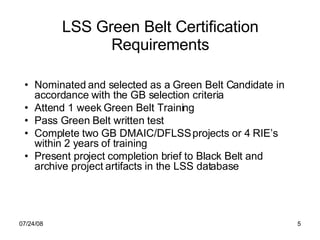
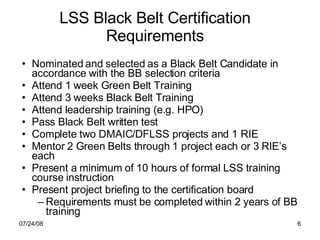
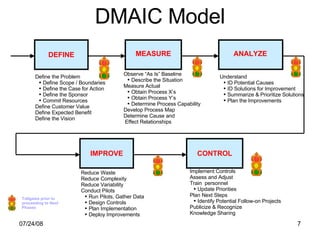
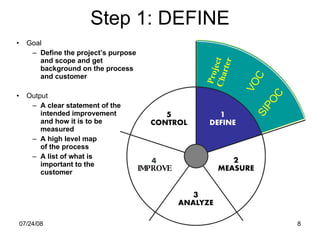
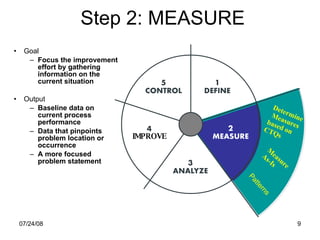
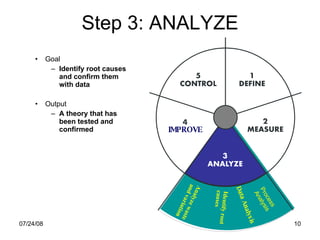
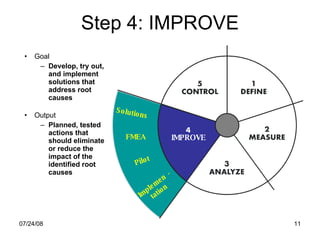
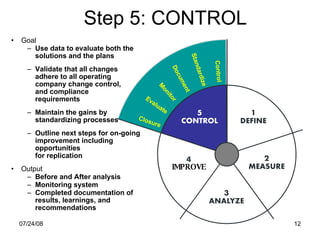
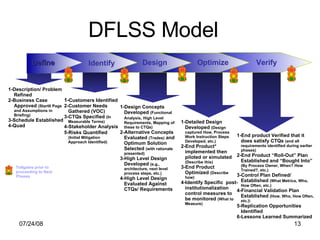
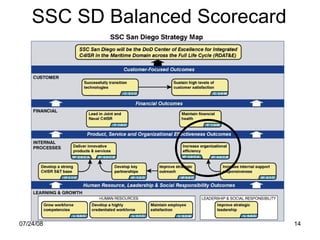
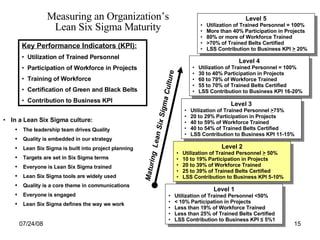
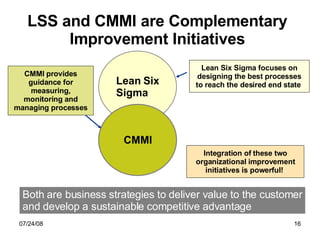
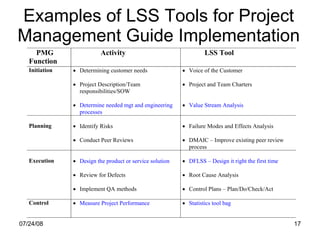
Lean Six Sigma Helpful Handouts
Lean Thinking Philosophy Current State Future State Solve Problems Expose Problems Identify and eliminate all activities that are waste (Muda).  Focuses on optimal flow throughout the process.  Customer focused. “ True North ” Value Added Time = Lead Time Full of Waste, Variation, and Constraints
Lean Six Sigma   Roles Provide data and voice of customer  inputs to VSA, RIE, and Projects Apply concepts to their own jobs  and work areas Owns vision, direction, business results Leads change Allocates Resources Runs Steering  Committee Owns Value Streams Owns financial results Removes Barriers Coordinates with Steering Committee & LSS Deployment Lead Leads larger projects  Coaches Green Belts & Junior BBs Full-time or Part-time position Conducts LSS Training Develops LSS strategic plans Lead projects SME on process area Part time role Team  or Project specific support Part time Internal Deployment Leader Owns Deployment Plan Captures and Reports Metrics LSS Deployment Lead Brian Groarke Value Stream Champion Team Members Executive Champion Celia Metz Green Belts Master Black Belt Duke Sorensen Process Owners Sponsors LSS projects Responsible for execution Provides resources for project Reports ROI Removes Roadblocks All Employees Trains Black Belts / Green Belts Leads Complex Projects  Full-time position Black Belts
Future Notional View of SSC SD  LSS Hierarchical Structure SSC-SD MBB/BBs Division Black Belt Division Black Belt Division Black Belt Division Black Belt Division Black Belt Department Sr. Black Belt Branch Green Belt Branch Green Belt Branch Green Belt
LSS Green Belt Certification Requirements Nominated and selected as a Green Belt Candidate in accordance with the GB selection criteria Attend 1 week Green Belt Training Pass Green Belt written test Complete two GB DMAIC/DFLSS projects or 4 RIE’s within 2 years of training Present project completion brief to Black Belt and archive project artifacts in the LSS database
LSS Black Belt Certification Requirements Nominated and selected as a Black Belt Candidate in accordance with the BB selection criteria Attend 1 week Green Belt Training Attend 3 weeks Black Belt Training Attend leadership training (e.g. HPO) Pass Black Belt written test Complete two DMAIC/DFLSS projects and 1 RIE  Mentor 2 Green Belts through 1 project each or 3 RIE’s each Present a minimum of 10 hours of formal LSS training course instruction Present project briefing to the certification board Requirements must be completed within 2 years of BB training
DMAIC Model DEFINE IMPROVE CONTROL Define the Problem Define Scope / Boundaries Define the Case for Action Define the Sponsor Commit Resources Define Customer Value Define Expected Benefit Define the Vision Observe “As Is” Baseline Describe the Situation Measure Actual Obtain Process X’s Obtain Process Y’s Determine Process Capability Develop Process Map Determine Cause and Effect Relationships Understand ID Potential Causes ID Solutions for Improvement Summarize & Prioritize Solutions Plan the Improvements Reduce Waste Reduce Complexity Reduce Variability Conduct Pilots Run Pilots, Gather Data Design Controls Plan Implementation Deploy Improvements Implement Controls Assess and Adjust Train  personnel Update Priorities Plan Next Steps Identify Potential Follow-on Projects Publicize & Recognize Knowledge Sharing Tollgates prior to proceeding to Next Phases MEASURE ANALYZE
Step 1: DEFINE Goal Define the project’s purpose and scope and get background on the process and customer Output A clear statement of the intended improvement  and how it is to be  measured A high level map  of the process A list of what is important to the customer IMPROVE Project  Charter VOC SIPOC
Step 2: MEASURE Goal Focus the improvement effort by gathering information on the current situation Output Baseline data on current process performance Data that pinpoints problem location or occurrence A more focused problem statement IMPROVE Determine Measures based on  CTQs Measure  As-Is Patterns
Step 3: ANALYZE Goal Identify root causes and confirm them with data Output A theory that has been tested and confirmed Data Analysis IMPROVE Analyze waste and   variation Identify root causes Process  Analysis
Step 4: IMPROVE Goal Develop, try out,  and implement solutions that  address root  causes Output Planned, tested  actions that should eliminate or reduce the impact of the identified root causes Solutions FMEA Pilot Implemen - tation IMPROVE
Step 5: CONTROL Goal Use data to evaluate both the  solutions and the plans Validate that all changes  adhere to all operating  company change control,  and compliance  requirements  Maintain the gains by  standardizing processes Outline next steps for on-going improvement including opportunities  for replication Output Before and After analysis Monitoring system Completed documentation of results, learnings, and recommendations Control Standardize Document Monitor Evaluate Closure IMPROVE
Design Identify Optimize Verify Define 1-Description/ Problem Refined 2-Business Case Approved  (StartIt Page and Assumptions in Briefing) 3-Schedule Established 4-Quad 1- Customers Identified 2-Customer Needs Gathered (VOC) 3-CTQs Specified  (In Measurable Terms) 4-Stakeholder Analysis 5-Risks Quantified   (Initial Mitigation Approach Identified) 1-Design Concepts Developed  (Functional Analysis,   High Level Requirements, Mapping of these to CTQs) 2-Alternative Concepts Evaluated  (Trades)  and Optimum Solution Selected  (with rationale presented)  3-High Level Design Developed  (e.g., architecture, next level process steps, etc.) 4-High Level Design Evaluated Against CTQs/ Requirements 1-Detailed Design Developed  (Design captured How, Process Work Instruction Steps Developed, etc.) 2-End Product* implemented then piloted or simulated  (Describe this) 3-End Product Optimized  (Describe how) 4-Identify Specific  post-institutionalization control measures to be monitored  (What to Measure) 1-End product Verified that it does satisfy CTQs  (and all requirements identified during earlier phases) 2-End Product “Roll-Out” Plan Established and “Bought Into”  (By Process Owner, When? How Trained?, etc.) 3-Control Plan Defined/ Established  (What Metrics, Who, How Often, etc.) 4-Financial Validation Plan Established  (How, Who, How Often, etc.)\ 5-Replication Opportunities Identified 6-Lessons Learned Summarized DFLSS Model Tollgates prior to proceeding to Next Phases
SSC SD Balanced Scorecard
Measuring an Organization’s Lean Six Sigma Maturity In a Lean Six Sigma culture: The leadership team drives Quality Quality is embedded in our strategy Lean Six Sigma is built into project planning Targets are set in Six Sigma terms Everyone is Lean Six Sigma trained Lean Six Sigma tools are widely used Quality is a core theme in communications Everyone is engaged Lean Six Sigma defines the way we work Maturing  Lean Six Sigma Culture Key Performance Indicators (KPI): Utilization of Trained Personnel Participation of Workforce in Projects Training of Workforce Certification of Green and Black Belts Contribution to Business KPI Level 5 Utilization of Trained Personnel = 100% More than 40% Participation in Projects 80% or more of Workforce Trained >70% of Trained Belts Certified LSS Contribution to Business KPI  >  20% Level 4 Utilization of Trained Personnel = 100% 30 to 40% Participation in Projects 60 to 79% of Workforce Trained 55 to 70% of Trained Belts Certified LSS Contribution to Business KPI 16-20% Level 3 Utilization of Trained Personnel  > 75% 20 to 29% Participation in Projects 40 to 59% of Workforce Trained 40 to 54% of Trained Belts Certified LSS Contribution to Business KPI 11-15% Level 2 Utilization of Trained Personnel  >  50% 10 to 19% Participation in Projects 20 to 39% of Workforce Trained 25 to 39% of Trained Belts Certified LSS Contribution to Business KPI 5-10% Level 1 Utilization of Trained Personnel <50% < 10%   Participation in Projects Less than 19% of Workforce Trained Less than 25% of Trained Belts Certified LSS Contribution to Business KPI ≤ 5%1
LSS and CMMI are Complementary Improvement Initiatives Lean Six Sigma CMMI Lean Six Sigma focuses on designing the best processes to reach the desired end state  Integration of these two organizational improvement initiatives is powerful!  CMMI provides guidance for measuring, monitoring and managing processes Both are business strategies to deliver value to the customer and develop a sustainable competitive advantage
Examples of LSS Tools for Project Management Guide Implementation

Lean Six Sigma Awareness Handouts

  • 1.
    Lean Six SigmaHelpful Handouts
  • 2.
    Lean Thinking PhilosophyCurrent State Future State Solve Problems Expose Problems Identify and eliminate all activities that are waste (Muda). Focuses on optimal flow throughout the process. Customer focused. “ True North ” Value Added Time = Lead Time Full of Waste, Variation, and Constraints
  • 3.
    Lean Six Sigma Roles Provide data and voice of customer inputs to VSA, RIE, and Projects Apply concepts to their own jobs and work areas Owns vision, direction, business results Leads change Allocates Resources Runs Steering Committee Owns Value Streams Owns financial results Removes Barriers Coordinates with Steering Committee & LSS Deployment Lead Leads larger projects Coaches Green Belts & Junior BBs Full-time or Part-time position Conducts LSS Training Develops LSS strategic plans Lead projects SME on process area Part time role Team or Project specific support Part time Internal Deployment Leader Owns Deployment Plan Captures and Reports Metrics LSS Deployment Lead Brian Groarke Value Stream Champion Team Members Executive Champion Celia Metz Green Belts Master Black Belt Duke Sorensen Process Owners Sponsors LSS projects Responsible for execution Provides resources for project Reports ROI Removes Roadblocks All Employees Trains Black Belts / Green Belts Leads Complex Projects Full-time position Black Belts
  • 4.
    Future Notional Viewof SSC SD LSS Hierarchical Structure SSC-SD MBB/BBs Division Black Belt Division Black Belt Division Black Belt Division Black Belt Division Black Belt Department Sr. Black Belt Branch Green Belt Branch Green Belt Branch Green Belt
  • 5.
    LSS Green BeltCertification Requirements Nominated and selected as a Green Belt Candidate in accordance with the GB selection criteria Attend 1 week Green Belt Training Pass Green Belt written test Complete two GB DMAIC/DFLSS projects or 4 RIE’s within 2 years of training Present project completion brief to Black Belt and archive project artifacts in the LSS database
  • 6.
    LSS Black BeltCertification Requirements Nominated and selected as a Black Belt Candidate in accordance with the BB selection criteria Attend 1 week Green Belt Training Attend 3 weeks Black Belt Training Attend leadership training (e.g. HPO) Pass Black Belt written test Complete two DMAIC/DFLSS projects and 1 RIE Mentor 2 Green Belts through 1 project each or 3 RIE’s each Present a minimum of 10 hours of formal LSS training course instruction Present project briefing to the certification board Requirements must be completed within 2 years of BB training
  • 7.
    DMAIC Model DEFINEIMPROVE CONTROL Define the Problem Define Scope / Boundaries Define the Case for Action Define the Sponsor Commit Resources Define Customer Value Define Expected Benefit Define the Vision Observe “As Is” Baseline Describe the Situation Measure Actual Obtain Process X’s Obtain Process Y’s Determine Process Capability Develop Process Map Determine Cause and Effect Relationships Understand ID Potential Causes ID Solutions for Improvement Summarize & Prioritize Solutions Plan the Improvements Reduce Waste Reduce Complexity Reduce Variability Conduct Pilots Run Pilots, Gather Data Design Controls Plan Implementation Deploy Improvements Implement Controls Assess and Adjust Train personnel Update Priorities Plan Next Steps Identify Potential Follow-on Projects Publicize & Recognize Knowledge Sharing Tollgates prior to proceeding to Next Phases MEASURE ANALYZE
  • 8.
    Step 1: DEFINEGoal Define the project’s purpose and scope and get background on the process and customer Output A clear statement of the intended improvement and how it is to be measured A high level map of the process A list of what is important to the customer IMPROVE Project Charter VOC SIPOC
  • 9.
    Step 2: MEASUREGoal Focus the improvement effort by gathering information on the current situation Output Baseline data on current process performance Data that pinpoints problem location or occurrence A more focused problem statement IMPROVE Determine Measures based on CTQs Measure As-Is Patterns
  • 10.
    Step 3: ANALYZEGoal Identify root causes and confirm them with data Output A theory that has been tested and confirmed Data Analysis IMPROVE Analyze waste and variation Identify root causes Process Analysis
  • 11.
    Step 4: IMPROVEGoal Develop, try out, and implement solutions that address root causes Output Planned, tested actions that should eliminate or reduce the impact of the identified root causes Solutions FMEA Pilot Implemen - tation IMPROVE
  • 12.
    Step 5: CONTROLGoal Use data to evaluate both the solutions and the plans Validate that all changes adhere to all operating company change control, and compliance requirements Maintain the gains by standardizing processes Outline next steps for on-going improvement including opportunities for replication Output Before and After analysis Monitoring system Completed documentation of results, learnings, and recommendations Control Standardize Document Monitor Evaluate Closure IMPROVE
  • 13.
    Design Identify OptimizeVerify Define 1-Description/ Problem Refined 2-Business Case Approved (StartIt Page and Assumptions in Briefing) 3-Schedule Established 4-Quad 1- Customers Identified 2-Customer Needs Gathered (VOC) 3-CTQs Specified (In Measurable Terms) 4-Stakeholder Analysis 5-Risks Quantified (Initial Mitigation Approach Identified) 1-Design Concepts Developed (Functional Analysis, High Level Requirements, Mapping of these to CTQs) 2-Alternative Concepts Evaluated (Trades) and Optimum Solution Selected (with rationale presented) 3-High Level Design Developed (e.g., architecture, next level process steps, etc.) 4-High Level Design Evaluated Against CTQs/ Requirements 1-Detailed Design Developed (Design captured How, Process Work Instruction Steps Developed, etc.) 2-End Product* implemented then piloted or simulated (Describe this) 3-End Product Optimized (Describe how) 4-Identify Specific post-institutionalization control measures to be monitored (What to Measure) 1-End product Verified that it does satisfy CTQs (and all requirements identified during earlier phases) 2-End Product “Roll-Out” Plan Established and “Bought Into” (By Process Owner, When? How Trained?, etc.) 3-Control Plan Defined/ Established (What Metrics, Who, How Often, etc.) 4-Financial Validation Plan Established (How, Who, How Often, etc.)\ 5-Replication Opportunities Identified 6-Lessons Learned Summarized DFLSS Model Tollgates prior to proceeding to Next Phases
  • 14.
    SSC SD BalancedScorecard
  • 15.
    Measuring an Organization’sLean Six Sigma Maturity In a Lean Six Sigma culture: The leadership team drives Quality Quality is embedded in our strategy Lean Six Sigma is built into project planning Targets are set in Six Sigma terms Everyone is Lean Six Sigma trained Lean Six Sigma tools are widely used Quality is a core theme in communications Everyone is engaged Lean Six Sigma defines the way we work Maturing Lean Six Sigma Culture Key Performance Indicators (KPI): Utilization of Trained Personnel Participation of Workforce in Projects Training of Workforce Certification of Green and Black Belts Contribution to Business KPI Level 5 Utilization of Trained Personnel = 100% More than 40% Participation in Projects 80% or more of Workforce Trained >70% of Trained Belts Certified LSS Contribution to Business KPI > 20% Level 4 Utilization of Trained Personnel = 100% 30 to 40% Participation in Projects 60 to 79% of Workforce Trained 55 to 70% of Trained Belts Certified LSS Contribution to Business KPI 16-20% Level 3 Utilization of Trained Personnel > 75% 20 to 29% Participation in Projects 40 to 59% of Workforce Trained 40 to 54% of Trained Belts Certified LSS Contribution to Business KPI 11-15% Level 2 Utilization of Trained Personnel > 50% 10 to 19% Participation in Projects 20 to 39% of Workforce Trained 25 to 39% of Trained Belts Certified LSS Contribution to Business KPI 5-10% Level 1 Utilization of Trained Personnel <50% < 10% Participation in Projects Less than 19% of Workforce Trained Less than 25% of Trained Belts Certified LSS Contribution to Business KPI ≤ 5%1
  • 16.
    LSS and CMMIare Complementary Improvement Initiatives Lean Six Sigma CMMI Lean Six Sigma focuses on designing the best processes to reach the desired end state Integration of these two organizational improvement initiatives is powerful! CMMI provides guidance for measuring, monitoring and managing processes Both are business strategies to deliver value to the customer and develop a sustainable competitive advantage
  • 17.
    Examples of LSSTools for Project Management Guide Implementation