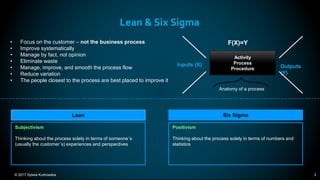
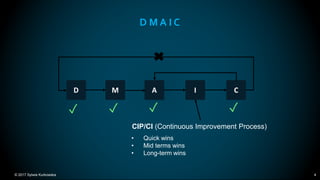
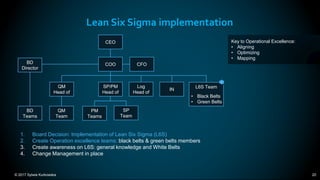
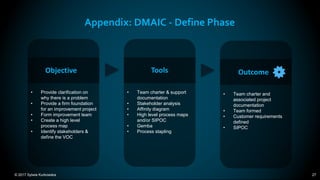
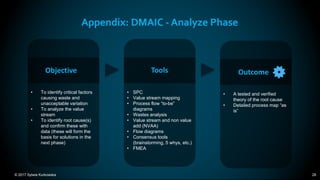
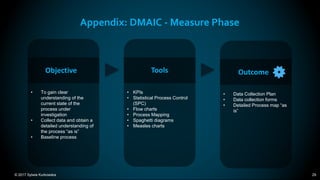
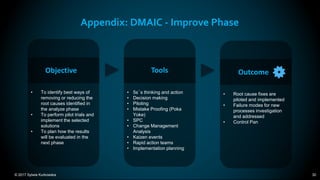
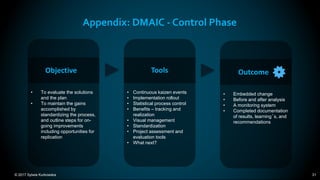
© 2017 Sylwia Kurkowska 1
Lean Six Sigma
Yellow and Green Belt
Berlin, 2017-06-23
Sylwia Kurkowska
Project Manager
© 2017 Sylwia Kurkowska 2
White – Green –Yellow – Black – Master Black
White Belt
Yellow Belt
Green Belt
Black Belt
Master
Black Belt
Least time required
Most time required
Time to achieve
© 2017 Sylwia Kurkowska 3
Lean & Six Sigma
• Focus on the customer – not the business process
• Improve systematically
• Manage by fact, not opinion
• Eliminate waste
• Manage, improve, and smooth the process flow
• Reduce variation
• The people closest to the process are best placed to improve it
Outputs
(Y)
F(X)=Y
Activity
Process
Procedure
Inputs (X)
Anatomy of a process
Subjectivism
Thinking about the process solely in terms of someone´s
(usually the customer´s) experiences and perspectives
Lean
Positivism
Thinking about the process solely in terms of numbers and
statistics
Six Sigma
© 2017 Sylwia Kurkowska 4
D M A I C
• Quick wins
• Mid terms wins
• Long-term wins
CIP/CI (Continuous Improvement Process)
D M A I C
✓ ✓ ✓ ✓
© 2017 Sylwia Kurkowska 5
Imagine
Your company as a manufacturing site…
Procurement
Business
Development
Logistics
Project
Management
Quality
Finance
IT
© 2017 Sylwia Kurkowska 6
Lean stations
RFI / RFQ
creation
1
Sourcing
2
Quotation
3
Negotiation
4
Purchasing
5
Inbound
delivery
6
Outbound
delivery
7
Invoicing
8
© 2017 Sylwia Kurkowska 7
Measure Performance
Takt Time1
Unit Time1
Cycle Time1
Yield Time1
RFI / RFQ
creation
1
Sourcing
2
Quotation
3
Negotiation
4
Waiting time
Overproduction
Motion
Rework
Takt Time2
Unit Time2
Cycle Time2
Yield Time2
© 2017 Sylwia Kurkowska 8
Wormpit
Muda of Lean (The Seven Wastes)
Waiting
Motion
Over-processing
Overproduction
Overinventory
Transportation
Rework
*Skills
Key Lean Concepts:
• Gemba (The Real Place)
• Kaizen (Continuous improvement)
• Jidoka (Policy deployment,
automation)
• Just In Time (JIT)
• Total Productive Maintenance (TPM)
© 2017 Sylwia Kurkowska 9
VOC vsVOB
Customer Value
Add (VOC)
Non Value Add
(walking,
searching, waiting)
Adds value to the
customer?
Contributes to the
business
effectiveness?
Business Value
Add (VOB)
Yes No
Yes
No
VOC
requirements
Critical
to Quality (CTQ)
VOB
requirements
<
<
© 2017 Sylwia Kurkowska 10
Identifying requirements
Reliable delivery
Parts delivered next
week
70% of deliveries
occur by 3 working
days
% of deliveries within
time limit
VOC CTQ KPI
Statistics to
collect
Typically Define Typically Measure
50% of suppliers from
Easter Europe
provide CoA
Documentation
available
CoA needed
% of enquires
accepted
© 2017 Sylwia Kurkowska 11
Lean
Cycle time7 days5,5 days 8 days
Lean
(large variation)
USL (Upper Specification Limit)
Lean
© 2017 Sylwia Kurkowska 12
Six Sigma
σσ
2σ2σ
Six Sigma
(small variation)
Cycle time7 days 8 days
Lean
(large variation)
USL (Upper Specification Limit)
© 2017 Sylwia Kurkowska 13
Lean Six Sigma
σσ
2σ2σ
Six Sigma
(small variation)
Lean Six Sigma
Cycle time7 days5,5 days 8 days
Lean
(large variation)
USL (Upper Specification Limit)
© 2017 Sylwia Kurkowska 14
Project Charter
Stuff and
milestones
(Champion decides on
budgets
Stakeholders, time allocated
XX% on project, milestones,
SMART goals (i.e. reduce
waste by 25% by 2017)
Business
relevance
(Why is it necessary to look at
it?)
Project
description
(things in scope and out of
scope, i.e. we are focusing on
blue cars, not red ones)
Problem
description
(i.e. we lost XX $M)
P
i.e. Reduce waste by
25% until end of the
year 2017
Smart goal
© 2017 Sylwia Kurkowska 15
SIPOC
Supplier
Warehouse
Dep 2
Dep 3
Dep 1
Sweets Order received
Action 2
Action 3
Action 3
Packed order
Distribution
Company A
Providers of inputs for your
process
Input(s)
Materials, resources or data
required to do the process
Process
Activities that transform
inputs into workable outputs
Output
The products or service
from the process
Customer
The recipient of the process
output
Used to identify high level “as is” processes - an effective communication tool
© 2017 Sylwia Kurkowska 16
PokaYoke: Diesel vs Gas example
Diesel Gas
Diesel
Gas
✓
✓
Engine broken!
Engine still ok, but fuel is wasted
Fuel
Car
It helps you to eliminate errors before they occur rather than finding and fixing them
-
X
© 2017 Sylwia Kurkowska 17
Upper and Lower Specification Limits
Special events, to be excluded from analysis
Overproduction
σ
-σ
-2σ
2σ
-3σ=LCL
USL
LSL
Cpk
3σ=UCL
Specification levels come from the customer
Good process must meet customer expectations
Process is statistically under
control if control levels are
approved.
Statistical Process Control (SPC) – Control Chart
© 2017 Sylwia Kurkowska 18
Pareto Principle
5%
30%
3% 2%
6%
50%
1% 2% 0,5% 0,5%
Normal
Traffic
Get up
late
Kid is
sick
Road
blocked
Doctor
visit
S-Bahn
U-Bahn
Delayed
Car is
broken
Bad
weather
conditions
Car
accident
Lost key
© 2017 Sylwia Kurkowska 19
Pareto Principle
Why people are late at work?
50%
5%
1%3%
6%
30%
2%2% 0,5%0,5%
Normal
Traffic
Get up
late
Kid is
sick
Road
blocked
Doctor
visit
S-Bahn
U-Bahn
Delayed
Car is
broken
Bad
weather
conditions
Car
accident
Lost key
80%
© 2017 Sylwia Kurkowska 20
Lean Six Sigma implementation
CEO
BD
Director
QM
Head of
SP/PM
Head of
QM
Team
COO CFO
Log
Head of
BD
Teams
IN
PM
Teams
SP
Team
1. Board Decision: Implementation of Lean Six Sigma (L6S)
2. Create Operation excellence teams: black belts & green belts members
3. Create awareness on L6S: general knowledge and White Belts
4. Change Management in place
Key to Operational Excellence:
• Aligning
• Optimizing
• Mapping
L6S Team
• Black Belts
• Green Belts
© 2017 Sylwia Kurkowska 21
The Workplace
20 30
16
26
7
31
24
11
13
17
29
19
1
5
14
23
15
8
34
2
18
4
22 27
2832
35
36
37
38
39
40
85
92
103
98
993
88
80 66
© 2017 Sylwia Kurkowska 22
The SORTED workplace
20 30
16
26
7
24
11
13
17
29
19
1
5
14
23
15
8
2
18
4
22 27
28
6
© 2017 Sylwia Kurkowska 23
The ORDERED workplace
20 3016
26
7
24
11
13
17
29
19
1
5
14
23
15
8
2
18
4
22 27
28
6
© 2017 Sylwia Kurkowska 24
The workplace STANDARD
20
30
16
26
7 10
24
25
11
21
3
12
13 17
9
29
19
1 5
14
23
15
8
2
18
4
22
27 28
6
Numbers from 1 to 30
© 2017 Sylwia Kurkowska 25
The workplace STANDARD simplify
20
30
16
26
7 10
24
25
11
21
3
12
13 17
9
29
19
1 5
14
23
15
8
2
18
4
22
27 28
6
© 2017 Sylwia Kurkowska 26
Thank You
© 2017 Sylwia Kurkowska 27
Appendix: DMAIC - Define Phase
• Team charter & support
documentation
• Stakeholder analysis
• Affinity diagram
• High level process maps
and/or SIPOC
• Gemba
• Process stapling
Tools
• Provide clarification on
why there is a problem
• Provide a firm foundation
for an improvement project
• Form improvement team
• Create a high level
process map
• Identify stakeholders &
define the VOC
Objective
• Team charter and
associated project
documentation
• Team formed
• Customer requirements
defined
• SIPOC
Outcome
© 2017 Sylwia Kurkowska 28
Appendix: DMAIC - Analyze Phase
• SPC
• Value stream mapping
• Process flow “to-be”
diagrams
• Wastes analysis
• Value stream and non value
add (NVAA)
• Flow diagrams
• Consensus tools
(brainstorming, 5 whys, etc.)
• FMEA
Tools
• To identify critical factors
causing waste and
unacceptable variation
• To analyze the value
stream
• To identify root cause(s)
and confirm these with
data (these will form the
basis for solutions in the
next phase)
Objective
• A tested and verified
theory of the root cause
• Detailed process map “as
is”
Outcome
© 2017 Sylwia Kurkowska 29
Appendix: DMAIC - Measure Phase
• KPIs
• Statistical Process Control
(SPC)
• Flow charts
• Process Mapping
• Spaghetti diagrams
• Measles charts
Tools
• To gain clear
understanding of the
current state of the
process under
investigation
• Collect data and obtain a
detailed understanding of
the process “as is”
• Baseline process
Objective
• Data Collection Plan
• Data collection forms
• Detailed Process map “as
is”
Outcome
© 2017 Sylwia Kurkowska 30
Appendix: DMAIC - Improve Phase
• 5s´s thinking and action
• Decision making
• Piloting
• Mistake Proofing (Poka
Yoke)
• SPC
• Change Management
Analysis
• Kaizen events
• Rapid action teams
• Implementation planning
Tools
• To identify best ways of
removing or reducing the
root causes identified in
the analyze phase
• To perform pilot trials and
implement the selected
solutions
• To plan how the results
will be evaluated in the
next phase
Objective
• Root cause fixes are
piloted and implemented
• Failure modes for new
processes investigation
and addressed
• Control Pan
Outcome
© 2017 Sylwia Kurkowska 31
Appendix: DMAIC - Control Phase
• Continuous kaizen events
• Implementation rollout
• Statistical process control
• Benefits – tracking and
realization
• Visual management
• Standardization
• Project assessment and
evaluation tools
• What next?
Tools
• To evaluate the solutions
and the plan
• To maintain the gains
accomplished by
standardizing the process,
and outline steps for on-
going improvements
including opportunities for
replication
Objective
• Embedded change
• Before and after analysis
• A monitoring system
• Completed documentation
of results, learning´s, and
recommendations
Outcome

Lean Six Sigma

  • 1.
    © 2017 SylwiaKurkowska 1 Lean Six Sigma Yellow and Green Belt Berlin, 2017-06-23 Sylwia Kurkowska Project Manager
  • 2.
    © 2017 SylwiaKurkowska 2 White – Green –Yellow – Black – Master Black White Belt Yellow Belt Green Belt Black Belt Master Black Belt Least time required Most time required Time to achieve
  • 3.
    © 2017 SylwiaKurkowska 3 Lean & Six Sigma • Focus on the customer – not the business process • Improve systematically • Manage by fact, not opinion • Eliminate waste • Manage, improve, and smooth the process flow • Reduce variation • The people closest to the process are best placed to improve it Outputs (Y) F(X)=Y Activity Process Procedure Inputs (X) Anatomy of a process Subjectivism Thinking about the process solely in terms of someone´s (usually the customer´s) experiences and perspectives Lean Positivism Thinking about the process solely in terms of numbers and statistics Six Sigma
  • 4.
    © 2017 SylwiaKurkowska 4 D M A I C • Quick wins • Mid terms wins • Long-term wins CIP/CI (Continuous Improvement Process) D M A I C ✓ ✓ ✓ ✓
  • 5.
    © 2017 SylwiaKurkowska 5 Imagine Your company as a manufacturing site… Procurement Business Development Logistics Project Management Quality Finance IT
  • 6.
    © 2017 SylwiaKurkowska 6 Lean stations RFI / RFQ creation 1 Sourcing 2 Quotation 3 Negotiation 4 Purchasing 5 Inbound delivery 6 Outbound delivery 7 Invoicing 8
  • 7.
    © 2017 SylwiaKurkowska 7 Measure Performance Takt Time1 Unit Time1 Cycle Time1 Yield Time1 RFI / RFQ creation 1 Sourcing 2 Quotation 3 Negotiation 4 Waiting time Overproduction Motion Rework Takt Time2 Unit Time2 Cycle Time2 Yield Time2
  • 8.
    © 2017 SylwiaKurkowska 8 Wormpit Muda of Lean (The Seven Wastes) Waiting Motion Over-processing Overproduction Overinventory Transportation Rework *Skills Key Lean Concepts: • Gemba (The Real Place) • Kaizen (Continuous improvement) • Jidoka (Policy deployment, automation) • Just In Time (JIT) • Total Productive Maintenance (TPM)
  • 9.
    © 2017 SylwiaKurkowska 9 VOC vsVOB Customer Value Add (VOC) Non Value Add (walking, searching, waiting) Adds value to the customer? Contributes to the business effectiveness? Business Value Add (VOB) Yes No Yes No VOC requirements Critical to Quality (CTQ) VOB requirements < <
  • 10.
    © 2017 SylwiaKurkowska 10 Identifying requirements Reliable delivery Parts delivered next week 70% of deliveries occur by 3 working days % of deliveries within time limit VOC CTQ KPI Statistics to collect Typically Define Typically Measure 50% of suppliers from Easter Europe provide CoA Documentation available CoA needed % of enquires accepted
  • 11.
    © 2017 SylwiaKurkowska 11 Lean Cycle time7 days5,5 days 8 days Lean (large variation) USL (Upper Specification Limit) Lean
  • 12.
    © 2017 SylwiaKurkowska 12 Six Sigma σσ 2σ2σ Six Sigma (small variation) Cycle time7 days 8 days Lean (large variation) USL (Upper Specification Limit)
  • 13.
    © 2017 SylwiaKurkowska 13 Lean Six Sigma σσ 2σ2σ Six Sigma (small variation) Lean Six Sigma Cycle time7 days5,5 days 8 days Lean (large variation) USL (Upper Specification Limit)
  • 14.
    © 2017 SylwiaKurkowska 14 Project Charter Stuff and milestones (Champion decides on budgets Stakeholders, time allocated XX% on project, milestones, SMART goals (i.e. reduce waste by 25% by 2017) Business relevance (Why is it necessary to look at it?) Project description (things in scope and out of scope, i.e. we are focusing on blue cars, not red ones) Problem description (i.e. we lost XX $M) P i.e. Reduce waste by 25% until end of the year 2017 Smart goal
  • 15.
    © 2017 SylwiaKurkowska 15 SIPOC Supplier Warehouse Dep 2 Dep 3 Dep 1 Sweets Order received Action 2 Action 3 Action 3 Packed order Distribution Company A Providers of inputs for your process Input(s) Materials, resources or data required to do the process Process Activities that transform inputs into workable outputs Output The products or service from the process Customer The recipient of the process output Used to identify high level “as is” processes - an effective communication tool
  • 16.
    © 2017 SylwiaKurkowska 16 PokaYoke: Diesel vs Gas example Diesel Gas Diesel Gas ✓ ✓ Engine broken! Engine still ok, but fuel is wasted Fuel Car It helps you to eliminate errors before they occur rather than finding and fixing them - X
  • 17.
    © 2017 SylwiaKurkowska 17 Upper and Lower Specification Limits Special events, to be excluded from analysis Overproduction σ -σ -2σ 2σ -3σ=LCL USL LSL Cpk 3σ=UCL Specification levels come from the customer Good process must meet customer expectations Process is statistically under control if control levels are approved. Statistical Process Control (SPC) – Control Chart
  • 18.
    © 2017 SylwiaKurkowska 18 Pareto Principle 5% 30% 3% 2% 6% 50% 1% 2% 0,5% 0,5% Normal Traffic Get up late Kid is sick Road blocked Doctor visit S-Bahn U-Bahn Delayed Car is broken Bad weather conditions Car accident Lost key
  • 19.
    © 2017 SylwiaKurkowska 19 Pareto Principle Why people are late at work? 50% 5% 1%3% 6% 30% 2%2% 0,5%0,5% Normal Traffic Get up late Kid is sick Road blocked Doctor visit S-Bahn U-Bahn Delayed Car is broken Bad weather conditions Car accident Lost key 80%
  • 20.
    © 2017 SylwiaKurkowska 20 Lean Six Sigma implementation CEO BD Director QM Head of SP/PM Head of QM Team COO CFO Log Head of BD Teams IN PM Teams SP Team 1. Board Decision: Implementation of Lean Six Sigma (L6S) 2. Create Operation excellence teams: black belts & green belts members 3. Create awareness on L6S: general knowledge and White Belts 4. Change Management in place Key to Operational Excellence: • Aligning • Optimizing • Mapping L6S Team • Black Belts • Green Belts
  • 21.
    © 2017 SylwiaKurkowska 21 The Workplace 20 30 16 26 7 31 24 11 13 17 29 19 1 5 14 23 15 8 34 2 18 4 22 27 2832 35 36 37 38 39 40 85 92 103 98 993 88 80 66
  • 22.
    © 2017 SylwiaKurkowska 22 The SORTED workplace 20 30 16 26 7 24 11 13 17 29 19 1 5 14 23 15 8 2 18 4 22 27 28 6
  • 23.
    © 2017 SylwiaKurkowska 23 The ORDERED workplace 20 3016 26 7 24 11 13 17 29 19 1 5 14 23 15 8 2 18 4 22 27 28 6
  • 24.
    © 2017 SylwiaKurkowska 24 The workplace STANDARD 20 30 16 26 7 10 24 25 11 21 3 12 13 17 9 29 19 1 5 14 23 15 8 2 18 4 22 27 28 6 Numbers from 1 to 30
  • 25.
    © 2017 SylwiaKurkowska 25 The workplace STANDARD simplify 20 30 16 26 7 10 24 25 11 21 3 12 13 17 9 29 19 1 5 14 23 15 8 2 18 4 22 27 28 6
  • 26.
    © 2017 SylwiaKurkowska 26 Thank You
  • 27.
    © 2017 SylwiaKurkowska 27 Appendix: DMAIC - Define Phase • Team charter & support documentation • Stakeholder analysis • Affinity diagram • High level process maps and/or SIPOC • Gemba • Process stapling Tools • Provide clarification on why there is a problem • Provide a firm foundation for an improvement project • Form improvement team • Create a high level process map • Identify stakeholders & define the VOC Objective • Team charter and associated project documentation • Team formed • Customer requirements defined • SIPOC Outcome
  • 28.
    © 2017 SylwiaKurkowska 28 Appendix: DMAIC - Analyze Phase • SPC • Value stream mapping • Process flow “to-be” diagrams • Wastes analysis • Value stream and non value add (NVAA) • Flow diagrams • Consensus tools (brainstorming, 5 whys, etc.) • FMEA Tools • To identify critical factors causing waste and unacceptable variation • To analyze the value stream • To identify root cause(s) and confirm these with data (these will form the basis for solutions in the next phase) Objective • A tested and verified theory of the root cause • Detailed process map “as is” Outcome
  • 29.
    © 2017 SylwiaKurkowska 29 Appendix: DMAIC - Measure Phase • KPIs • Statistical Process Control (SPC) • Flow charts • Process Mapping • Spaghetti diagrams • Measles charts Tools • To gain clear understanding of the current state of the process under investigation • Collect data and obtain a detailed understanding of the process “as is” • Baseline process Objective • Data Collection Plan • Data collection forms • Detailed Process map “as is” Outcome
  • 30.
    © 2017 SylwiaKurkowska 30 Appendix: DMAIC - Improve Phase • 5s´s thinking and action • Decision making • Piloting • Mistake Proofing (Poka Yoke) • SPC • Change Management Analysis • Kaizen events • Rapid action teams • Implementation planning Tools • To identify best ways of removing or reducing the root causes identified in the analyze phase • To perform pilot trials and implement the selected solutions • To plan how the results will be evaluated in the next phase Objective • Root cause fixes are piloted and implemented • Failure modes for new processes investigation and addressed • Control Pan Outcome
  • 31.
    © 2017 SylwiaKurkowska 31 Appendix: DMAIC - Control Phase • Continuous kaizen events • Implementation rollout • Statistical process control • Benefits – tracking and realization • Visual management • Standardization • Project assessment and evaluation tools • What next? Tools • To evaluate the solutions and the plan • To maintain the gains accomplished by standardizing the process, and outline steps for on- going improvements including opportunities for replication Objective • Embedded change • Before and after analysis • A monitoring system • Completed documentation of results, learning´s, and recommendations Outcome

Editor's Notes

  • #8 Takt Time: Maximum time available to complete a task and still meet customer requirement Unit Time (U): Time it takes to create one unit of a product Cycle Time (CT): Time it tales to perform all the work needed to create a product Cycle Time (CT): Total Unit Time + Waiting/Delays Activity Ratio (AR): (Total Unit Time/cycle time) x 100 = Total Time it takes to create one unit of a product / Total Unit Time + Waiting/Delays Yield Time or First Yield Time (FTY): % od product that is right first time (no re-work needed) Rolled Throughput Yield (RTY): Cumulative losses caused by rework/defects from the complete process end-to-end