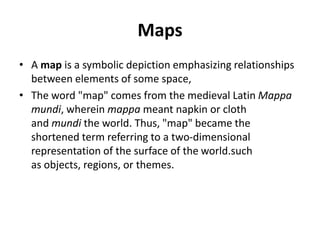
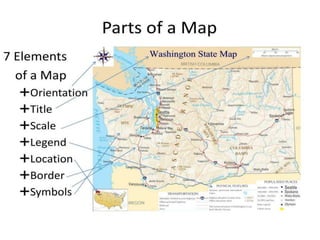
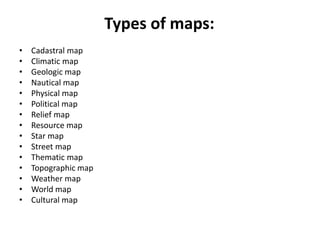
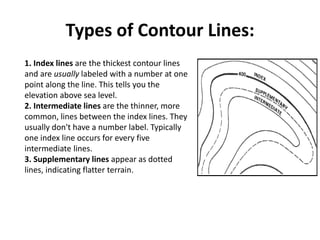
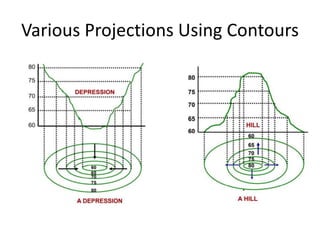
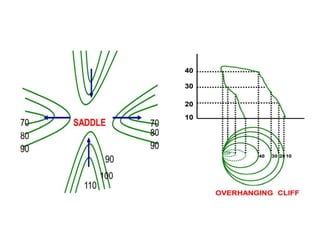
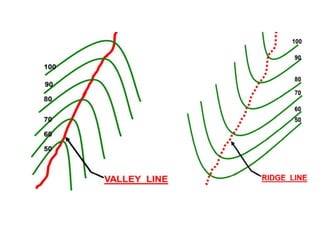
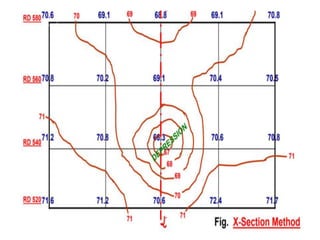
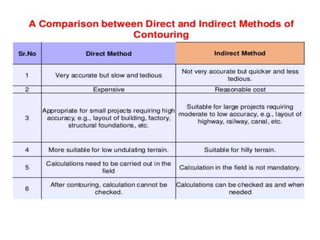
ā€œCONTOUR MAPS: AN INTRODUCTIONā€
Prepared &
Presented By:
Vivek Chauhan
(16091)
Presented To:
Dr. Deepa Rawat
COLLEGE OF FORESTRY
(VCSG UUHF,RANICHAURI)
CFT-397:APPLICATION OF GIS IN FOREST RESOURCE MANAGEMENT
Maps
• A map is a symbolic depiction emphasizing relationships
between elements of some space,
• The word "map" comes from the medieval Latin Mappa
mundi, wherein mappa meant napkin or cloth
and mundi the world. Thus, "map" became the
shortened term referring to a two-dimensional
representation of the surface of the world.such
as objects, regions, or themes.
Types of maps:
• Cadastral map
• Climatic map
• Geologic map
• Nautical map
• Physical map
• Political map
• Relief map
• Resource map
• Star map
• Street map
• Thematic map
• Topographic map
• Weather map
• World map
• Cultural map
Contour Maps:
A contour map is a kind of topographical map that depicts
the elevation of an area using the contour lines.
What is a Topographic Map?
The International Cartographic Association defines Topographic Maps
as the following:
"Topographic maps are maps at large and medium scales which
incorporate a huge variety of information. The basic coverage (a
country’s largest map series) is based on measurements made in the
field and/or from aerial photographs. Derived topographical maps (of
medium and small scales ) are prepared by reduction and
generalisation from the original basic maps.
Things to know about Contour Maps:
• The rule of the Contour V’s Streams and rivers flow
opposite to the point of the V that is formed when a
contour line crosses them.
• Close contour lines means that there is a steep slope.
• Contour lines that are far apart mean that the land is
flatter.
• Gradient means slope.
• Bulls eyes represent hills or mountains.
• Hachured lines on bulls eyes mean depressions or valleys.
• Each line represents a different elevation in feet or meters.
• Places on the same contour line are at the same elevation.
Characteristics of contours:
• The variation of vertical distance between any two
contour lines is assumed to be uniform.
• Contours of different elevations cannot cross each
other (caves and overhanging cliffs are the
exceptions).
• Contour lines cannot begin or end on the plan.
• A contour line must close itself but need not be
necessarily within the limits of the map.
• A closed contour line on a map represents either
depression or hill .
• Contours do not have sharp turnings.
Types of Contour Lines:
1. Index lines are the thickest contour lines
and are usually labeled with a number at one
point along the line. This tells you the
elevation above sea level.
2. Intermediate lines are the thinner, more
common, lines between the index lines. They
usually don't have a number label. Typically
one index line occurs for every five
intermediate lines.
3. Supplementary lines appear as dotted
lines, indicating flatter terrain.
Various Projections Using Contours
METHODS OF CONTOURING:
There are mainly two methods of locating
contours:-
• Direct Method and
• Indirect Method.
Direct method:
• In this method, the contours to be located are directly
traced out in the field by locating and marking a number
of points on each contour. These points are then
surveyed and plotted on plan and the contours drawn
through them.
Direct Method:
(Radial Line Method)
• This method is suitable for small
areas, where a single point in the
centre can command the whole
area.
• Radial lines are laid out from the
common centre by theodolite or
compass and their positions are
fixed up by horizontal angles and
bearings.
Contd.
• Temporary bench marks are first established at the
centre and near the ends of the radial lines .
• The contour points are then located and marked on
these lines and their positions are determined by
measuring their distances along the radial lines.
• They are then plotted on the plan and the contours
drawn by joining all the corresponding points .
Indirect Method:
• In this method the points located and surveyed are not
necessarily on the contour lines but the spot levels are
taken along the series of lines laid out over the area .
• Their positions are then plotted on the plan and the
contours drawn by interpolation.
• This method of contouring is also known as contouring
by spot levels.
• There are three types of indirect method:
Square Method
Cross-section Method
Tacheometric Method
Square Method:
• In this method, the whole area is divided into number of
squares, the side of which may vary from 5m to 30m
depending upon the nature of the ground and the
contour interval. The square need not be of the same size
throughout.
• The important points within the squares may be taken
when required and located by measurements from the
corners. The squares are plotted and the reduced levels
of the corners are written on the plan.
Cross-section Method:
• This method is most suitable for the surveys of long
narrow strips such as a road, railway or canal etc.
• Cross sections are run transverse to the centre line of the
work and representative points are marked along the
lines of cross-section.
• The cross-section lines need not necessarily be at right
angles to the centre line of the work. This may be
inclined at any angle to the centre line if necessary.
• The spacing of the cross-sections depends upon the
topography of the country and the nature of the survey.
Tacheometric Method:
• This method is most suitable in hilly areas as the number
of stations which can be commanded by a techeometer is
far more than those by a level and thus the number of
instrument settings are considerably reduced.
• A number of radial lines are laid out at a known angular
interval and representative points are marked by pegs
along these radial lines.
• Their elevations and distances are then calculated and
plotted on the plan and the contour lines are then
interpolated.
Interpolation of the Contours:
• The process of spacing the contours proportionally
between the plotted ground – points is termed as
interpolation of contours .
• This becomes necessary in the case of indirect
contouring as only the spot levels are taken in this
method.
• While interpolation of contours the ground between any
two points is assumed to be uniformly sloping.
Reference:
• https://theconstructor.org/surveying/contouring-
methods-maps-uses/6451/
• http://www.gitta.info/TopoCart/en/html/NotInt_l
earningObject1.html
• https://www.greenbelly.co/pages/contour-lines
• https://www.slideshare.net/gauravhtandon1/con
touring-26905323
• https://www.slideshare.net/gokulsaud/contourin
g-pdf
• https://en.wikipedia.org/wiki/Map
THANK YOU..!

Contour maps: preparation and understanding.

  • 1.
    ā€œCONTOUR MAPS: ANINTRODUCTIONā€ Prepared & Presented By: Vivek Chauhan (16091) Presented To: Dr. Deepa Rawat COLLEGE OF FORESTRY (VCSG UUHF,RANICHAURI) CFT-397:APPLICATION OF GIS IN FOREST RESOURCE MANAGEMENT
  • 2.
    Maps • A mapis a symbolic depiction emphasizing relationships between elements of some space, • The word "map" comes from the medieval Latin Mappa mundi, wherein mappa meant napkin or cloth and mundi the world. Thus, "map" became the shortened term referring to a two-dimensional representation of the surface of the world.such as objects, regions, or themes.
  • 4.
    Types of maps: •Cadastral map • Climatic map • Geologic map • Nautical map • Physical map • Political map • Relief map • Resource map • Star map • Street map • Thematic map • Topographic map • Weather map • World map • Cultural map
  • 5.
    Contour Maps: A contourmap is a kind of topographical map that depicts the elevation of an area using the contour lines. What is a Topographic Map? The International Cartographic Association defines Topographic Maps as the following: "Topographic maps are maps at large and medium scales which incorporate a huge variety of information. The basic coverage (a country’s largest map series) is based on measurements made in the field and/or from aerial photographs. Derived topographical maps (of medium and small scales ) are prepared by reduction and generalisation from the original basic maps.
  • 6.
    Things to knowabout Contour Maps: • The rule of the Contour V’s Streams and rivers flow opposite to the point of the V that is formed when a contour line crosses them. • Close contour lines means that there is a steep slope. • Contour lines that are far apart mean that the land is flatter. • Gradient means slope. • Bulls eyes represent hills or mountains. • Hachured lines on bulls eyes mean depressions or valleys. • Each line represents a different elevation in feet or meters. • Places on the same contour line are at the same elevation.
  • 7.
    Characteristics of contours: •The variation of vertical distance between any two contour lines is assumed to be uniform. • Contours of different elevations cannot cross each other (caves and overhanging cliffs are the exceptions). • Contour lines cannot begin or end on the plan. • A contour line must close itself but need not be necessarily within the limits of the map. • A closed contour line on a map represents either depression or hill . • Contours do not have sharp turnings.
  • 8.
    Types of ContourLines: 1. Index lines are the thickest contour lines and are usually labeled with a number at one point along the line. This tells you the elevation above sea level. 2. Intermediate lines are the thinner, more common, lines between the index lines. They usually don't have a number label. Typically one index line occurs for every five intermediate lines. 3. Supplementary lines appear as dotted lines, indicating flatter terrain.
  • 9.
  • 12.
    METHODS OF CONTOURING: Thereare mainly two methods of locating contours:- • Direct Method and • Indirect Method.
  • 13.
    Direct method: • Inthis method, the contours to be located are directly traced out in the field by locating and marking a number of points on each contour. These points are then surveyed and plotted on plan and the contours drawn through them.
  • 14.
    Direct Method: (Radial LineMethod) • This method is suitable for small areas, where a single point in the centre can command the whole area. • Radial lines are laid out from the common centre by theodolite or compass and their positions are fixed up by horizontal angles and bearings.
  • 15.
    Contd. • Temporary benchmarks are first established at the centre and near the ends of the radial lines . • The contour points are then located and marked on these lines and their positions are determined by measuring their distances along the radial lines. • They are then plotted on the plan and the contours drawn by joining all the corresponding points .
  • 16.
    Indirect Method: • Inthis method the points located and surveyed are not necessarily on the contour lines but the spot levels are taken along the series of lines laid out over the area . • Their positions are then plotted on the plan and the contours drawn by interpolation. • This method of contouring is also known as contouring by spot levels. • There are three types of indirect method: Square Method Cross-section Method Tacheometric Method
  • 17.
    Square Method: • Inthis method, the whole area is divided into number of squares, the side of which may vary from 5m to 30m depending upon the nature of the ground and the contour interval. The square need not be of the same size throughout. • The important points within the squares may be taken when required and located by measurements from the corners. The squares are plotted and the reduced levels of the corners are written on the plan.
  • 19.
    Cross-section Method: • Thismethod is most suitable for the surveys of long narrow strips such as a road, railway or canal etc. • Cross sections are run transverse to the centre line of the work and representative points are marked along the lines of cross-section. • The cross-section lines need not necessarily be at right angles to the centre line of the work. This may be inclined at any angle to the centre line if necessary. • The spacing of the cross-sections depends upon the topography of the country and the nature of the survey.
  • 21.
    Tacheometric Method: • Thismethod is most suitable in hilly areas as the number of stations which can be commanded by a techeometer is far more than those by a level and thus the number of instrument settings are considerably reduced. • A number of radial lines are laid out at a known angular interval and representative points are marked by pegs along these radial lines. • Their elevations and distances are then calculated and plotted on the plan and the contour lines are then interpolated.
  • 22.
    Interpolation of theContours: • The process of spacing the contours proportionally between the plotted ground – points is termed as interpolation of contours . • This becomes necessary in the case of indirect contouring as only the spot levels are taken in this method. • While interpolation of contours the ground between any two points is assumed to be uniformly sloping.
  • 24.
    Reference: • https://theconstructor.org/surveying/contouring- methods-maps-uses/6451/ • http://www.gitta.info/TopoCart/en/html/NotInt_l earningObject1.html •https://www.greenbelly.co/pages/contour-lines • https://www.slideshare.net/gauravhtandon1/con touring-26905323 • https://www.slideshare.net/gokulsaud/contourin g-pdf • https://en.wikipedia.org/wiki/Map
  • 25.