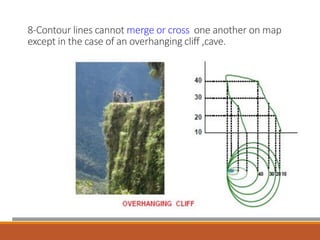
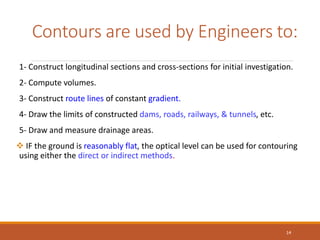
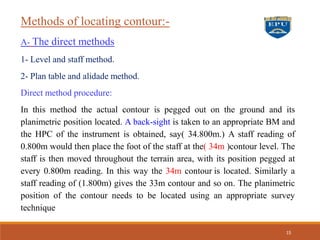
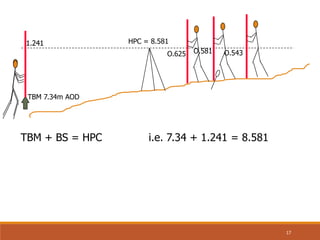
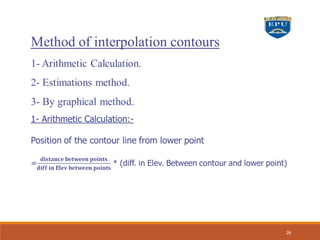
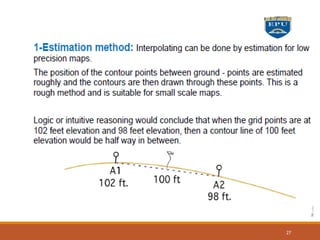
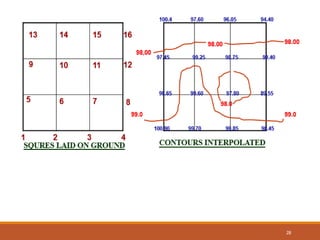
Download as PDF, PPTX

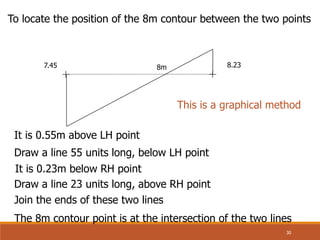
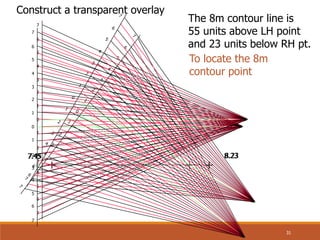
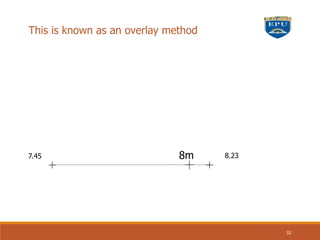
![7.45 8.23
8m
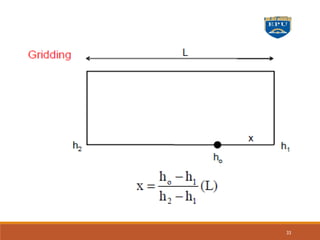
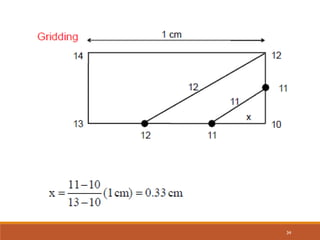
R.L.(C)
R.L.(L) R.L.(H)
[ R.L.(C)
- R.L.(L) ]
[ R.L.(H)
- R.L.(L) ]
[ R.L.(H) - R.L.(C) ]
L
x
From large triangle :
[ R.L.(H) - R.L.(L) ]
L
From small triangle :
[ R.L.(H) - R.L.(C) ]
x
=
Hence : [ R.L.(H) - R.L.(C) ]
x =
[ R.L.(H) - R.L.(L) ]
L . This is a
calculation
method 29](https://image.slidesharecdn.com/contourcontouring-220911080156-744a766b/85/Contour-Contouring-Surveying-29-320.jpg)
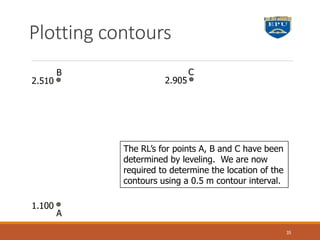
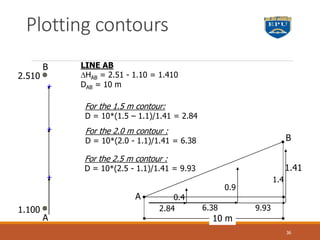
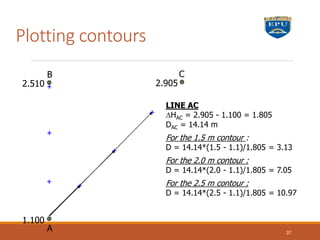
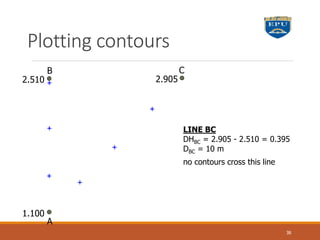
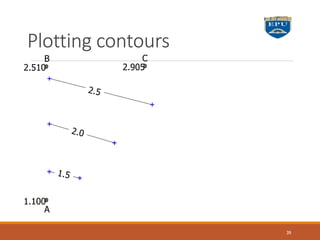

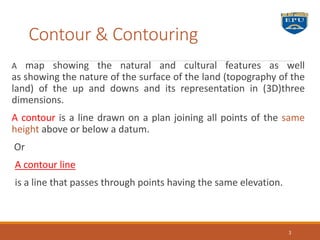
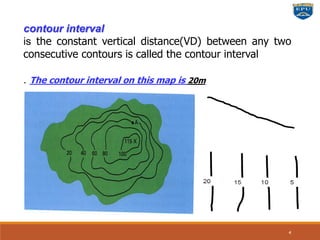
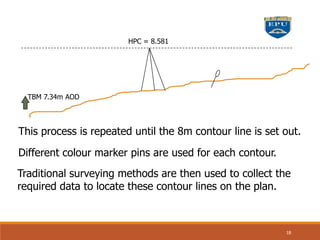
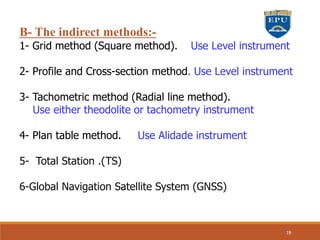
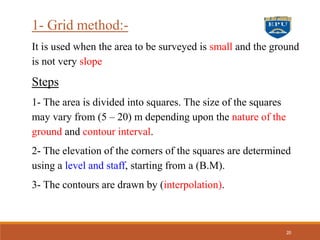
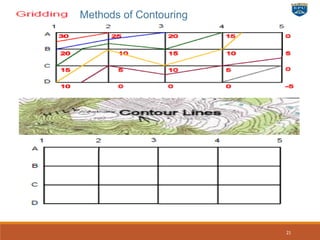
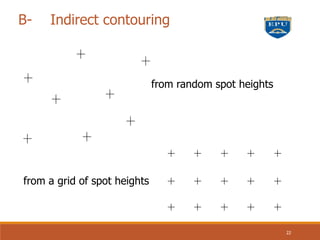
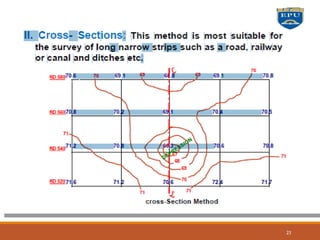
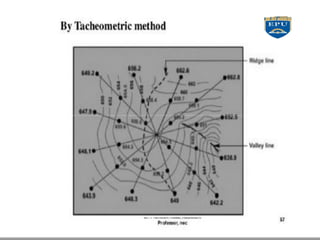
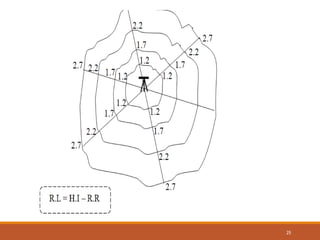
The document discusses contour lines in surveying, defining them as lines connecting points of equal elevation on a map. It details methods for locating contours both directly and indirectly and outlines the characteristics and uses of contour lines in engineering. Key concepts such as contour intervals, the steepness of slopes, and techniques for plotting contours are explained.


