Downloaded 35 times
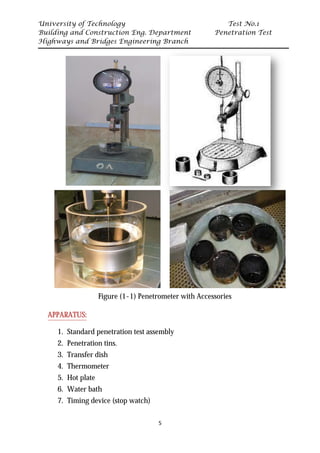
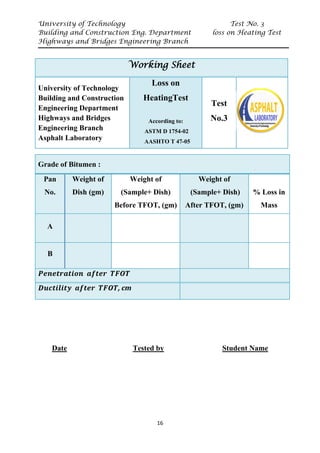
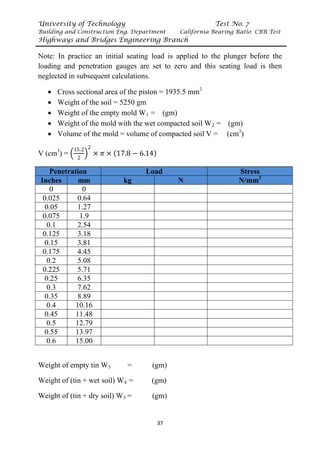
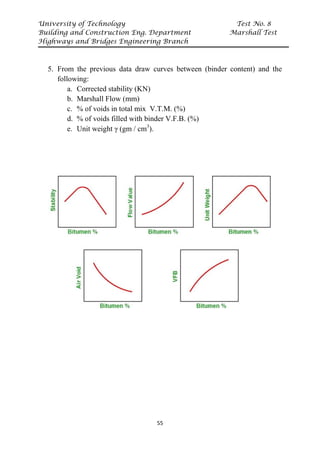
![University of Technology Test No. 5
Building and Construction Eng. Department Saybolt Viscosity Test
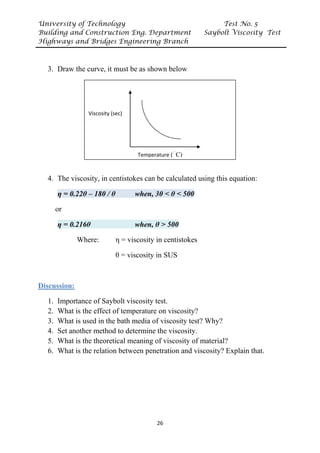
Highways and Bridges Engineering Branch
27
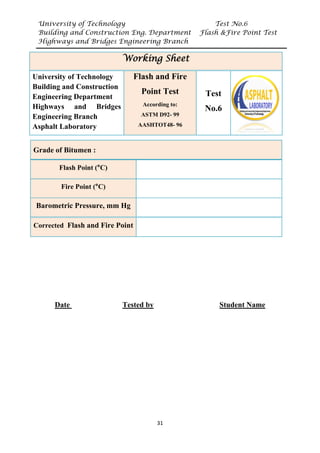
Date Tested by Student Name
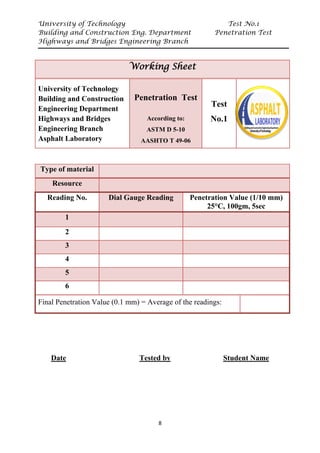
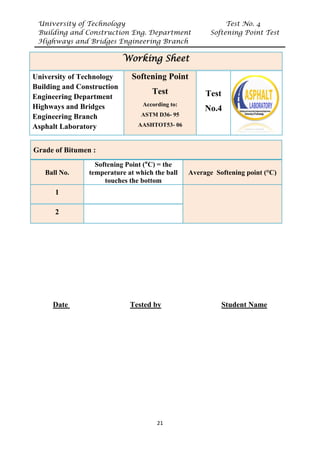
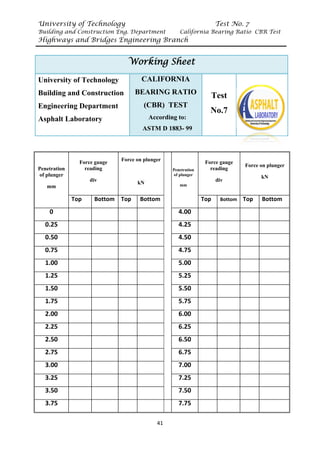
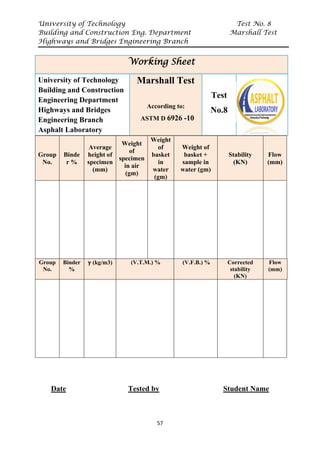
Working Sheet
University of Technology
Building and Construction
Engineering Department
Highways and Bridges
Engineering Branch
Asphalt Laboratory
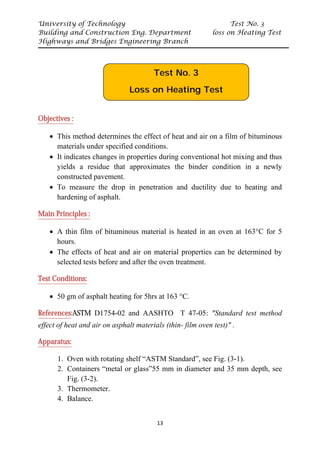
Saybolt
Viscosity Test
According to:
ASTM D 88- 99
Test
No.5
Grade of Bitumen :
Viscometer
No.
Testing
Temperature
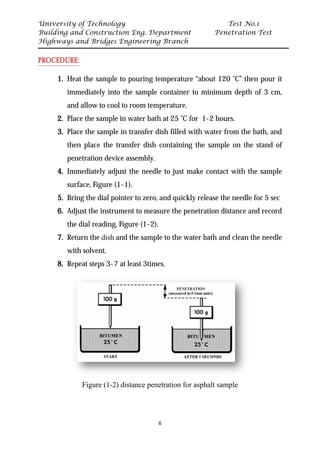
Efflux Time [SUV,SFV] Kinematic Viscosity
"centistokes" (cSt)
(min) (sec)](https://image.slidesharecdn.com/1583661374288143-240324191004-a39f34ec/85/Asphalt-Experiments-Guide-Laboratory-34-320.jpg)

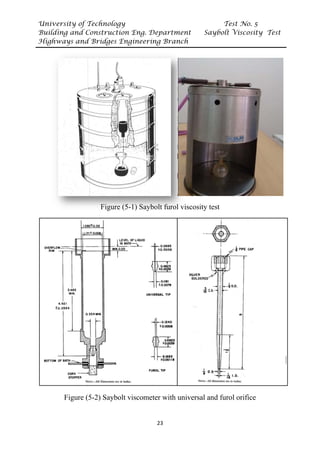
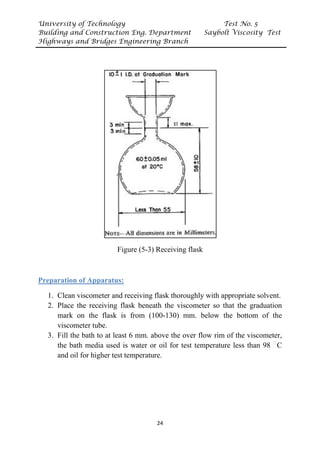
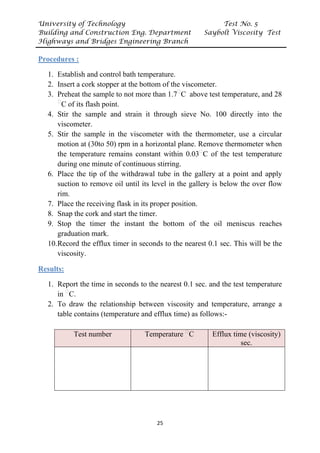
The document is a laboratory manual for asphalt testing prepared by Dr. Zaynab I. Qasim at the University of Technology, covering various tests such as penetration, ductility, loss on heating, and softening point. Each test includes objectives, principles, procedures, and grading criteria, providing technical details for students in the Building and Construction Engineering Department. The manual emphasizes the importance of proper report formatting and the analysis of results to ensure quality in engineering applications.


