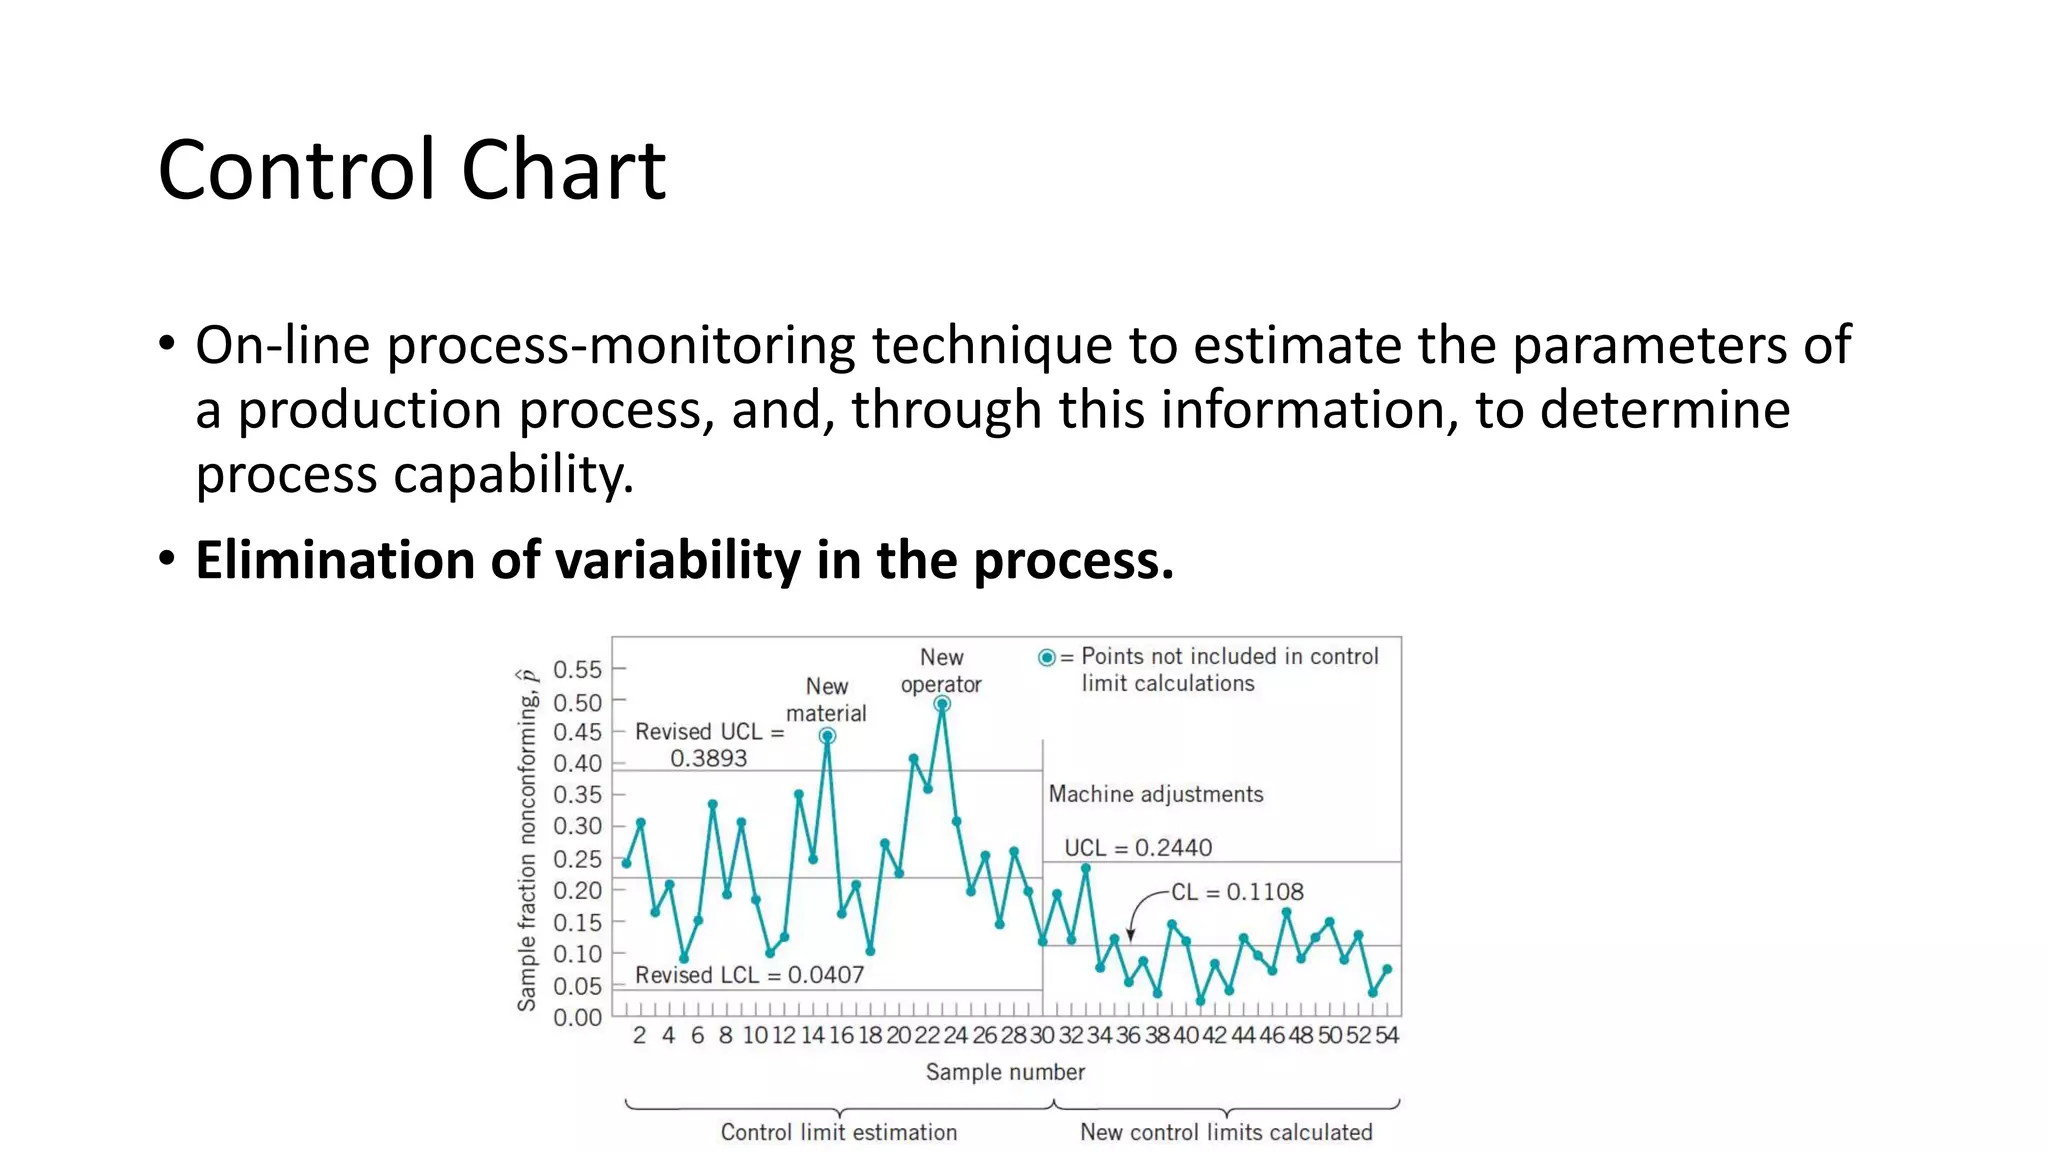
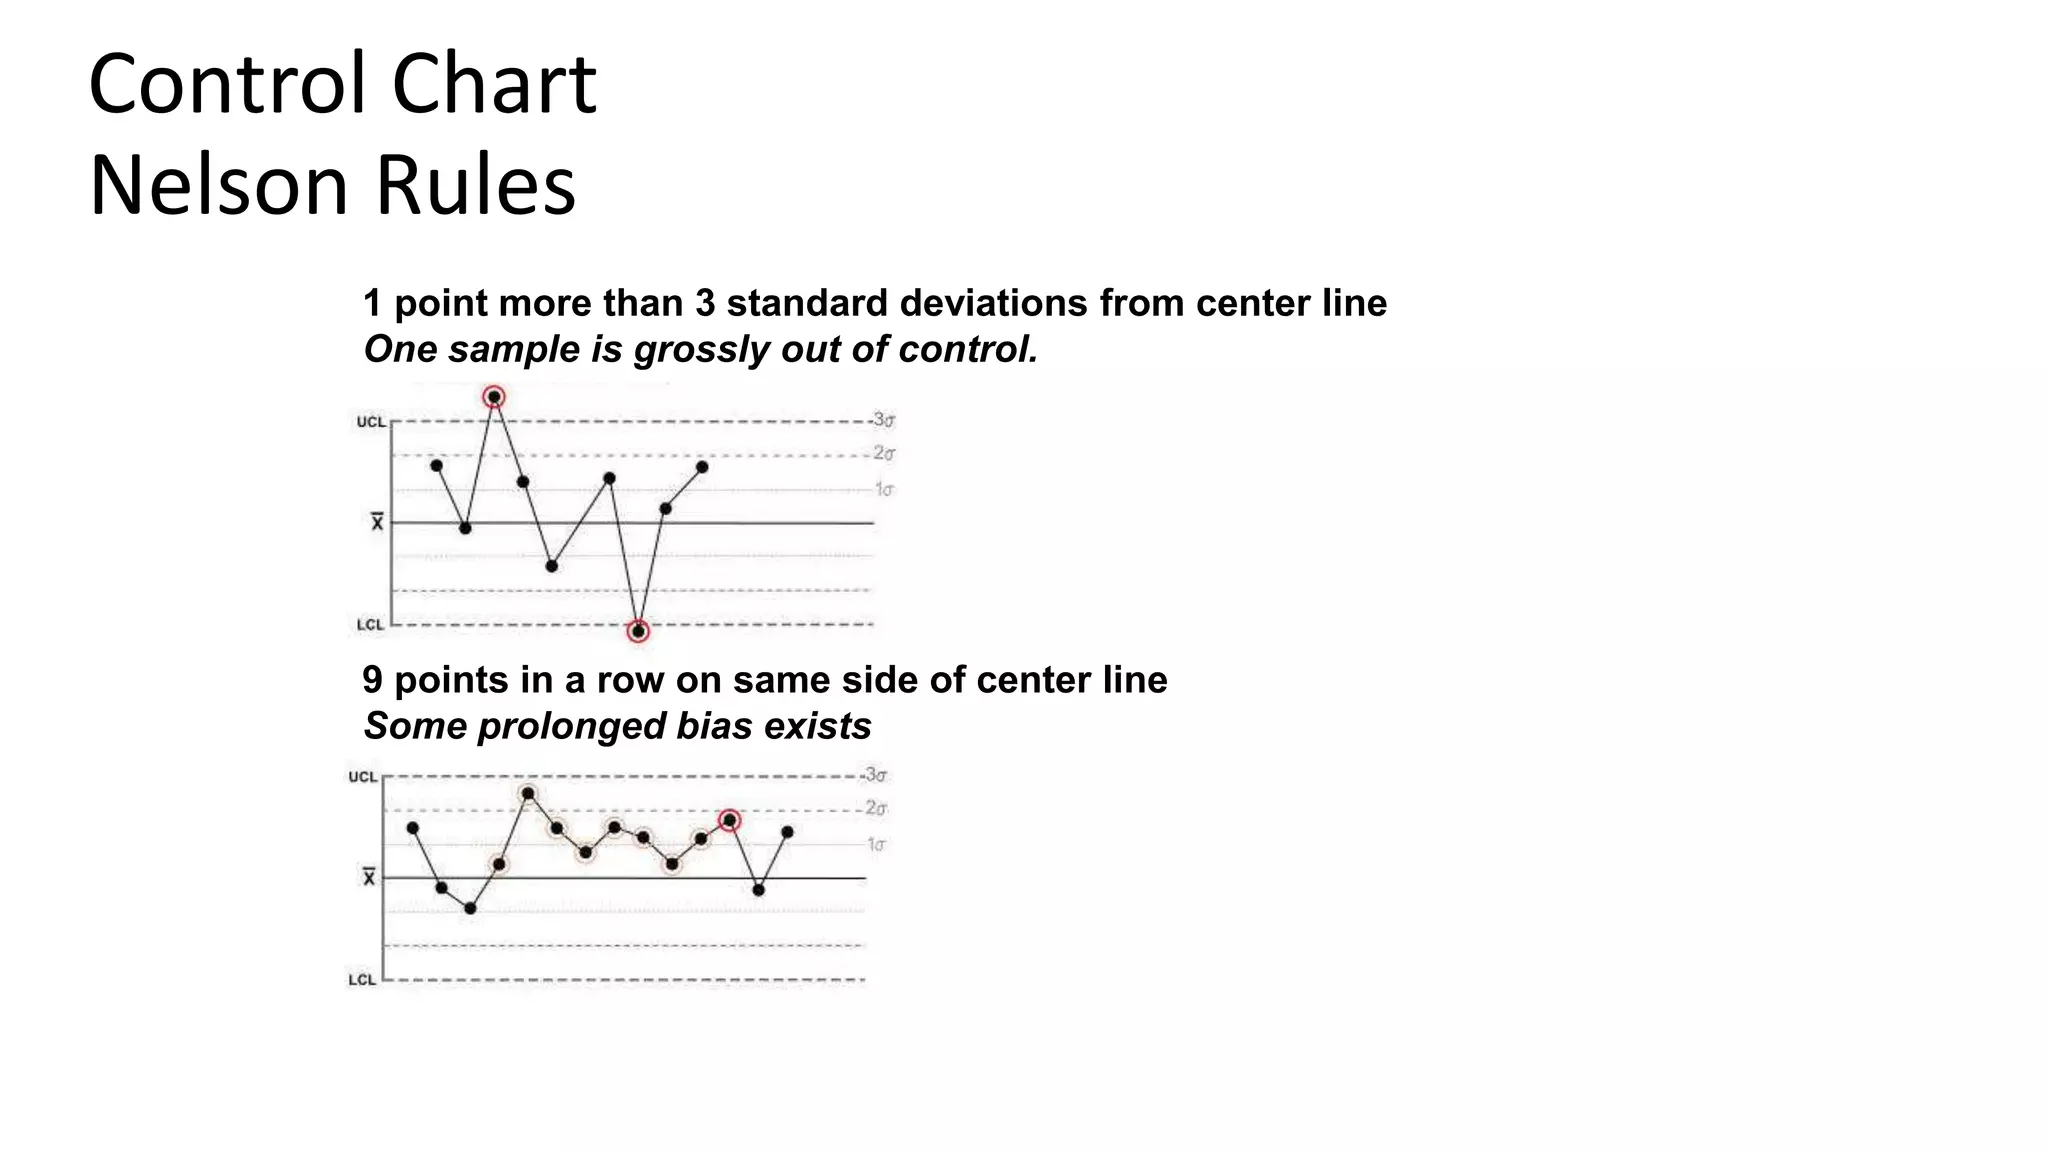
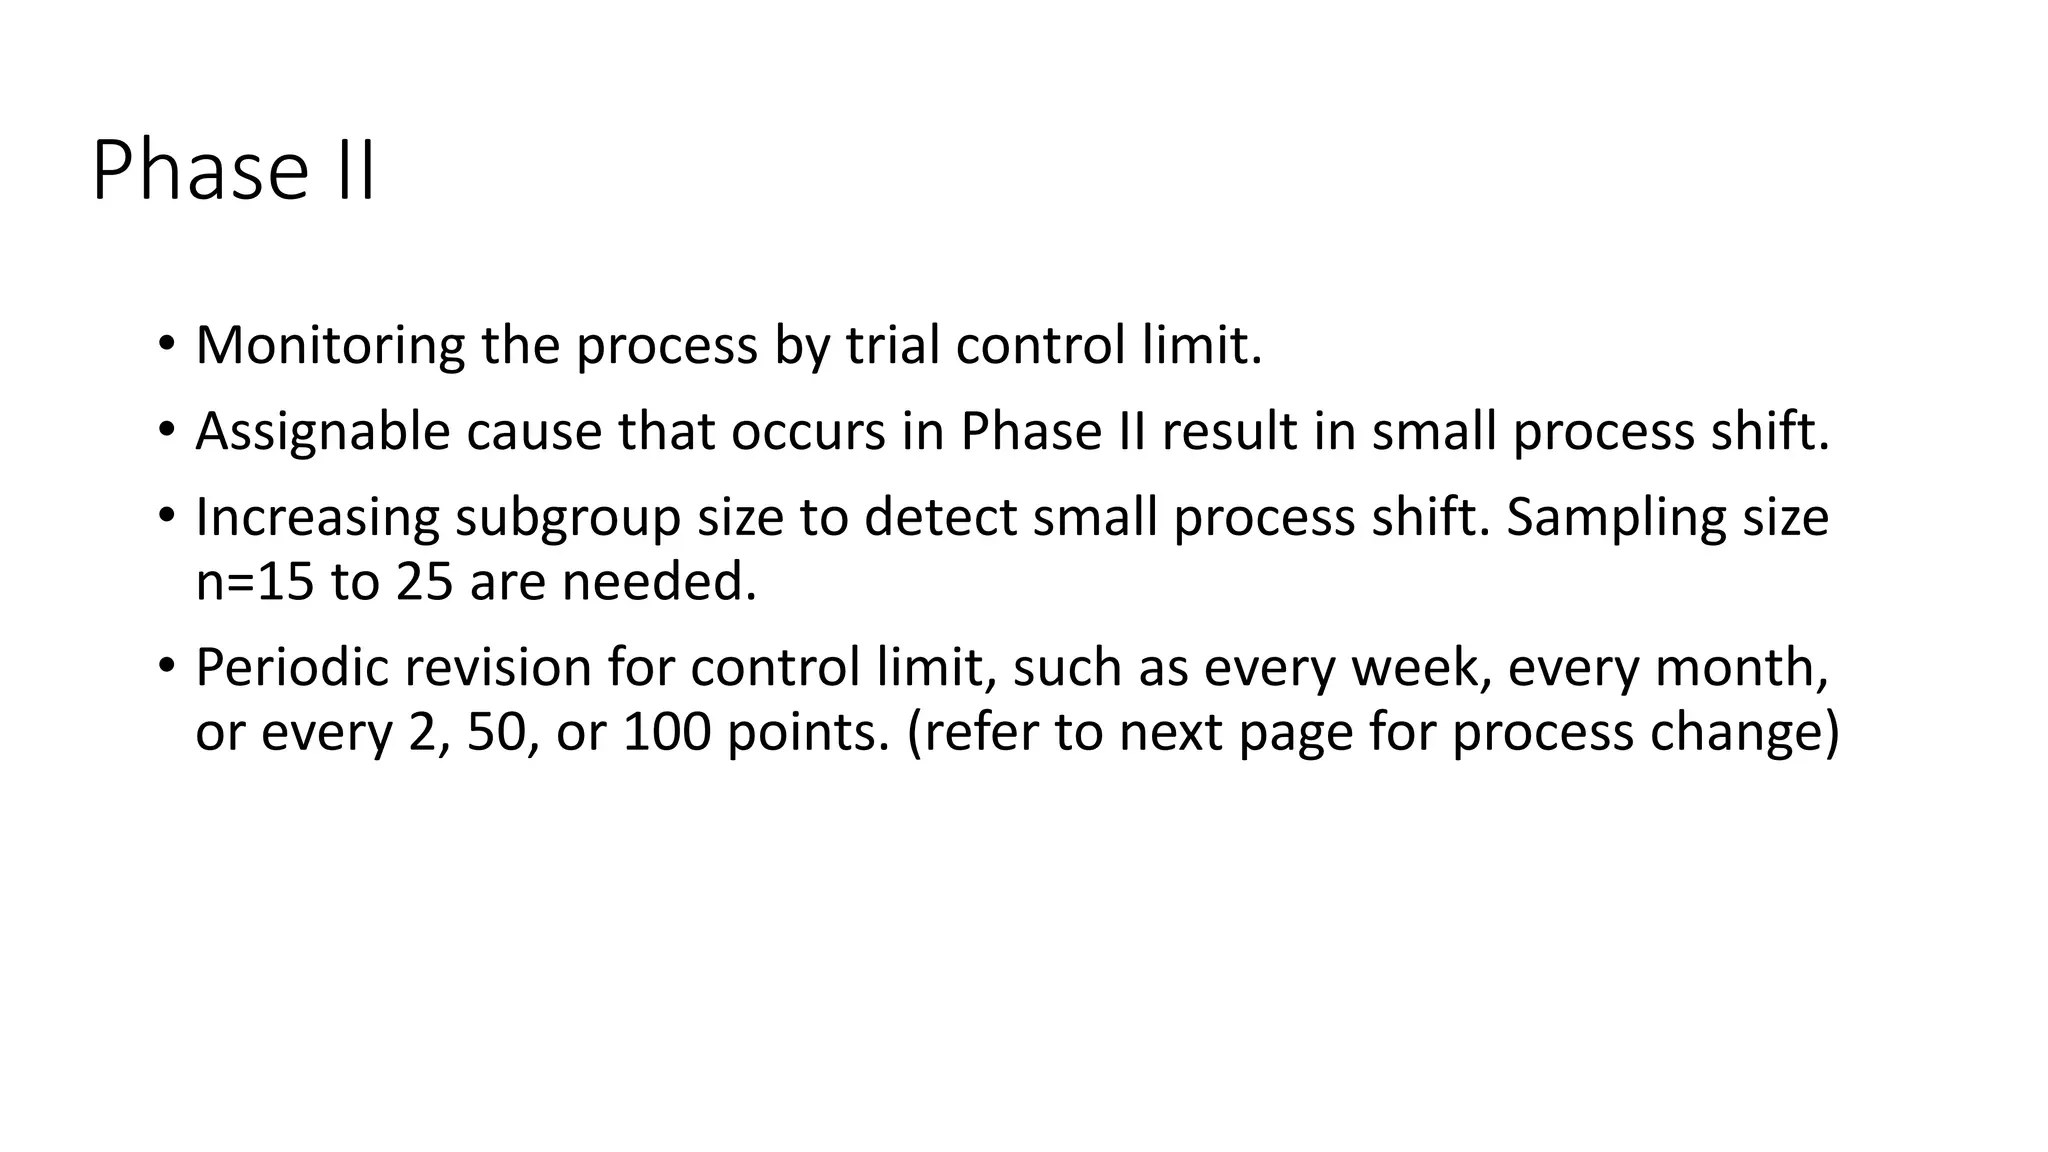
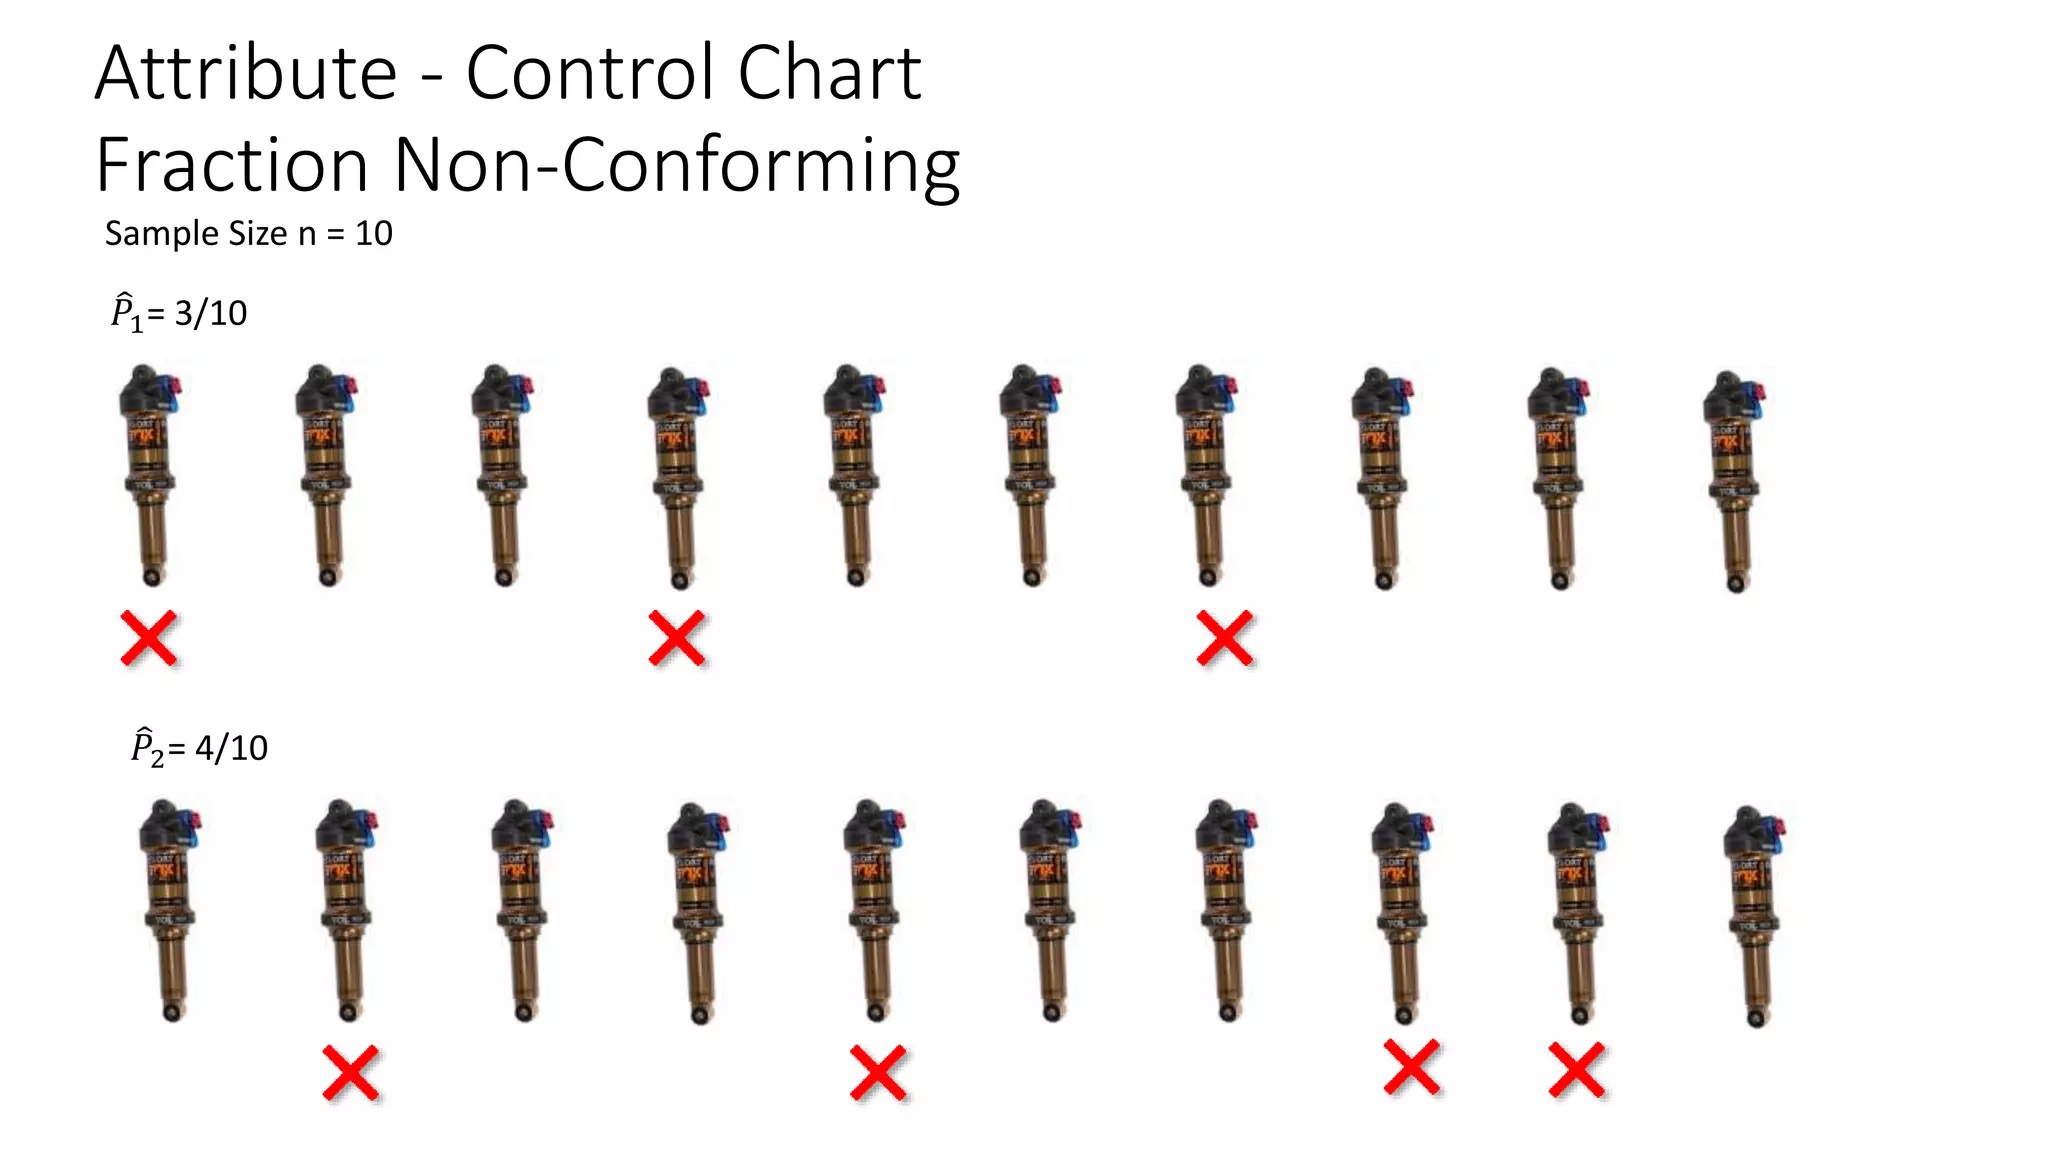
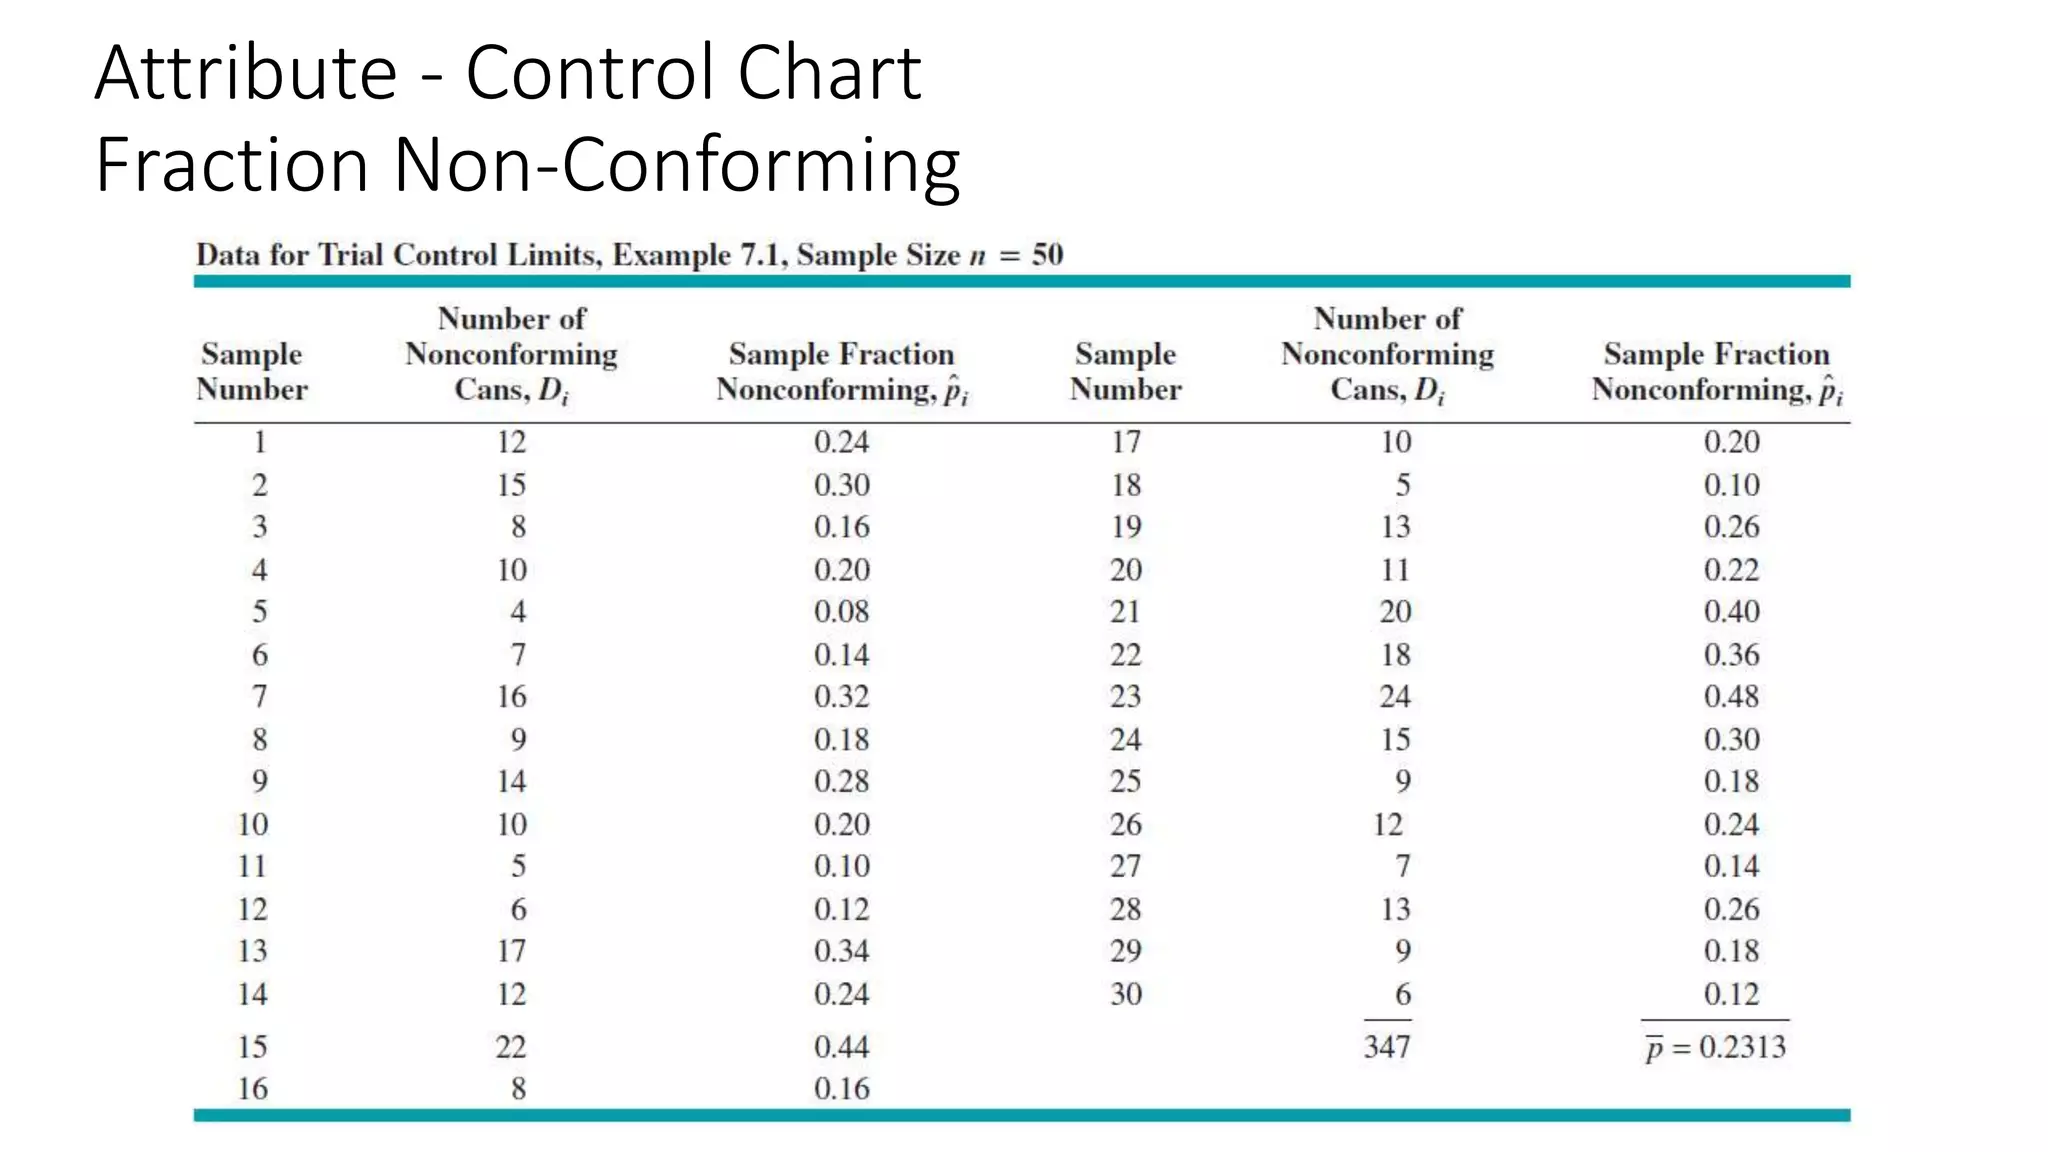
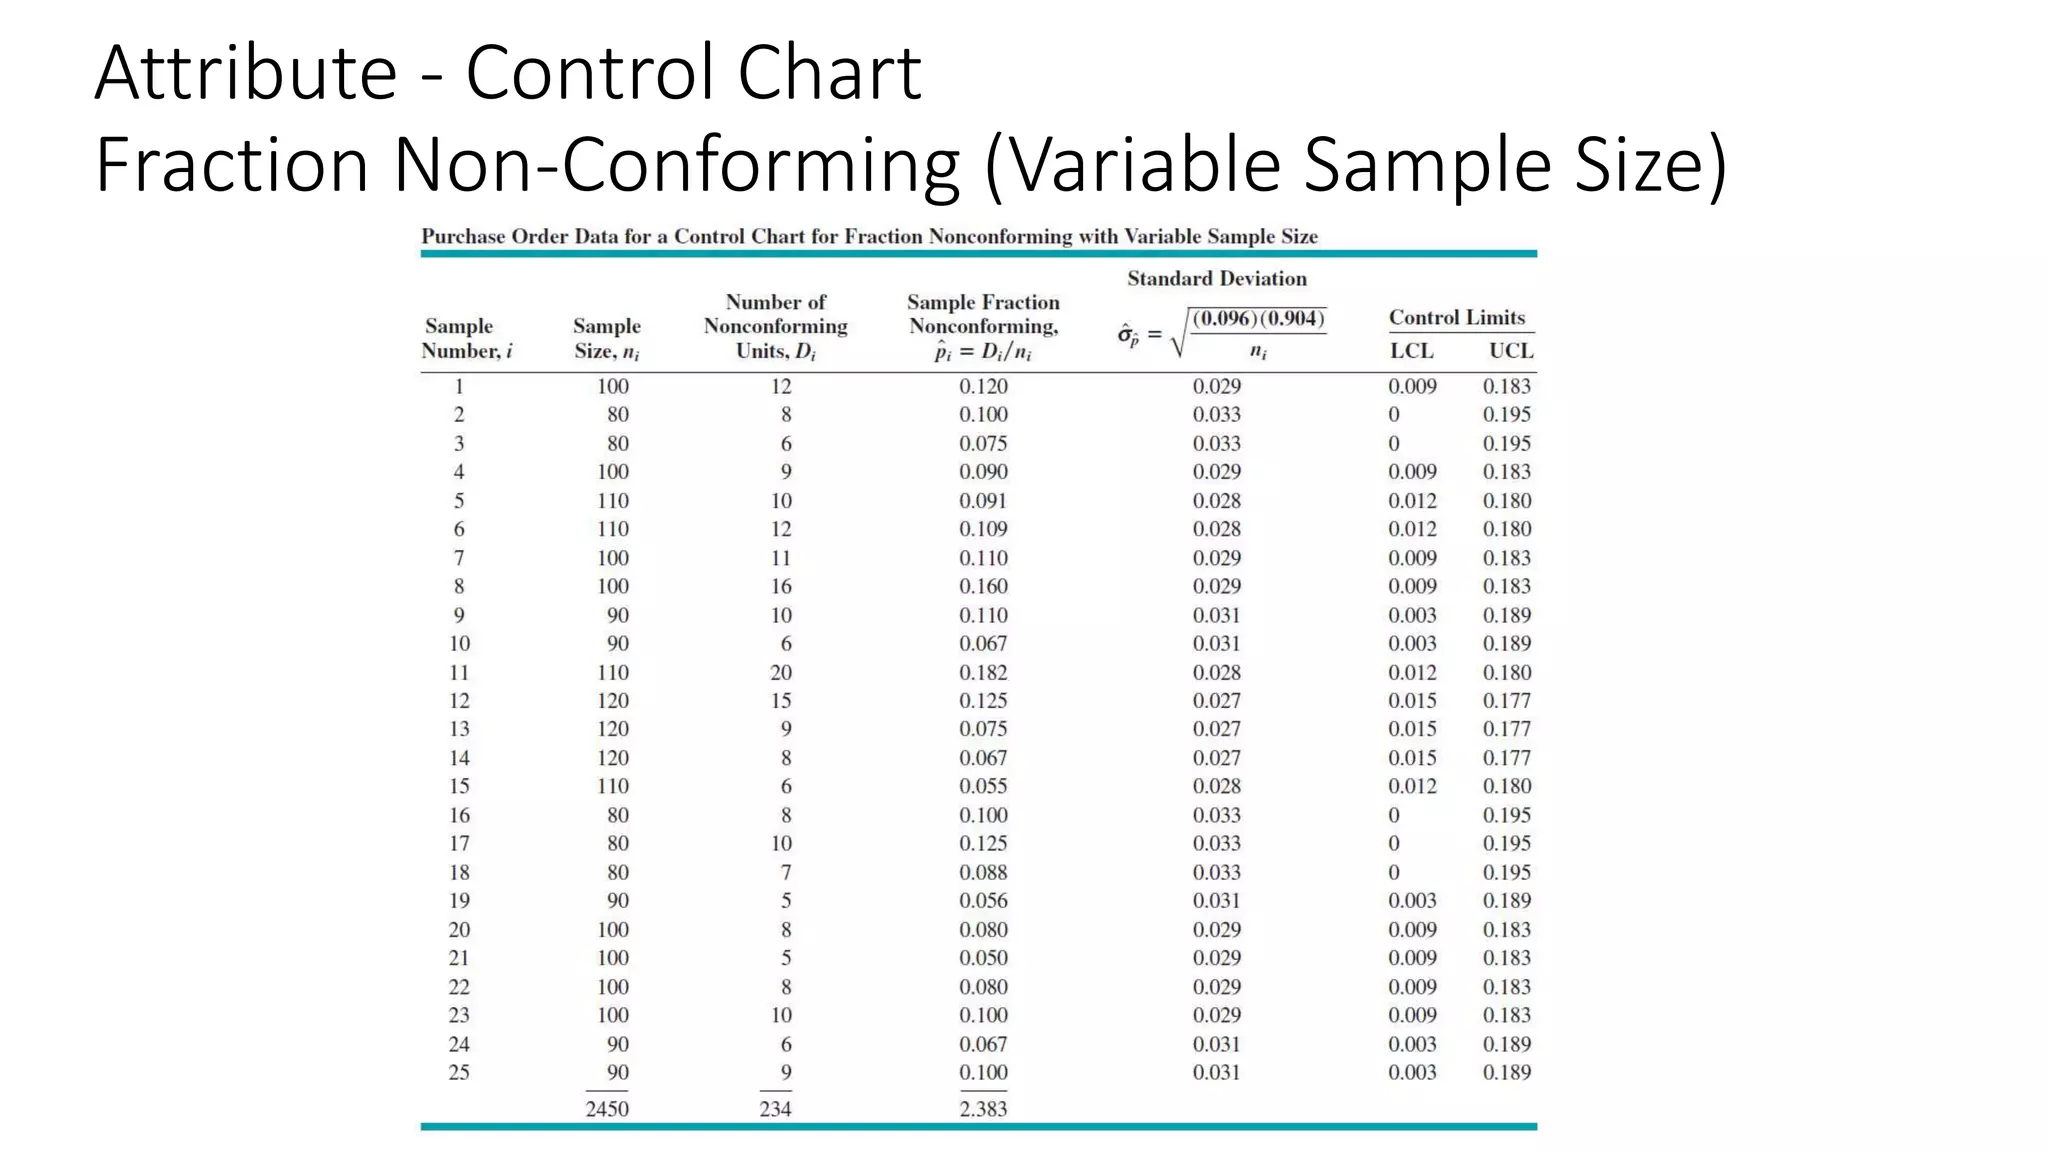
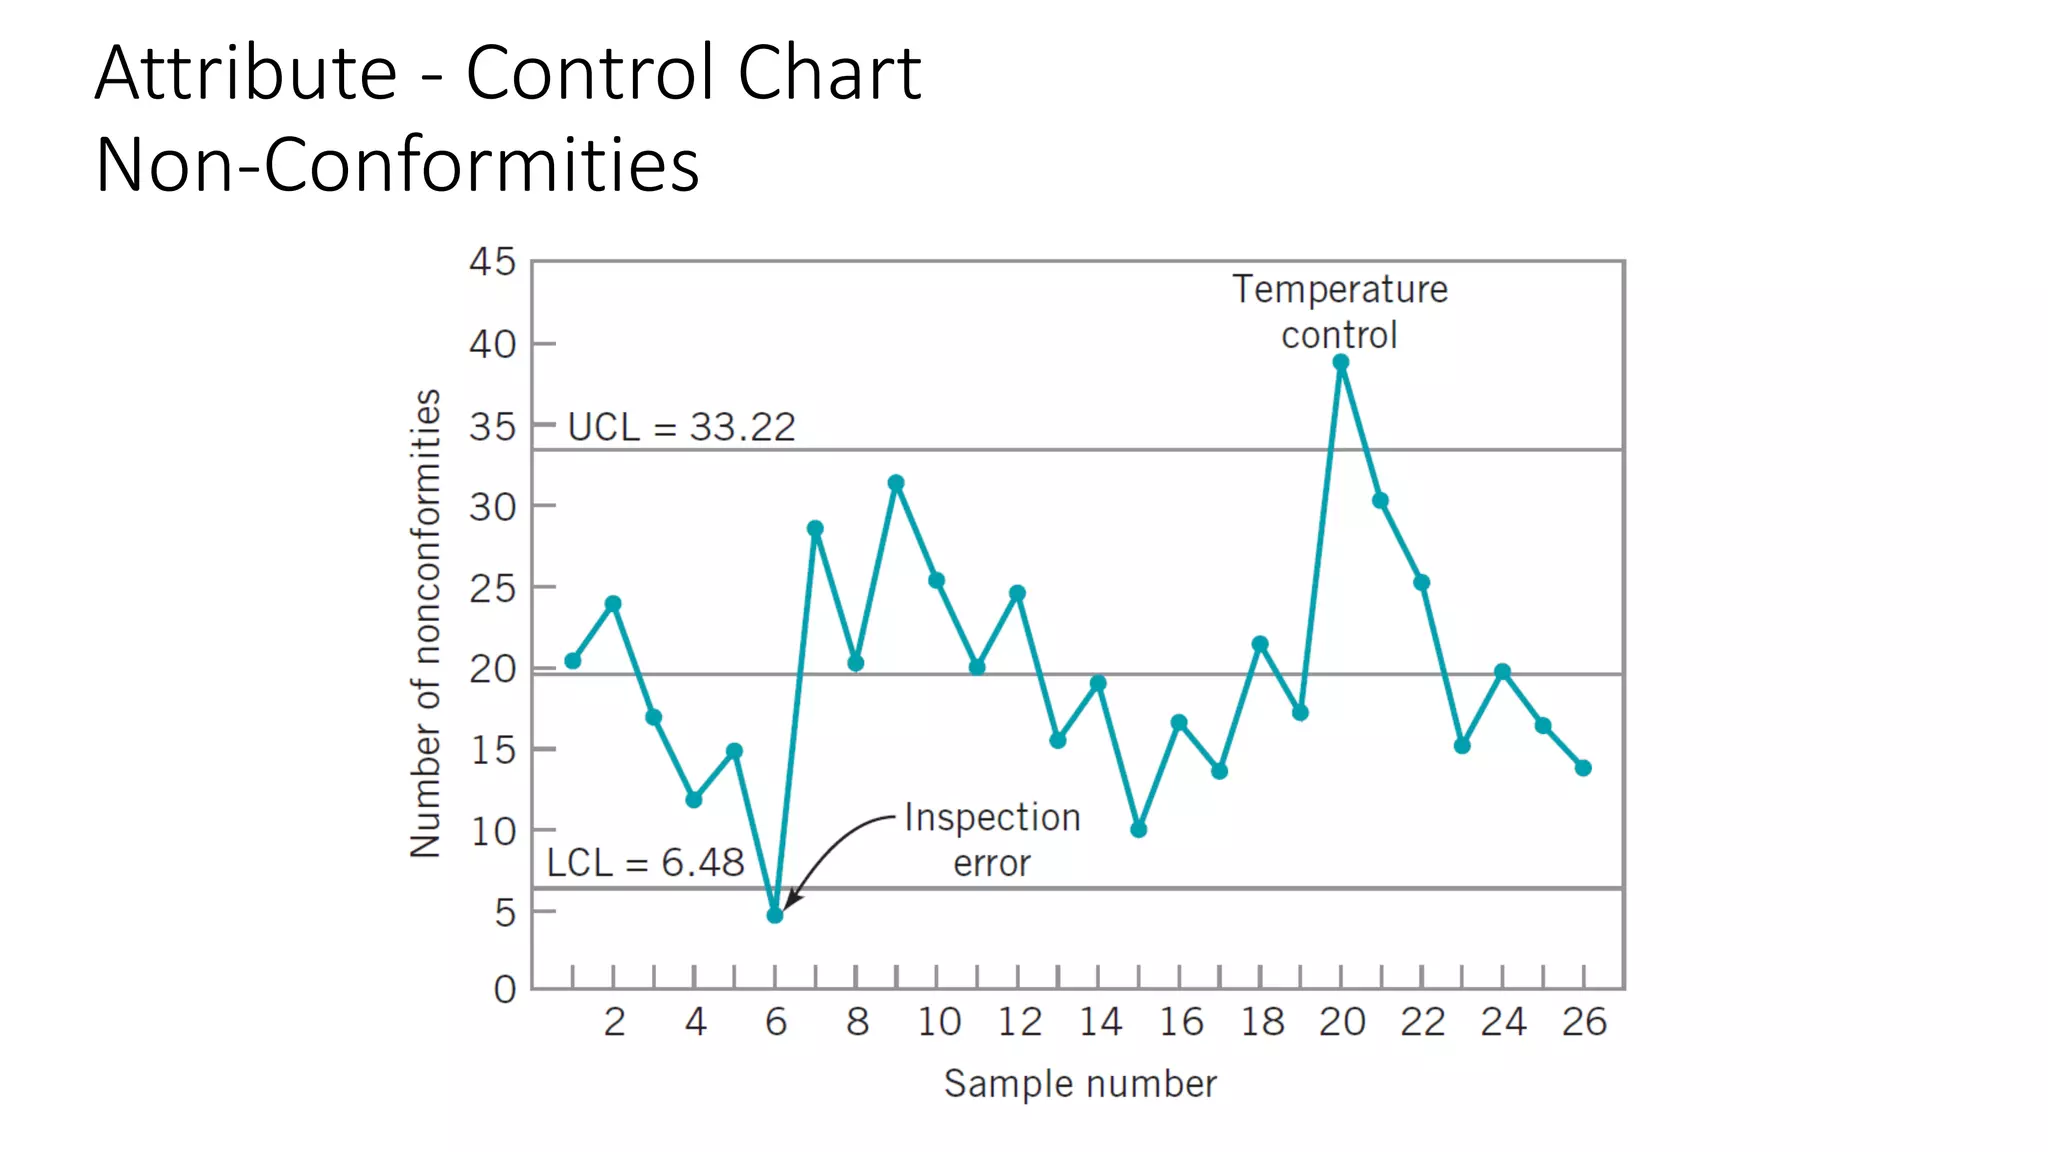
Control Charts
7/3/2019
QE Tony
Control Chart
• On-line process-monitoring technique to estimate the parameters of
a production process, and, through this information, to determine
process capability.
• Elimination of variability in the process.
Statistical Process Control Process
Normal Distribution Test
• Test if data fit normal distribution
before establishing control chart
• Put into transformation if data is not
normal
Phase I
Constructing Trial Control Limit
• At least 20 to 25 preliminary subgroups
(m) in establishing 𝑥 and R charts
• Rational subgroup (n) are defined
(refer to O-C curve)
• Sensitizing Rule against points are
excluded and a new set of control limit
are calculated.
• Assignable Cause Variation are
detected and corrected. (Equipment,
Incorrect Adjustment, Changes in Raw
Material)
O-C (Operating-Characteristic)
curves for the 𝑥 chart with three-
sigma limits.
𝛽 = P (not detecting a shift of k𝜎
in the mean on the first sample
following the shift).
In Phase I, subgroup size could
be 4, 5, or 6 are reasonable
effective to detect 2𝜎 or larger.
Define Sub-Group Size
Select Proper Control Chart
* Sample Size > 10 or 12
Sampling Method
• Snapshot/Random
Sample Approach.
• Be sure to separate into
different control chart by
each machine.
Pattern Explanation
Control Chart
Nelson Rules
1 point more than 3 standard deviations from center line
One sample is grossly out of control.
9 points in a row on same side of center line
Some prolonged bias exists
6 points in a row, all increasing or all decreasing
A trend exists
14 points in a row, alternating up and down
This much oscillation is beyond noise
Control Chart
Nelson Rules
2 out of 3 points > 2 standard deviations from center line (same side)
There is a medium tendency for samples to be mediumly out of control.
4 out of 5 points > 1 standard deviation from center line (same side)
There is a strong tendency for samples to be slightly out of control.
Control Chart
Nelson Rules
15 points in a row within 1 standard deviation of center line (either side)
With 1 standard deviation, greater variation would be expected.
8 points in a row > 1 standard deviation from center line (either side)
Jumping from above to below whilst missing the first standard deviation band is
rarely random
Control Chart
Nelson Rules
Assignable Cause Variation Analysis
• Point 15 & 23: Do not drop the points
with assignable causes from chart, but
exclude from the control limit
calculation.
• Point 21: Retain the point if analysis of
data does not produce any reasonable
or logical assignable cause.
Phase II
• Monitoring the process by trial control limit.
• Assignable cause that occurs in Phase II result in small process shift.
• Increasing subgroup size to detect small process shift. Sampling size
n=15 to 25 are needed.
• Periodic revision for control limit, such as every week, every month,
or every 2, 50, or 100 points. (refer to next page for process change)
Process Change
Control Limit Calculation
Control Chart
Plot 𝑥 − 𝑅 chart
Control Chart
Plot 𝑥 − 𝑅 Chart
Control Chart
Index
Attribute - Control Chart
Fraction Non-Conforming
𝑃1= 3/10
Sample Size n = 10
𝑃2= 4/10
Attribute - Control Chart
Fraction Non-Conforming
Attribute - Control Chart
Fraction Non-Conforming
Attribute - Control Chart
Fraction Non-Conforming (Variable Sample Size)
𝑃1= 3/10
Sample Size n = 10
𝑃2= 2/8
Attribute - Control Chart
Fraction Non-Conforming (Variable Sample Size)
Attribute - Control Chart
Fraction Non-Conforming (Variable Sample Size)
Attribute - Control Chart
Non-Conformities
𝑁𝑢𝑚𝑏𝑒𝑟 𝑜𝑓 𝑁𝑜𝑛_𝑐𝑜𝑛𝑓𝑜𝑒𝑚𝑖𝑡𝑖𝑒𝑠1= 22
Sample Size n = 10
𝑁𝑢𝑚𝑏𝑒𝑟 𝑜𝑓 𝑁𝑜𝑛_𝑐𝑜𝑛𝑓𝑜𝑒𝑚𝑖𝑡𝑖𝑒𝑠2= 18
Attribute - Control Chart
Non-Conformities
Attribute - Control Chart
Non-Conformities

6 control charts

  • 1.
  • 2.
    Control Chart • On-lineprocess-monitoring technique to estimate the parameters of a production process, and, through this information, to determine process capability. • Elimination of variability in the process.
  • 3.
  • 4.
    Normal Distribution Test •Test if data fit normal distribution before establishing control chart • Put into transformation if data is not normal
  • 5.
    Phase I Constructing TrialControl Limit • At least 20 to 25 preliminary subgroups (m) in establishing 𝑥 and R charts • Rational subgroup (n) are defined (refer to O-C curve) • Sensitizing Rule against points are excluded and a new set of control limit are calculated. • Assignable Cause Variation are detected and corrected. (Equipment, Incorrect Adjustment, Changes in Raw Material)
  • 6.
    O-C (Operating-Characteristic) curves forthe 𝑥 chart with three- sigma limits. 𝛽 = P (not detecting a shift of k𝜎 in the mean on the first sample following the shift). In Phase I, subgroup size could be 4, 5, or 6 are reasonable effective to detect 2𝜎 or larger. Define Sub-Group Size
  • 7.
    Select Proper ControlChart * Sample Size > 10 or 12
  • 8.
    Sampling Method • Snapshot/Random SampleApproach. • Be sure to separate into different control chart by each machine.
  • 9.
  • 10.
    Control Chart Nelson Rules 1point more than 3 standard deviations from center line One sample is grossly out of control. 9 points in a row on same side of center line Some prolonged bias exists
  • 11.
    6 points ina row, all increasing or all decreasing A trend exists 14 points in a row, alternating up and down This much oscillation is beyond noise Control Chart Nelson Rules
  • 12.
    2 out of3 points > 2 standard deviations from center line (same side) There is a medium tendency for samples to be mediumly out of control. 4 out of 5 points > 1 standard deviation from center line (same side) There is a strong tendency for samples to be slightly out of control. Control Chart Nelson Rules
  • 13.
    15 points ina row within 1 standard deviation of center line (either side) With 1 standard deviation, greater variation would be expected. 8 points in a row > 1 standard deviation from center line (either side) Jumping from above to below whilst missing the first standard deviation band is rarely random Control Chart Nelson Rules
  • 14.
    Assignable Cause VariationAnalysis • Point 15 & 23: Do not drop the points with assignable causes from chart, but exclude from the control limit calculation. • Point 21: Retain the point if analysis of data does not produce any reasonable or logical assignable cause.
  • 15.
    Phase II • Monitoringthe process by trial control limit. • Assignable cause that occurs in Phase II result in small process shift. • Increasing subgroup size to detect small process shift. Sampling size n=15 to 25 are needed. • Periodic revision for control limit, such as every week, every month, or every 2, 50, or 100 points. (refer to next page for process change)
  • 16.
  • 17.
  • 18.
  • 19.
  • 20.
  • 21.
    Attribute - ControlChart Fraction Non-Conforming 𝑃1= 3/10 Sample Size n = 10 𝑃2= 4/10
  • 22.
    Attribute - ControlChart Fraction Non-Conforming
  • 23.
    Attribute - ControlChart Fraction Non-Conforming
  • 24.
    Attribute - ControlChart Fraction Non-Conforming (Variable Sample Size) 𝑃1= 3/10 Sample Size n = 10 𝑃2= 2/8
  • 25.
    Attribute - ControlChart Fraction Non-Conforming (Variable Sample Size)
  • 26.
    Attribute - ControlChart Fraction Non-Conforming (Variable Sample Size)
  • 27.
    Attribute - ControlChart Non-Conformities 𝑁𝑢𝑚𝑏𝑒𝑟 𝑜𝑓 𝑁𝑜𝑛_𝑐𝑜𝑛𝑓𝑜𝑒𝑚𝑖𝑡𝑖𝑒𝑠1= 22 Sample Size n = 10 𝑁𝑢𝑚𝑏𝑒𝑟 𝑜𝑓 𝑁𝑜𝑛_𝑐𝑜𝑛𝑓𝑜𝑒𝑚𝑖𝑡𝑖𝑒𝑠2= 18
  • 28.
    Attribute - ControlChart Non-Conformities
  • 29.
    Attribute - ControlChart Non-Conformities

Editor's Notes