Downloaded 1,117 times


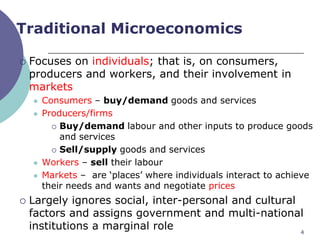


The document outlines a course on traditional microeconomic theory, focusing on consumer and producer behavior, efficiency, and equity in economic actions and policies. It discusses key assumptions such as rationality and maximization, and examines concepts such as consumer preferences, indifference curves, and budget constraints. The course also provides resources for further learning and practical exercises to enhance understanding of microeconomic principles.


![[PERT-3] Consumer Behaviour.pdf](https://cdn.slidesharecdn.com/ss_thumbnails/pert-3consumerbehaviour-231017015937-da9d2839-thumbnail.jpg?width=640&height=640&fit=bounds)