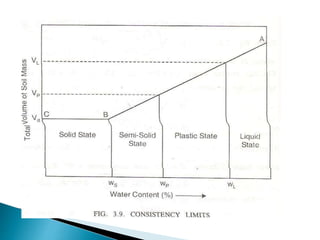
The document discusses soil consistency and the various states of soil based on water content. It describes the four stages as:
1) Liquid state - when soil is thoroughly mixed with large quantity of water and offers no resistance to flow.
2) Plastic state - when water content is reduced and soil offers small shear strength and can be molded.
3) Semi-solid state - when water content is further reduced from the plastic state.
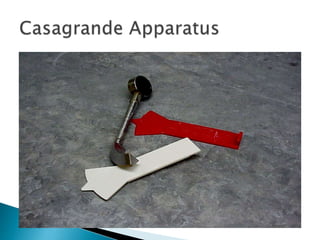
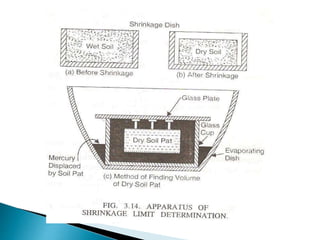
4) Solid state - the lowest water content where the soil volume no longer decreases. Tests are described to determine the liquid limit, plastic limit, and shrinkage limit which define the boundaries between these states.
index properties of soil, Those properties of soil which are used in the identification and classification of soil are known as INDEX PROPERTIES
Water content
Specific gravity
In-situ density
Particle size
Consistency
Relative Density
index properties of soil, Those properties of soil which are used in the identification and classification of soil are known as INDEX PROPERTIES
Water content
Specific gravity
In-situ density
Particle size
Consistency
Relative Density
This presentation covers the topic of particle size classification, dry sieve analysis, wet sieve analysis, sedimentation analysis, stokes law, methods of sedimentation analysis, Indian Standard Soil classification system.
Clay Minerology & Plasticity Characteristics of SoilArbaz Kazi
This presentation describes about various states of soil, plasticity of soil, various clay minerals, consistency limits, structure of clay minerals, classification of clay minerals based on Activity number
This presentation includes Definition of Permeability, measurement of Permeability, Validity of Darcy's law, Darcy's Law, Methods of Finding Permeability, factors affecting permeability, Permeability of Stratified Soil
Stream flow representing the runoff phase of the hydrologic cycle is the most important basic data for hydrologic studies. Runoff is generated by rainstorms. Its occurrence and quantity are dependent on the characteristics of the rainfall event, i.e. intensity, duration and distribution. This module highlights about runoff components of the hydrological cycle.
Sieve analysis
Atterberg limit test (liquid limit & Plastic limit)
Compaction test (Standard and modified proctor test)
California bearing ratio test (CBR)
10337 sayılı genelge uyarınca hazırlanan imar planına esas jeolojik-jeoteknik etüt raporu işlerinde dikkat edilecek hususlar
her bir başlık altında ayrıntılı açıklması var
6th International Conference on Machine Learning & Applications (CMLA 2024)ClaraZara1
6th International Conference on Machine Learning & Applications (CMLA 2024) will provide an excellent international forum for sharing knowledge and results in theory, methodology and applications of on Machine Learning & Applications.
Harnessing WebAssembly for Real-time Stateless Streaming PipelinesChristina Lin
Traditionally, dealing with real-time data pipelines has involved significant overhead, even for straightforward tasks like data transformation or masking. However, in this talk, we’ll venture into the dynamic realm of WebAssembly (WASM) and discover how it can revolutionize the creation of stateless streaming pipelines within a Kafka (Redpanda) broker. These pipelines are adept at managing low-latency, high-data-volume scenarios.
Using recycled concrete aggregates (RCA) for pavements is crucial to achieving sustainability. Implementing RCA for new pavement can minimize carbon footprint, conserve natural resources, reduce harmful emissions, and lower life cycle costs. Compared to natural aggregate (NA), RCA pavement has fewer comprehensive studies and sustainability assessments.
Recycled Concrete Aggregate in Construction Part III
Consistency of soils
1.
2. Consistency is a term which is used to
describe the degree of firmness of a soil in a
qualitative manner by using descriptions such as soft
medium, firm,stiff or hard.
It is relative ease with which a soil can be deformed.
In practice , the property of consistency is
associated only with fine – grained soils, especially
clay.
It is depends upon the water content
3. Four stages of consistency:
1.The liquid state
2.The plastic state
3.The semi solid state
4.The solid state
4. 1.The liquid state
when a fine grained soil is mixed thoroughly with a large
quantity of water , the resulting suspension is in a liquid state,
and offers practically no resistance to flow.
The soil has no shear strength.
2.The plastic state
The water content of soil the suspension is gradually
reduced to keep the consistency of the sample uniform,
a stage comes when it just offering resistance to flow.
The soil has small shear strength and change from liquid state to
plastic state.
5. The boundary of water content
between liquid and plastic state is called
“LIQUID LIMIT”.
In the plastic state, the soil can be
moulded to different shapes with out
rupturing it, due to its plasticity.
If the water content is further
reduced , the clay sample changes from
plastic state to the semi-solid state it is called
as “PLASTIC LIMITS”.
6. When the water content of the soil mass is
decrease, the volume of soil mass does not
decrease any further but remains the same.
The sample changes from the semi-solid to
solid state.
The boundary water content is called
“SHRINKAGE LIMITS”.
7.
8.
9.
10.
11.
12.
13. About 100g of soil specimen passing through 425
micron sieve is mixed thoroughly with distilled
water in the evaporating dish to form a uniform
paste.
A portion of the paste is placed in the cup of
liquid limit device
Level the mix to have a maximum depth of 1cm.
Draw the grooving tool through the sample
along the symmetrical axis of the cup, holding
the tool perpendicular to the cup.
Rotate the handle at a rate of about 2
revolutions per second and the number of blows
are counted till the two parts come into contact
at the bottom of the groove.
By altering the water content of the soil &
repeating the operation, obtain 5 readings in the
range of 20-35 blows.
14. The liquid limit is determined by plotting the
graph on the semi-log graph between the
number of blows as abscissa on a logarithmic
and water content as ordinate.
The water content corresponding to 25 blows
shows the liquid limit.
19. About 15g of oven dried soil specimen passing
through IS 425 micron sieve is taken and mixed
thoroughly with distilled water until the soil mass
becomes plastic enough to be easily moulded into
a ball with fingers.
Take a portion of the ball and roll it on a
glassplate to form the soil mass into a thread of
uniform diameter throughout its length.
Take care that diameter should be around 3 mm.
When the diameter reaches 3mm, the soil is
remoulded into a ball.
The process of rolling and remoulding is repeated
until the soil just crumbling.
The crumbled threads are kept for water content
determination.
Repeat the test with two more samples.
20. Weight of dry soil taken (g)
=
Weight of empty container (g)
=
Weight of wet soil before drying W1 (g) =
Weight of soil after drying W2 (g)
=
Water content =
Plasticity index IP = Liquid limit - Plastic limit
21.
22.
23. Mix about 50 g of soil passing through 425 micron
sieve with distilled water to make a creamy paste
which can be placed in the shrinkage dish without
any air voids.
The required mixing water content is somewhat
greater than the liquid limit.
Coat a thin layer of Vaseline inside of the
shrinkage dish and weigh.
Fill the dish in three layers by soil paste. The last
layer should stand above the rim.
Weigh the dish full of wet soil immediately. Dry in
oven at 105 to 110 C
Remove the dry pat from the dish, clean and dry
the shrinkage dish and determine its empty mass.
24. Weigh the empty mercury-weighing dish also.
Keep the shrinkage dish in large porcelain
dish, fill it to overflowing with mercury.
Transfer the contents of the shrinkage dish to
the mercury weighing dish.
Place the glass cup in a large dish, fill to
overflowing with mercury and remove the
excess by pressing the glass plate.
Place the dry soil pat on the surface of mercury
and submerge it.
Transfer the mercury displaced by the dry pat
to the mercury weighing dish and weigh.
25. Weight of shrinkage dish w1 (g) =
Weight of shrinkage dish + wet soil w2 (g) =
Weight of the wet soil in shrinkage dish (w2-w1) (g) =
Weight of shrinkage dish + dry soil w3 (g) =
Weight of the dry soil pat (w3-w1) =ws (g)
=
Volume of wet soil =Volume of shrinkage dish =
V1 (cc) = g/cc
Volumes of the dry soil pat V2 (cc) = g/cc
26. Shrinkage limits =
Shrinkage Ratio Ws/v2ρw = %
Volumetric shrinkage V 1-V2/V2 x 100
Volume of wet soil =Volume of shrinkage dish = V1 (cc)
Volumes of the dry soil pat = V2 (cc)
27. ◦ Plasticity index
◦ flow index
◦ Toughness index
◦ Consistency index
◦ Liquidity index
29. Where,
W1 = water content corresponding to number of
blows,N1
W2 = water content corresponding to number of
blows,N2
30. Toughness index is the ratio of plasticity index to
flow index
Consistency index:
liquidity index:
31. ACTIVITY NUMBER:
The relation between plasticity index and soil
fraction less than 2µ is called activity number.
Soil type
< 0.75 inactive
0.75 to 1.40 normal
>1.40 Active