Downloaded 16 times
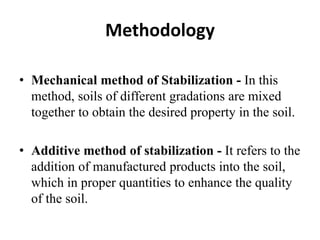


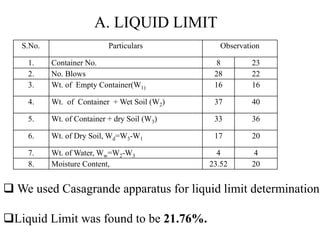
![A.WATER CONTENT
We used Oven Drying method for water content
determination whose temperature is maintained at
105 ̊C-110 ̊C
Water Content = 13.63%
S.No. Sample No. 1 2 3
1 Weight of container with lid 20 16 16
W1 gm
2 Weight of container with lid +wet 70 66 66
soil W2 gm
3 Weight of container with lid +dry 64 60 60
soil W3 gm
4
Water/Moisture content
(Percentage,%)
W = [(W2−W3)/(W3−W1)] 100 13.63 13.63 13.63](https://image.slidesharecdn.com/soilstabalisationppt-190319190939/85/Soil-stabalisation-ppt-16-320.jpg)
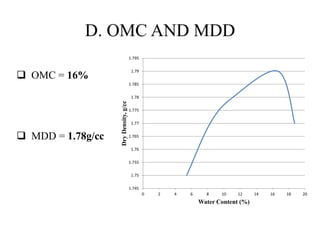
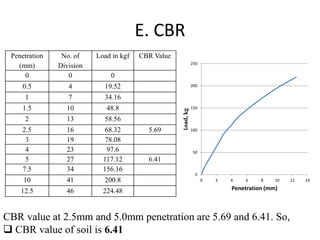
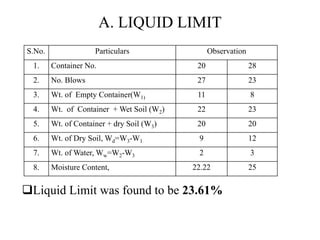
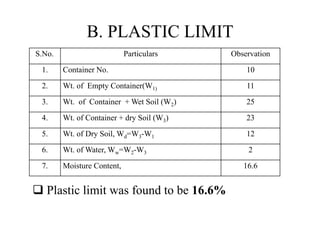
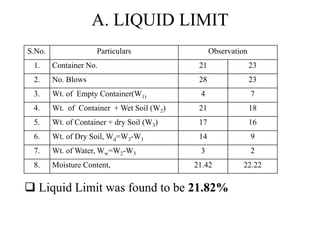
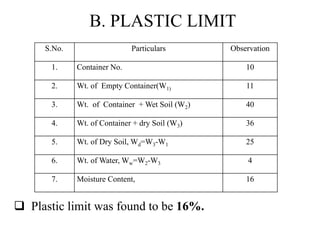
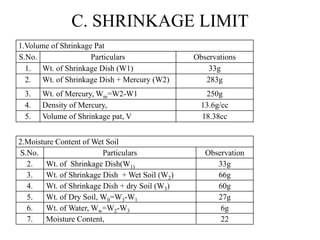
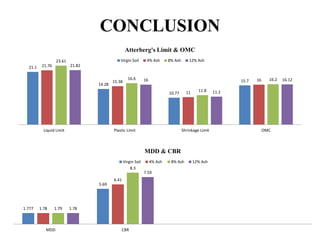

The document presents a minor project on soil stabilization using burnt municipal solid waste ash, highlighting objectives such as reducing waste dumping, pavement costs, and improving soil bearing capacity. Various methodologies and experiments were conducted to analyze soil characteristics, including water content, grain size, liquid and plastic limits, Proctor tests, and California Bearing Ratio (CBR) values. Results indicate improvements in soil properties when using the burnt ash as a stabilizing agent, with specific values reported for moisture content and CBR in different samples.


![Geotechnical Engineering-II [Lec #11: Settlement Computation]](https://cdn.slidesharecdn.com/ss_thumbnails/11-181020124840-thumbnail.jpg?width=640&height=640&fit=bounds)


