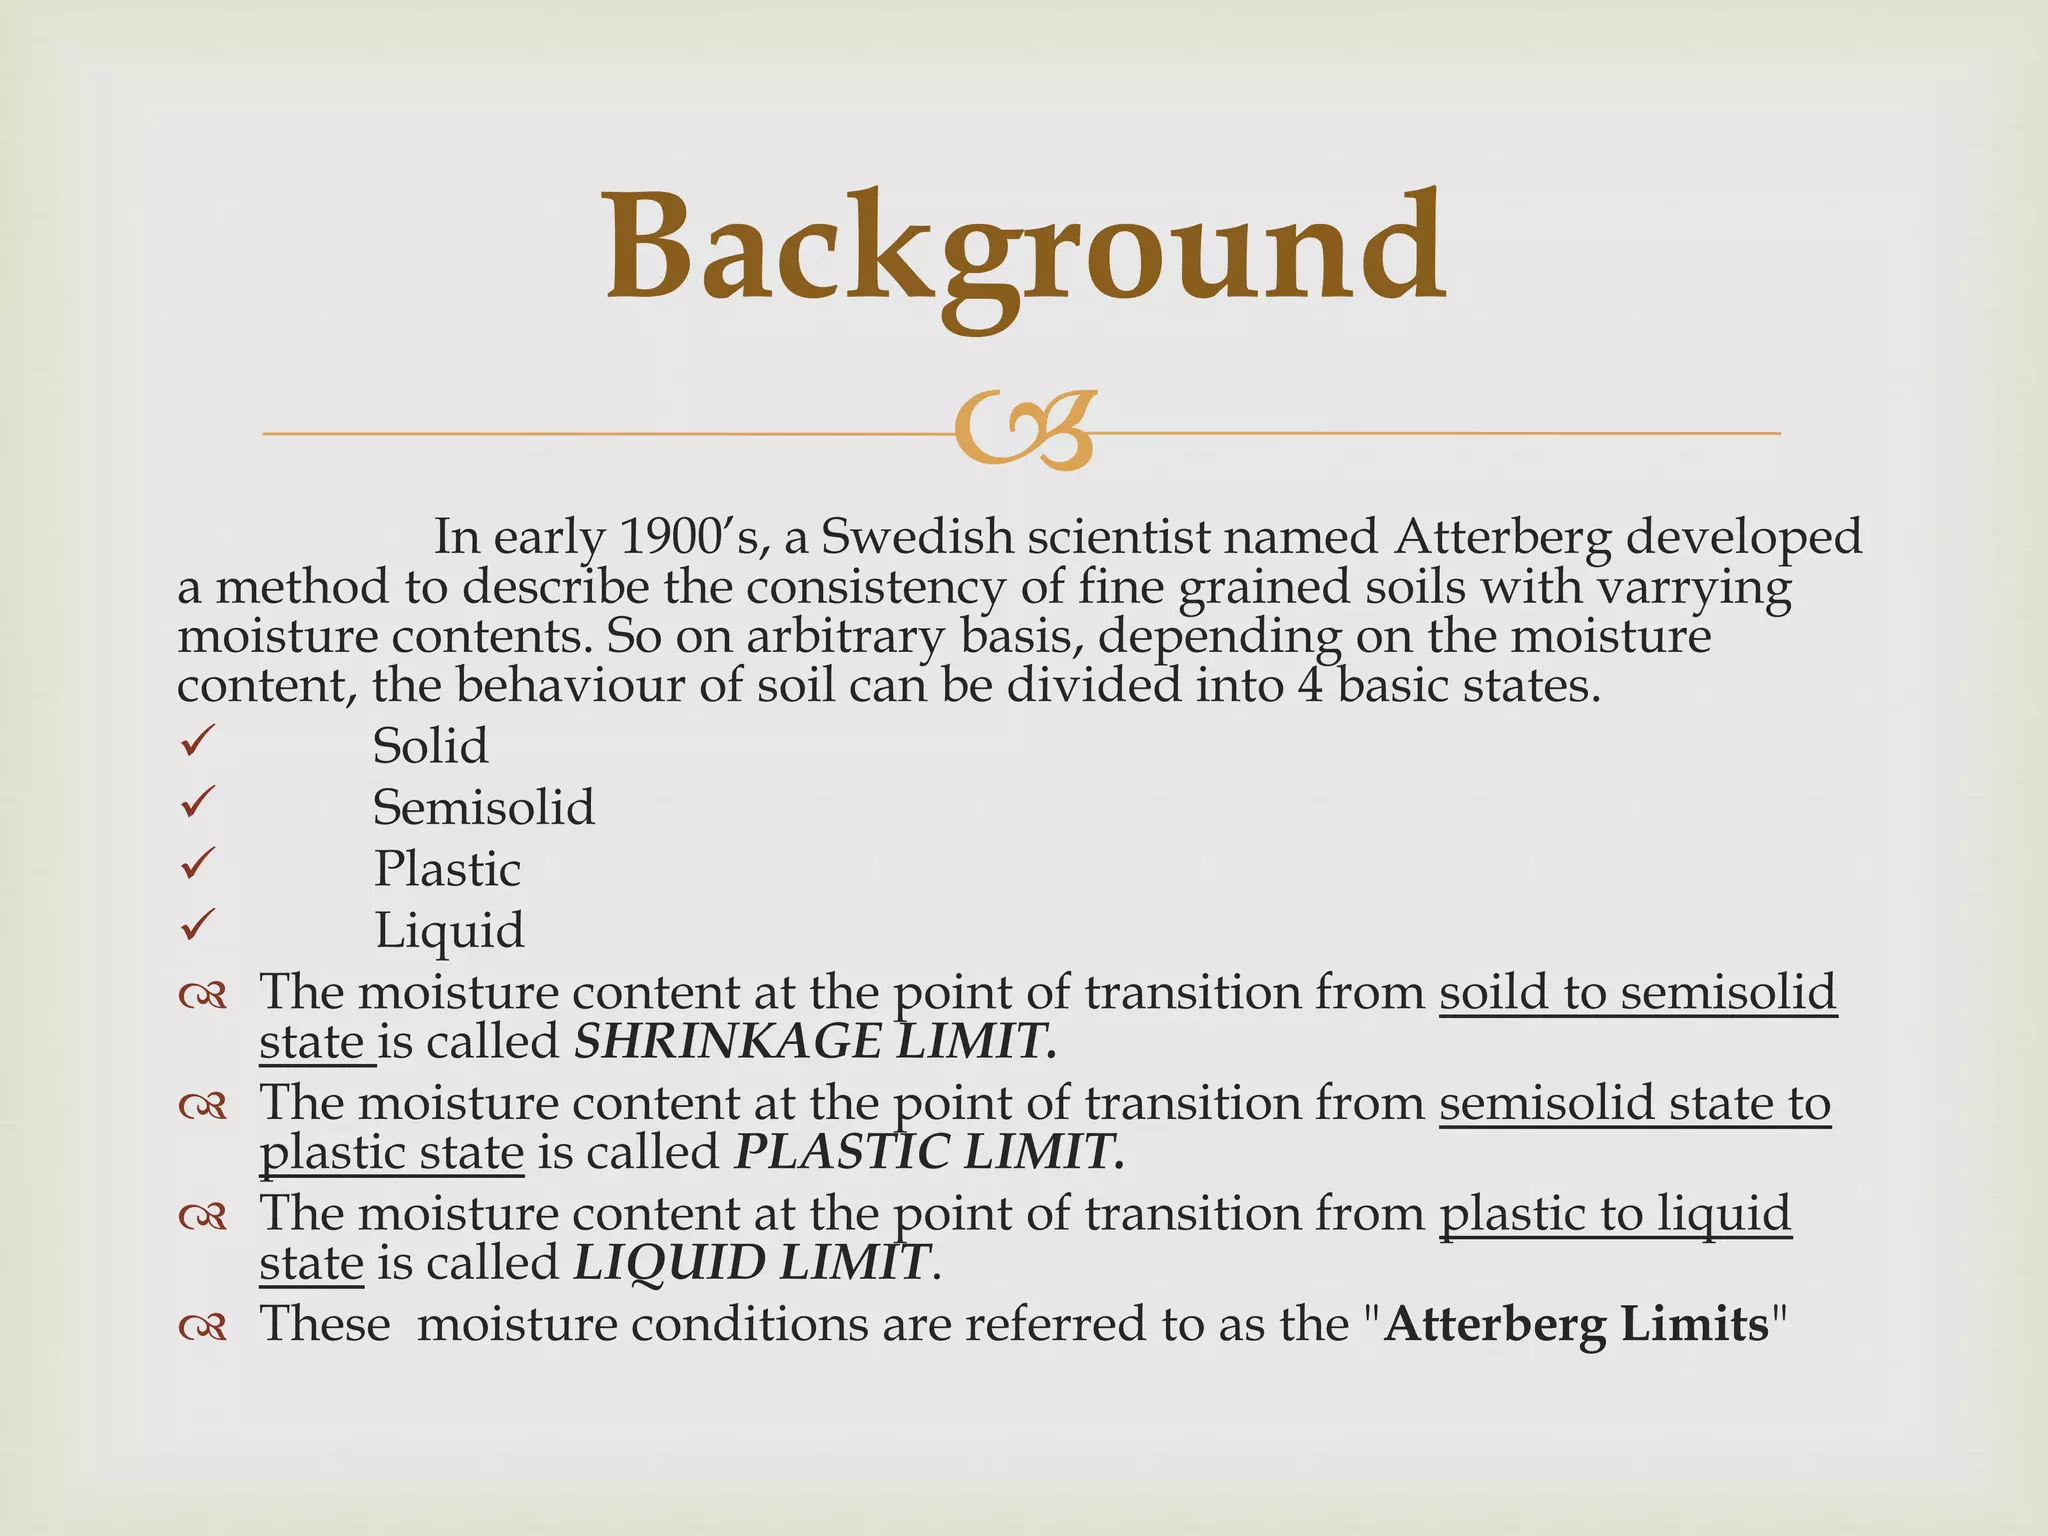
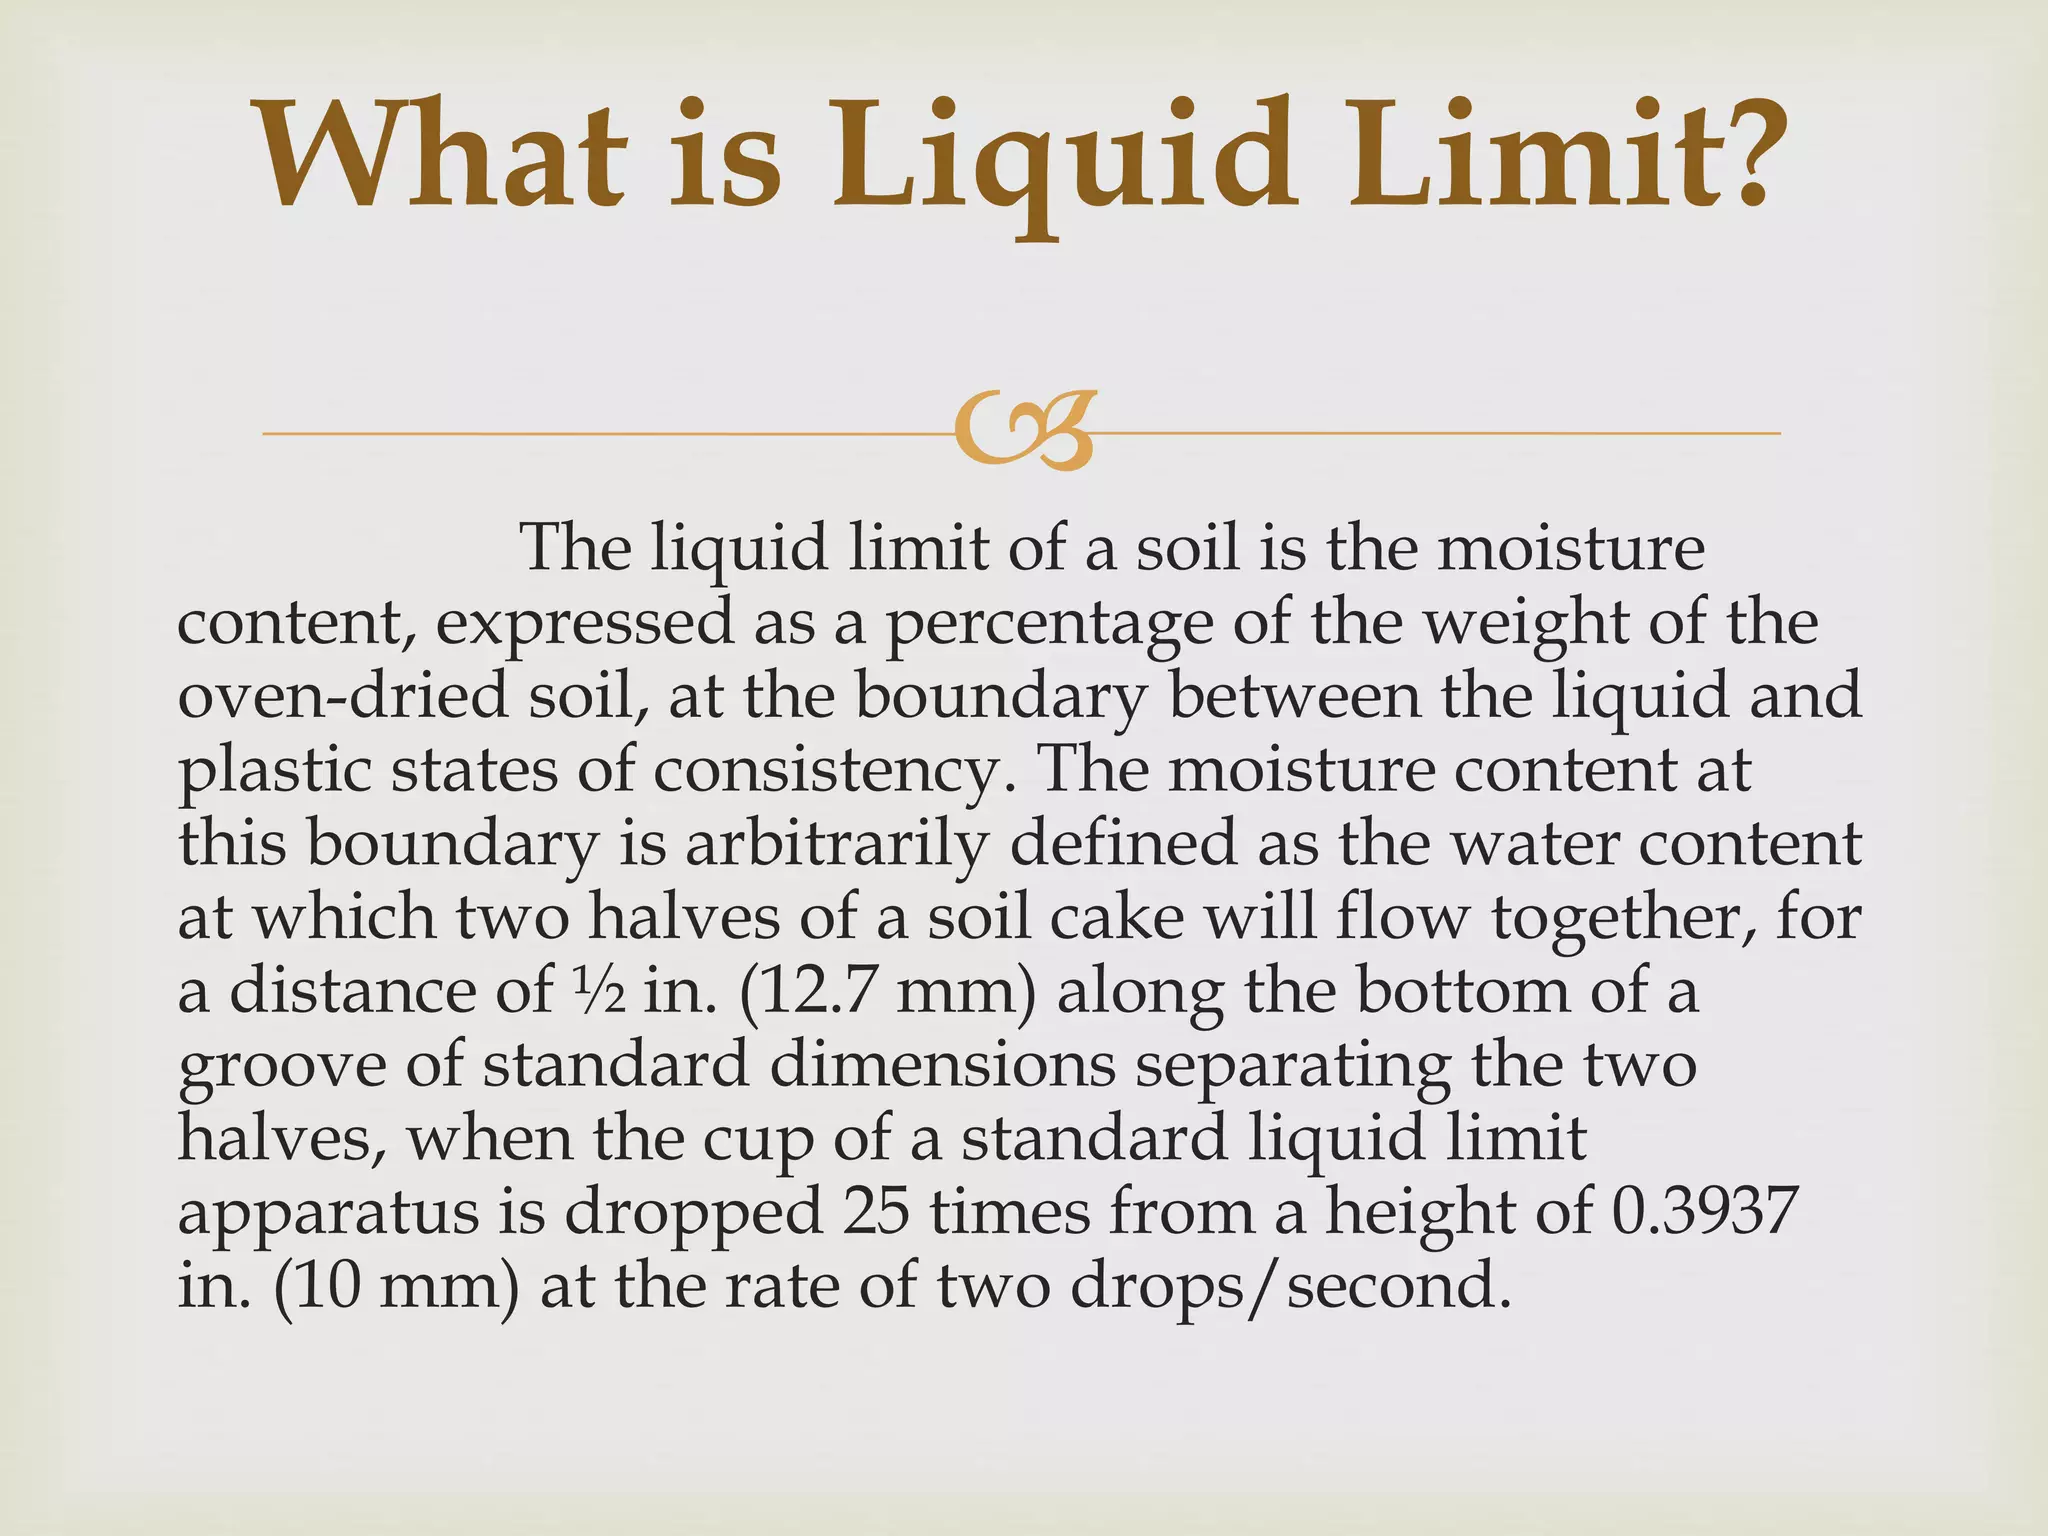
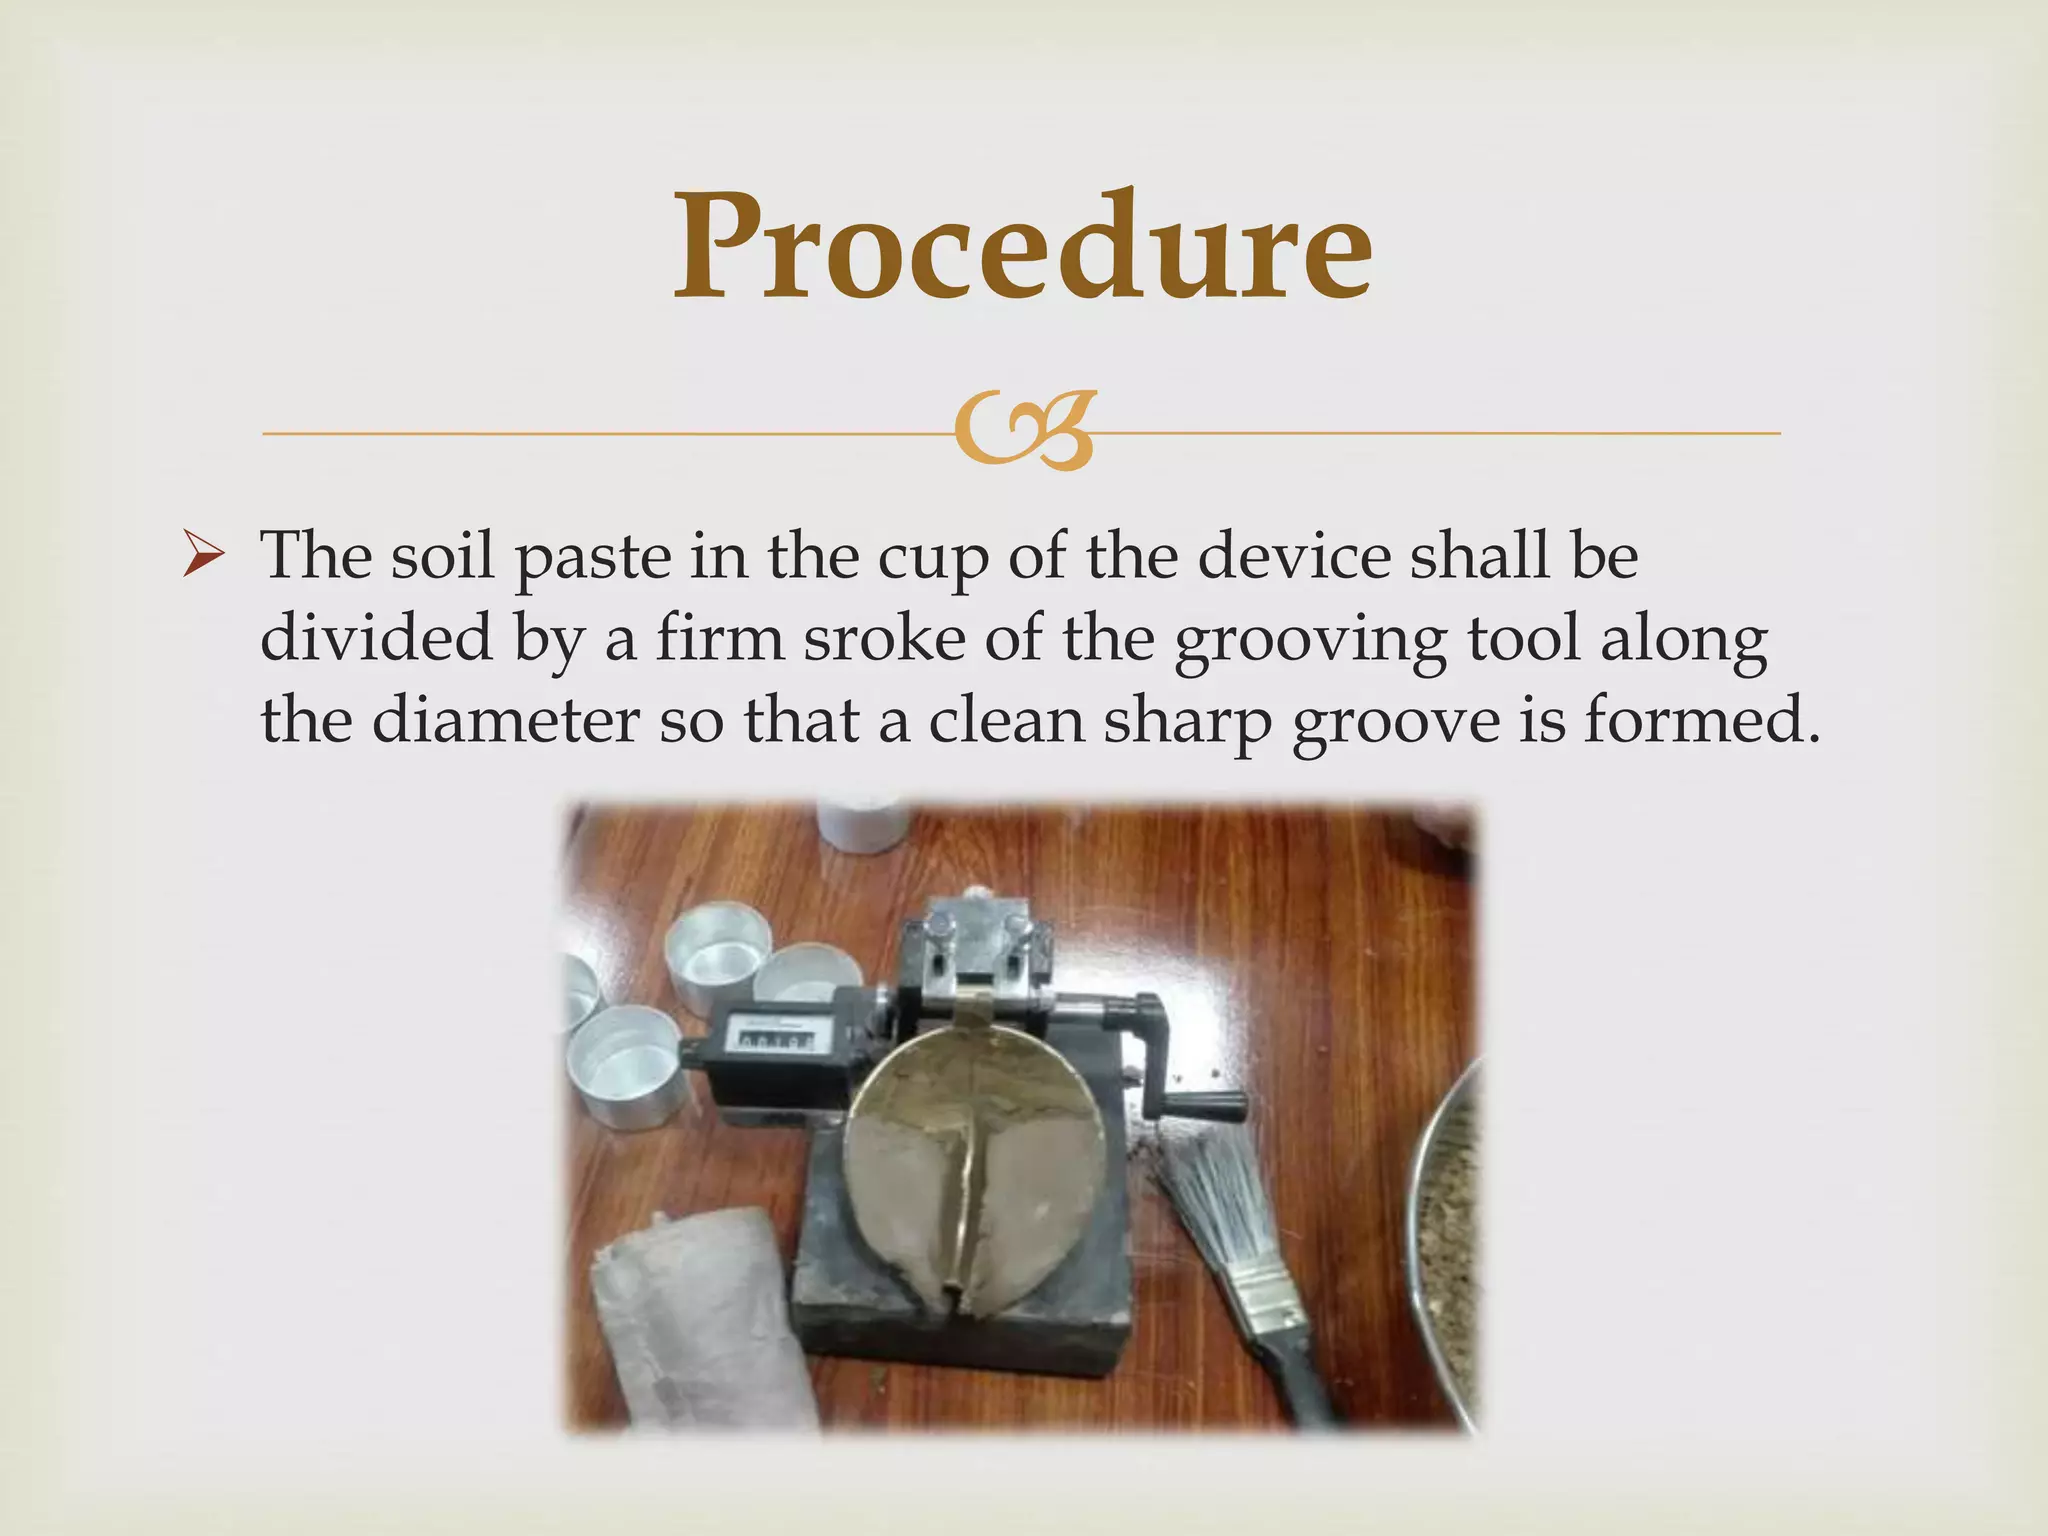
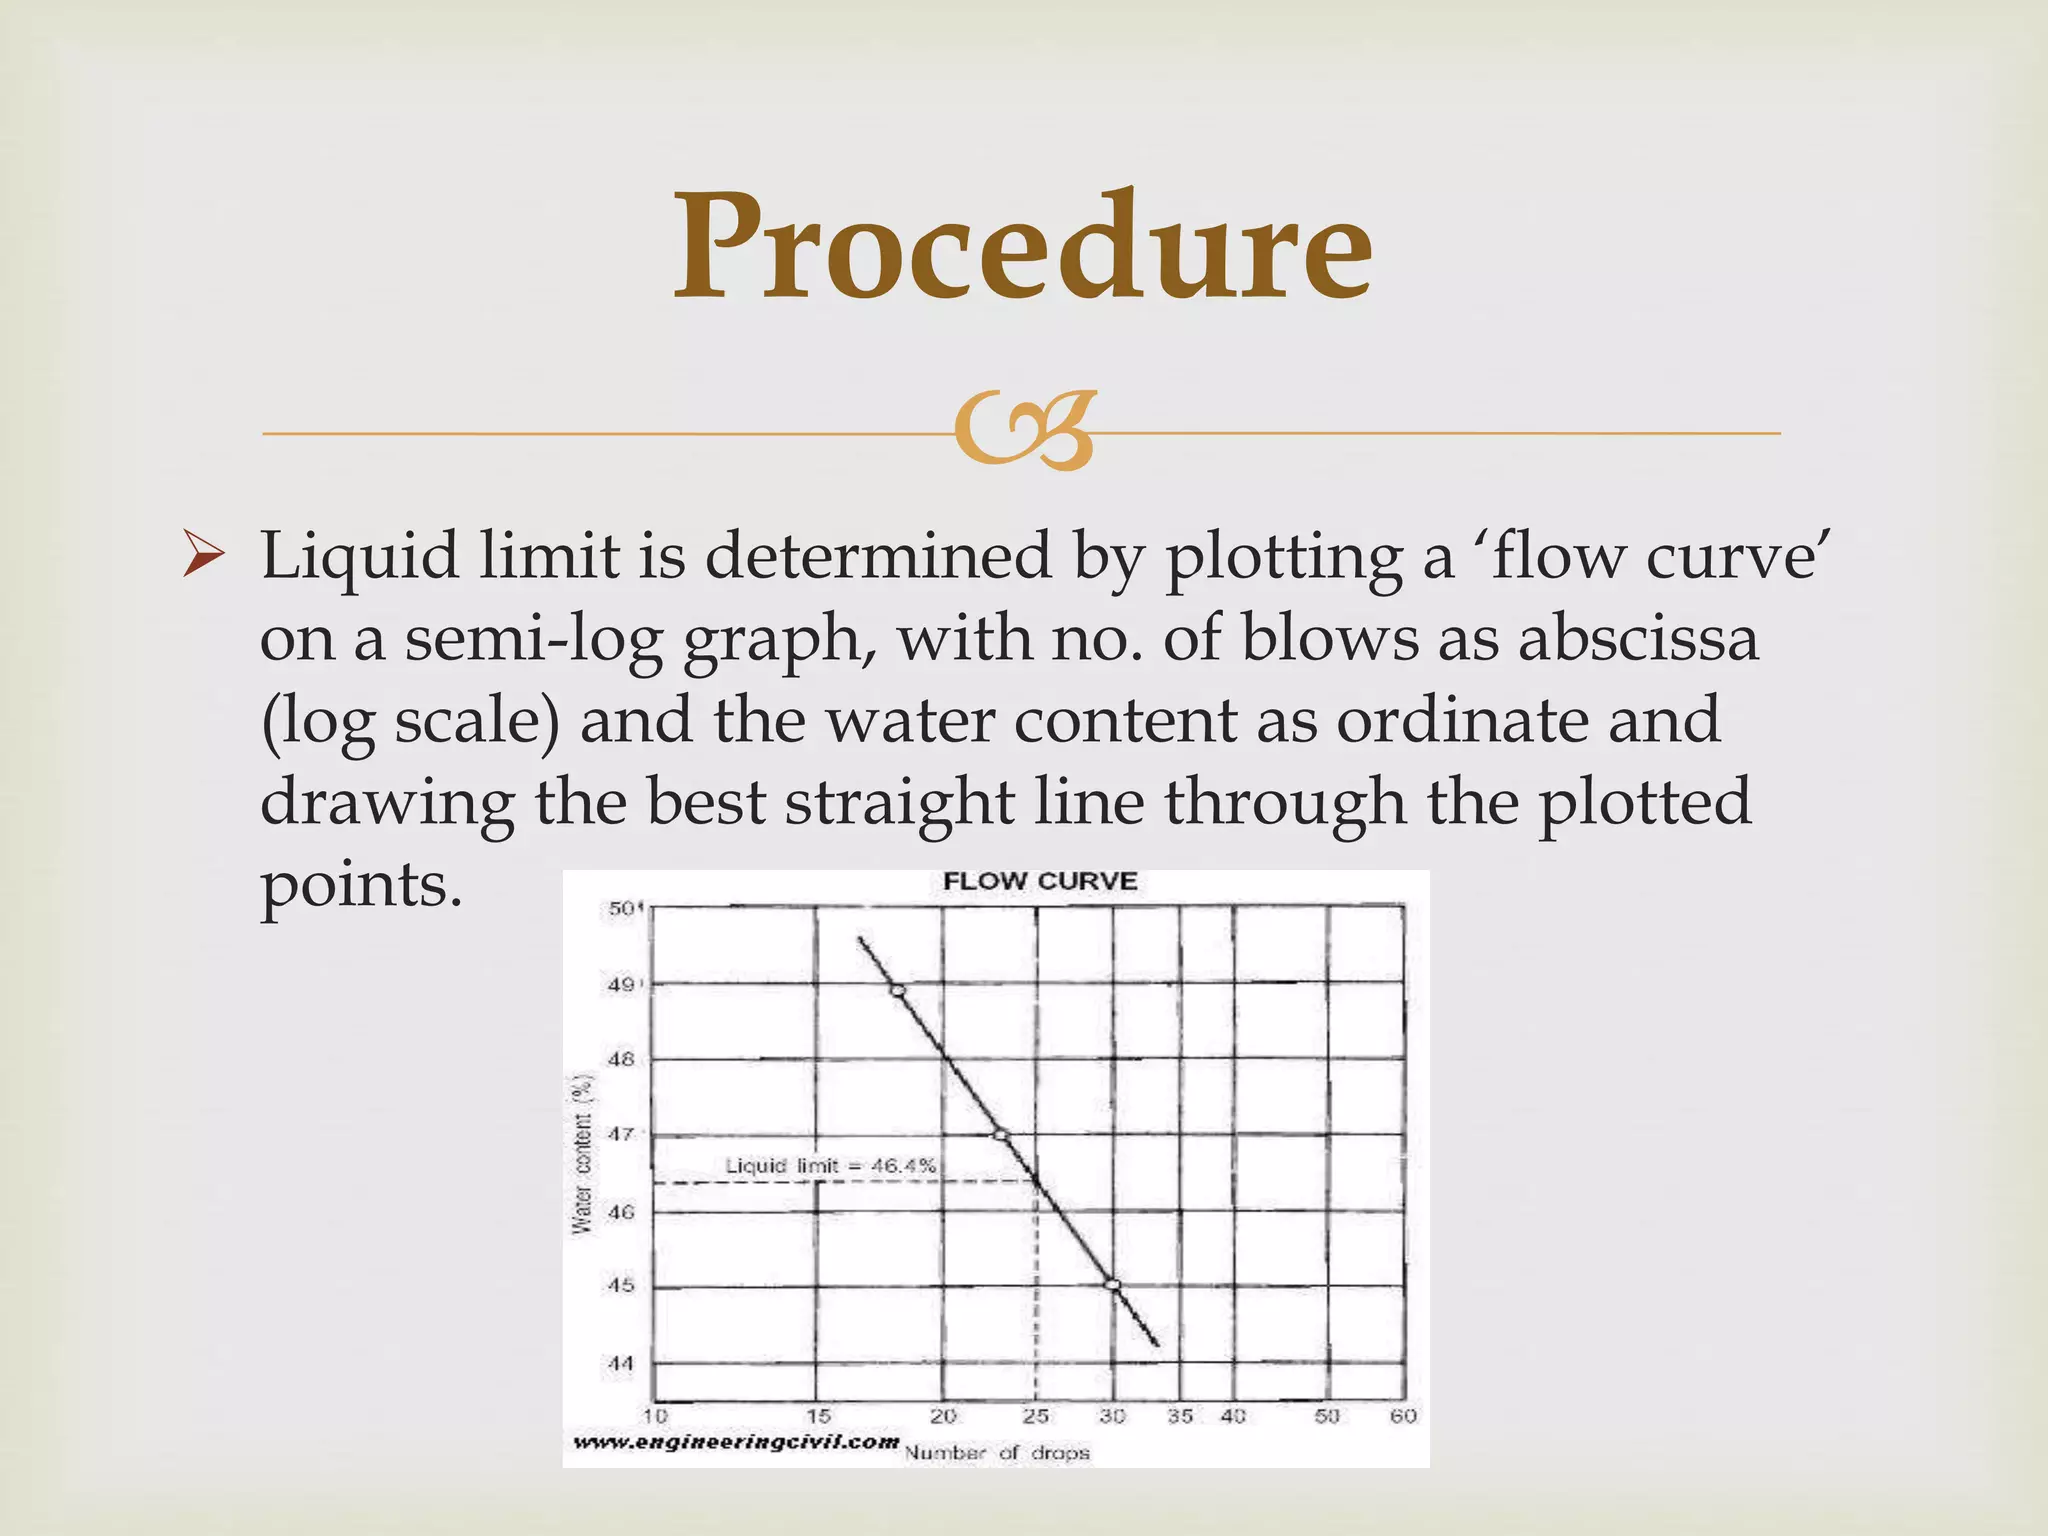
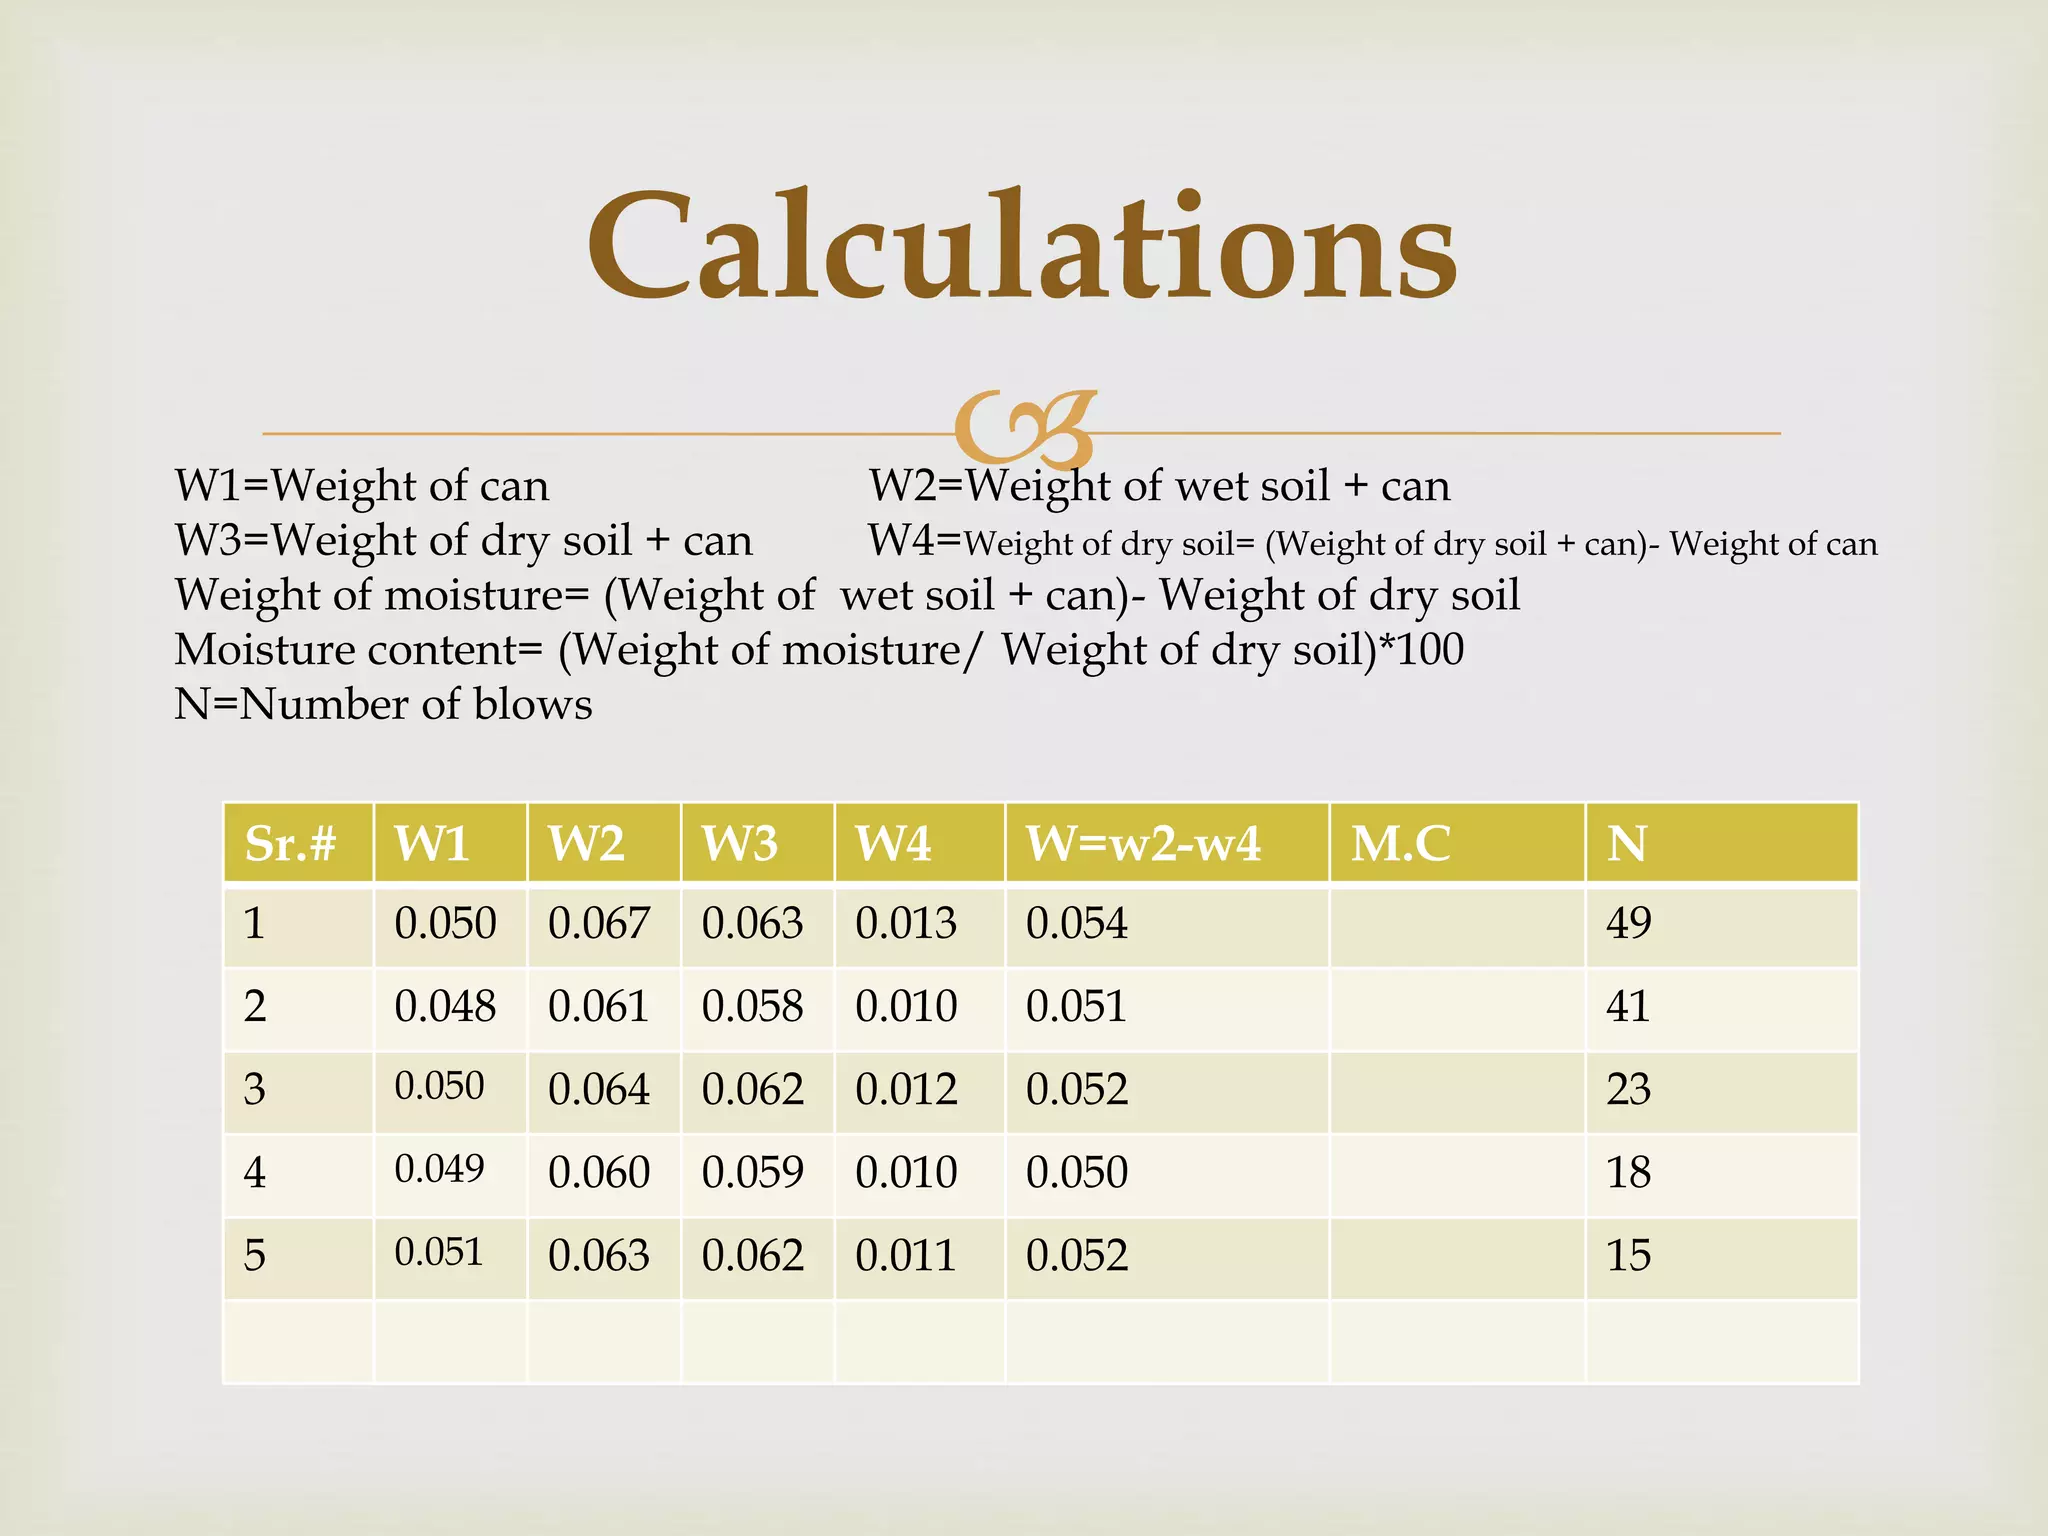
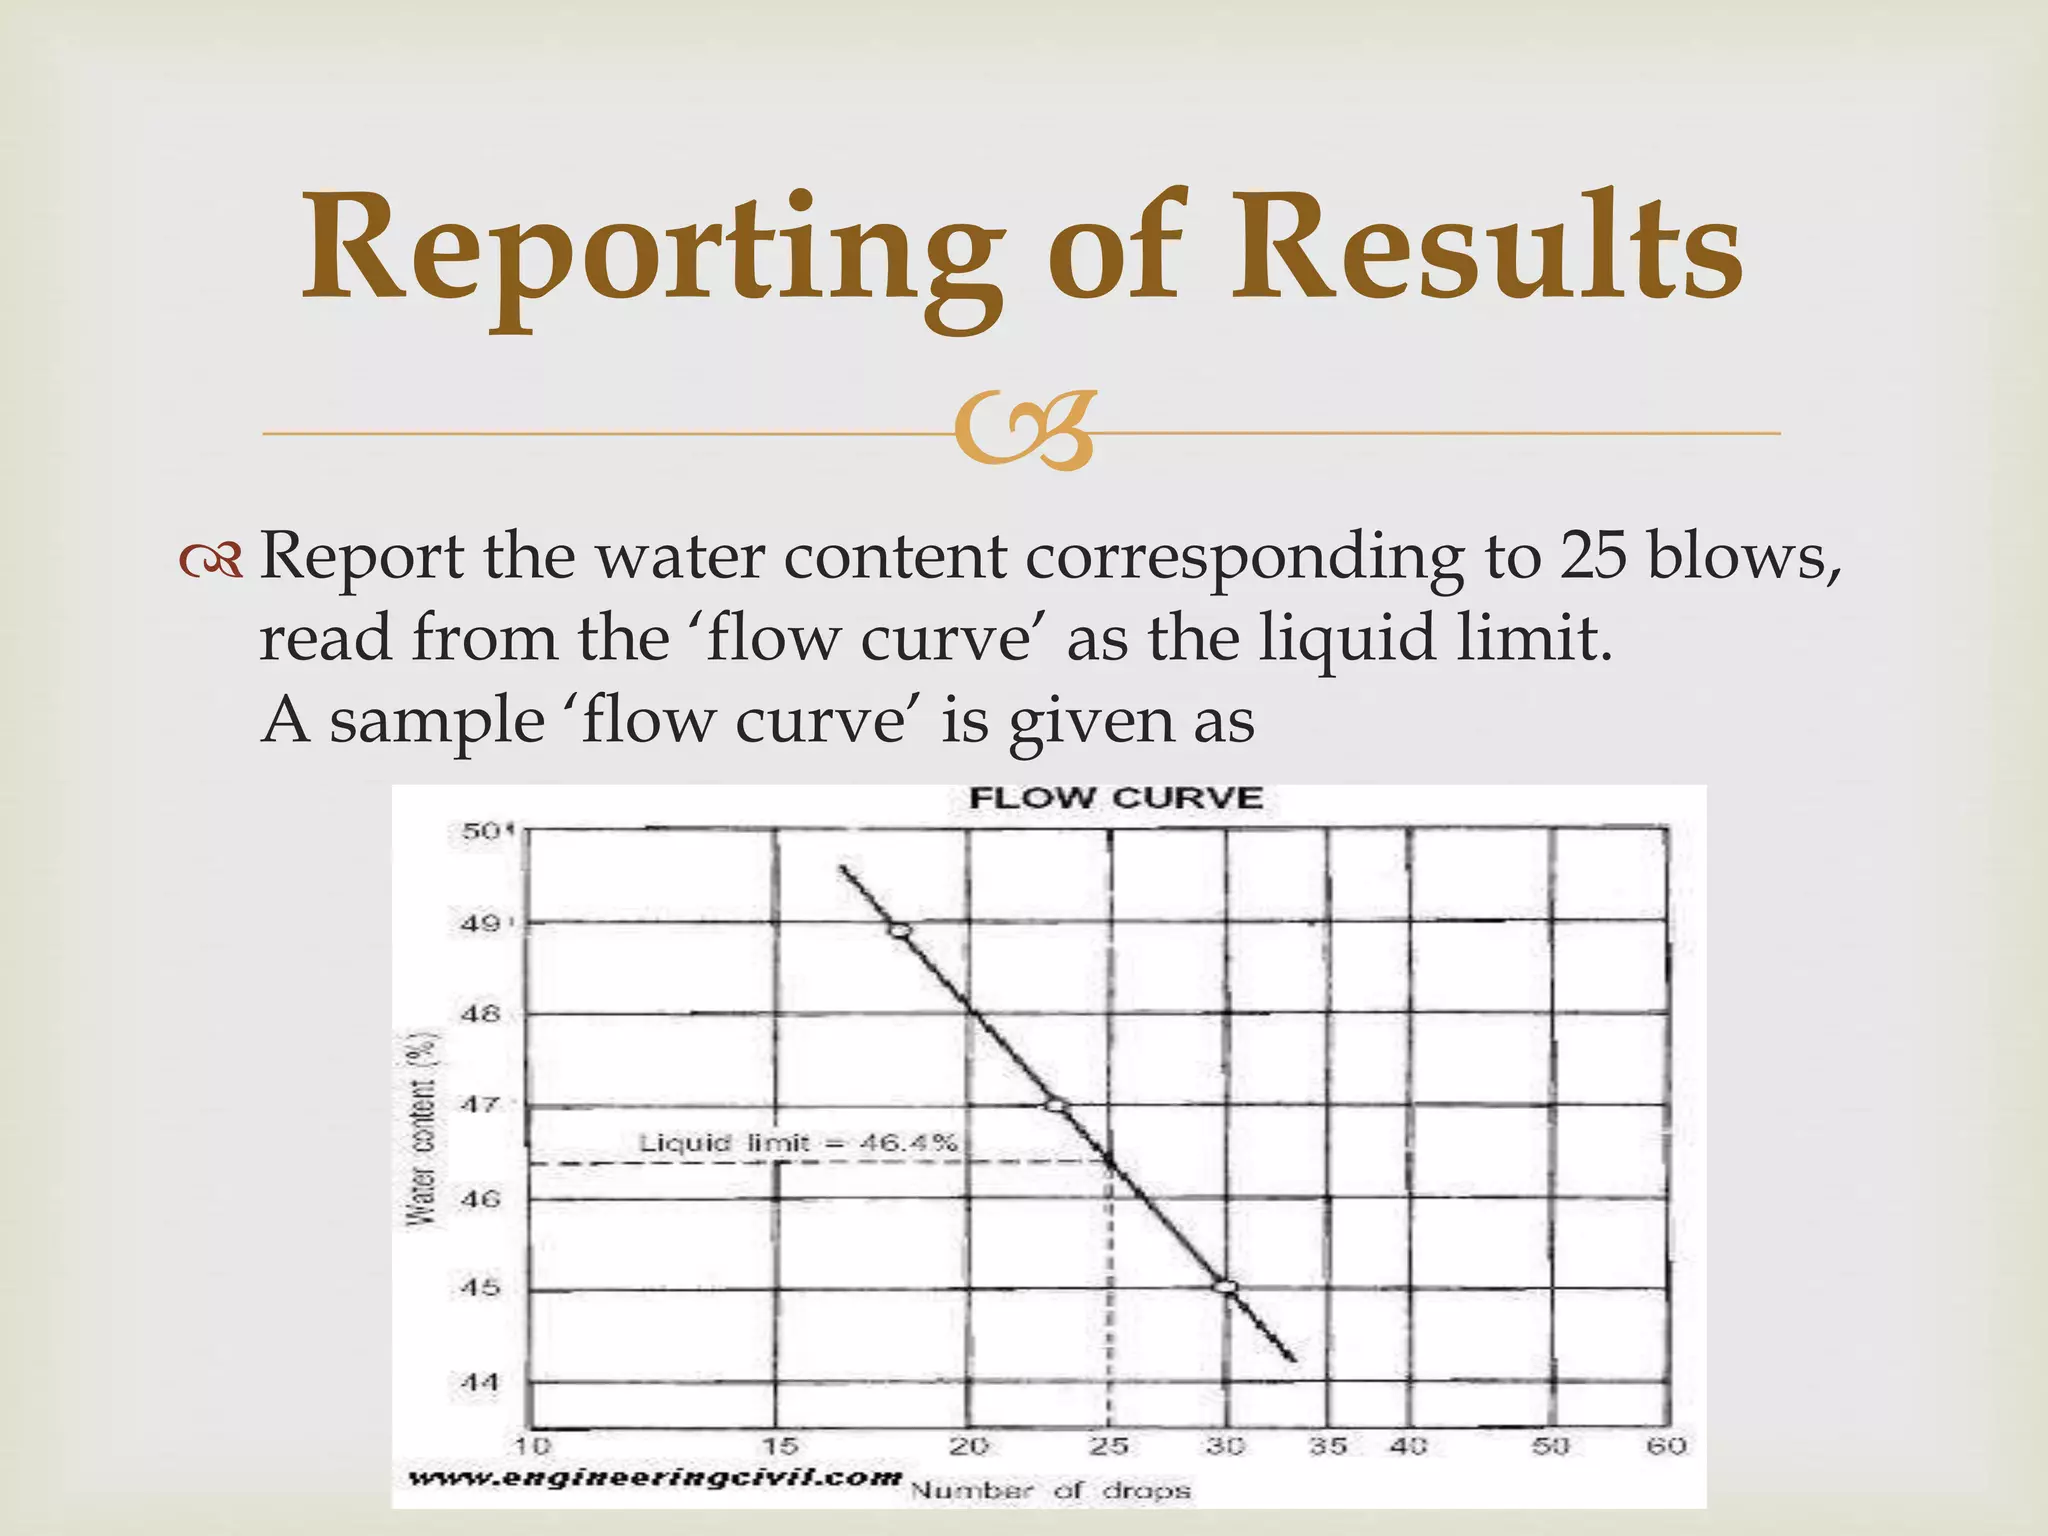
Determination of Liquid Limit of Soil : Civil Engineering
1. Faculty of Engineering & Technology
Department of Civil Engineering
Semester 4th
Subject: Geotechnical Engineering
2. Submitted to : Dr Muneeb
Group No. 1
Registraion No.s
82-FET/BSCE/F16
83-FET/BSCE/F16
84-FET/BSCE/F16
85-FET/BSCE/F16
86-FET/BSCE/F16
3.
In early 1900’s, a Swedish scientist named Atterberg developed
a method to describe the consistency of fine grained soils with varrying
moisture contents. So on arbitrary basis, depending on the moisture
content, the behaviour of soil can be divided into 4 basic states.
Solid
Semisolid
Plastic
Liquid
The moisture content at the point of transition from soild to semisolid
state is called SHRINKAGE LIMIT.
The moisture content at the point of transition from semisolid state to
plastic state is called PLASTIC LIMIT.
The moisture content at the point of transition from plastic to liquid
state is called LIQUID LIMIT.
These moisture conditions are referred to as the "Atterberg Limits"
Background
4.
The liquid limit of a soil is the moisture
content, expressed as a percentage of the weight of the
oven-dried soil, at the boundary between the liquid and
plastic states of consistency. The moisture content at
this boundary is arbitrarily defined as the water content
at which two halves of a soil cake will flow together, for
a distance of ½ in. (12.7 mm) along the bottom of a
groove of standard dimensions separating the two
halves, when the cup of a standard liquid limit
apparatus is dropped 25 times from a height of 0.3937
in. (10 mm) at the rate of two drops/second.
What is Liquid Limit?
5.
Prepare soil specimen as per specification.
Find the relationship between water content and
number of blows.
Draw flow curve.
Find out liquid limit.
Objective
6.
Liquid limit is significant to know the stress history
and general properties of the soil met with
construction.
From the results of liquid limit the compression
index may be estimated. The compression index
value will help us in settlement analysis.
If the natural moisture content of soil is closer to
liquid limit, the soil can be considered as soft.
if the moisture content is lesser than liquid limit.
The soil is brittle and stiffer.
Aim and Scope
10.
Apparatus
Containers for moisture
content determination
Watering bottle, with
distilled, demineralized
or tap water
11.
Check and adjust the height of drop of cup of the
casagrande apparatus equal to 10±0.2 mm.
Take a sample of about 100g from thoroughly mixed
portion of the material passing the seive No. 40.
Further addition of water shall be made in
increments of 1 to 3 ml.
Procedure
12.
When sufficient water has been thoroughly mixed with the soil
to form a uniform paste of stiff consistency, a sufficient quantity
of this paste shall be placed in the cup and spread with the
spatula so that the depth of the paste in the middle of the cup
(the point of maximum thickness) is equal to 10mm.
Procedure
13.
The excess soil paste shall be returned to the mixing
dish and covered to retain the moisture in the
sample.
Procedure
14.
The soil paste in the cup of the device shall be
divided by a firm sroke of the grooving tool along
the diameter so that a clean sharp groove is formed.
Procedure
15.
The cup containing the sample prepared shall be lifted and
dropped by turning the lever at a rate of approximately two
revolutions per second until the two sides of the sample cpme
in contact at the bottom of groove along a distance of about 13
mm.
Procedure
16.
The number of shocks or blows required to close the
groove shall be recorded.
Procedure
17.
Take a sanple to determine the moisture content.
The remaining soil in the cup shall be transferred to
the mixing dish.The cup and the grooving tool shall
then be washed and dried for preparation of the next
trial.
Repeat the procedue for at least 4 times and record
the number of blows and the corresponding
moisture content in each case.
Procedure
18.
Liquid limit is determined by plotting a ‘flow curve’
on a semi-log graph, with no. of blows as abscissa
(log scale) and the water content as ordinate and
drawing the best straight line through the plotted
points.
Procedure
19.
Sr.# W1 W2 W3 W4 W=w2-w4 M.C N
1 0.050 0.067 0.063 0.013 0.054 49
2 0.048 0.061 0.058 0.010 0.051 41
3 0.050 0.064 0.062 0.012 0.052 23
4 0.049 0.060 0.059 0.010 0.050 18
5 0.051 0.063 0.062 0.011 0.052 15
Calculations
W1=Weight of can W2=Weight of wet soil + can
W3=Weight of dry soil + can W4=Weight of dry soil= (Weight of dry soil + can)- Weight of can
Weight of moisture= (Weight of wet soil + can)- Weight of dry soil
Moisture content= (Weight of moisture/ Weight of dry soil)*100
N=Number of blows
20.
Report the water content corresponding to 25 blows,
read from the ‘flow curve’ as the liquid limit.
A sample ‘flow curve’ is given as
Reporting of Results
Laboratory data is used to construct a plot of strain or void ratio versus effective stress where the effective stress axis is on a logarithmic scale. The plot's slope is the compression index or recompression index.