RESEARCH QUESTIONS FROM
PRACTICALRESEARCH OUTPUTS
SAMPLE OUTPUTS:
ISTHERE A SIGNIFICANT DIFFERENCE ONTHE
RESPONDENTS’ PERCEIVED STRESS LEVELWHEN
GROUPED ACCORDINGTO SEX?
ISTHERE A SIGNIFICANT DIFFERENCE BETWEEN MALES
AND FEMALES INTERMS OF SOCIAL MEDIA ADDICTION?
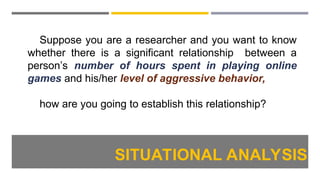
Suppose you area researcher and you want to know
whether there is a significant relationship between a
person’s number of hours spent in playing online
games and his/her level of aggressive behavior,
how are you going to establish this relationship?
SITUATIONAL ANALYSIS
ATTHE END OFTHELESSON, IWOULD BE ABLETO:
1. DIFFERENTIATE UNIVARIATE AND BIVARIATE DATA
2. IDENTIFY DEPENDENT AND INDEPENDENTVARIABLES
3. CONSTRUCT A SCATTER PLOT
4. ESTIMATE STRENGTH OF ASSOCIATION BETWEENTHE
VARIABLES BASED ON A SCATTER PLOT
5. CALCULATETHE PEARSON’S SAMPLE CORRELATION
COEFFICIENT
6. SOLVE PROBLEMS INVOLVING CORRELATION ANALYSIS
9.
NATURE OF BIVARIATEDATA
o Univariate data – a study that involves only one
variable
Ex: Investigating the average speed of 30 cars
o Bivariate data – a study that examines the relationship
between two variables.
Ex: Relationship between the performances in Statistics and
Probability and General Mathematics of the senior high school
10.
DEPENDENT AND INDEPENDENTVARIABLES
o Independent Variable– a standalone variable, which means that
its value can change without reference to another variable.
o Dependent Variable – a variable that changes as a result of the
change in the independent variable.
Example:
An educational researcher tests the effects of using a
particular teaching strategy on the performance in mathematics of
college students.
11.
DEPENDENT AND INDEPENDENTVARIABLES
Identify the independent and dependent variables in the following
situations.
1. A college professor studies how attitude affects the
math performance of engineering students.
2. The principal wants to determine on how age correlates to the
attention span of the students.
SCATTER PLOT
o showsthe relationship of the variable in a bivariate
data
o it consists of a series of points plotted on a
rectangular coordinate plane
• x-axis (independent variable)
• y-axis (dependent variable)
14.
CONSTRUCTING A SCATTERPLOT
Example 1:
Construct a scatter plot for the
given data.
x 10 14 19 23 28
y 34 65 81 115 124
y
x
0 7 14 21 28 35
0
30
60
90
120
150
SCATTER PLOT
Example 2
Thetable shows the time in hours spent by
five students in playing computer games and
scores these students got on a Math test.
Construct and interpret the scatter plot for the
given data.
Time(x) 1 2 3 4 5
Score (y) 25 20 15 10 5
y
x
0 1 2 3 4 5
0
5
10
15
20
25
Interpretation:
The scatter plot represents a perfect negative
correlation since, as the amount of time spent in
paying computer game increases, the score in Math
test decreases.
23.
SCATTER PLOT
Example 3
Thetable shows the number of selfies
posted online by students and scores sthey
obtained from a Science test. Construct and
interpret the scatter plot for the given data.
Number of
Selfies (x)
1 3 5 7 9
Score (y) 25 5 50 35 15
Interpretation:
The scatter plot shows no pattern. Thus, it can
be said that there is no correlation between the
number of selfies posted online and the scores
obtained from a Science test.
y
x
0 1 3 5 7 9
0
10
20
30
40
50
2 4 6 8
PEARSON PRODUCT MOMENTCORRELATION COEFFICIENT
o also called as Pearson’s r, in honor of the
English mathematician Karl Pearson who
developed the formula in the 1880s.
o a statistical tool that determines the existence,
strength, and direction between two variables.
FORTHE INTERPRETATION OFTHERESULT:
Pearson r Qualitative Interpretation
+ 1 Perfect
+0.80 – +0.99 Very High
+0.60 – +0.79 Moderately High
+0.40 – +0.59 High
+0.20 – +0.39 Moderately Low
+0.01 – +0.19 Very Low
0 No Correlation
28.
EXAMPLE 1
JM, aneducational researcher at a science high school, wants to know
whether a student’s physics grade depends on his math grade. He collects a
sample of 5 students and gathered their grades in math and science. The math
and science grade of the students are five in the table below:
Can JM conclude a strong positive relationship between the math and
physics grades?
Math Grade
(x)
76 82 87 92 95
Physics Grade
(y)
75 83 88 89 93
EXAMPLE 2
The tableshows the time in hours spent by five students in
playing computer games and scores of these students got on a
Math test. Solve for the Pearson’s r and describe the result.
Time(x) 1 2 3 4 5
Score (y) 25 20 15 10 5
EXAMPLE 3
Loida studiesif age correlates with the average number of hours of sleep,
so she selected a random sample size 6 and surveyed the needed data. The
gathered data are given below. Can Loida conclude a strong positive
relationship between a person’s age and the number of hours he or she
sleeps?
Age(x) 8 15 22 27 34 40
Sleep (y) 8 8 7 7 5 6
IWAS ABLE TO:
1.DIFFERENTIATE UNIVARIATE AND BIVARIATE DATA
2. IDENTIFY DEPENDENT AND INDEPENDENTVARIABLES
3. CONSTRUCT A SCATTER PLOT
4. ESTIMATE STRENGTH OF ASSOCIATION BETWEENTHE
VARIABLES BASED ON A SCATTER PLOT
5. CALCULATETHE PEARSON’S SAMPLE CORRELATION
COEFFICIENT
6. SOLVE PROBLEMS INVOLVING CORRELATION ANALYSIS
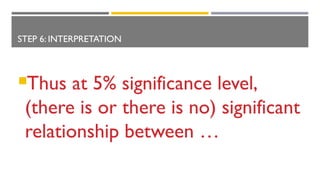
STEP 6: INTERPRETATION
Thusat 5% significance level,
(there is or there is no) significant
relationship between …
44.
NOTE
If there isno significant relationship, end of
solution
If there is a significant relationship, you can
predict the value of y given x (REGRESSION
ANALYSIS)
REGRESSION ANALYSIS ISONLY APPLICABLE IFTHERE IS A
SIGNIFICANT RELATIONSHIP BETWEEN X ANDY
• It gives the regression equation that enables
us to predict the value of the dependent (y)
variable given the value of the independent
(x) variable
YOU CAN USETHE FORMULA TO
PREDICT THE DEPENDENT (Y)
VARIABLE USING THE
INDEPENDENT (X)VARIABLE
50.
PAGE 315 ;# 5
SOLVE FOR R
TEST THE SIGNIFICANT
RELATIONSHIP
REGRESSION LINE
51.
QUESTION
Perform the stepsof Hypothesis Testing to test if
there is a significant difference between number of
hours spent on social media and a person’s happiness
index (scale from 1-10, 10 being the highest)
Ask at least 5 respondents
Editor's Notes
#16 -higher value of the independent variable corresponds to higher value of the dependent variable
#18 -there is no pattern showing the relationship of the two variables
#20 -higher value of the independent variable corresponds to a lower value of the dependent variable
#46 This is a statistical method that determines the nature of the relationship between the dependent and the independent variable