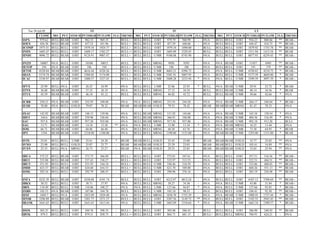
The document appears to be analyzing market indicators for various stock market indexes and commodities on July 28, 2009. It provides data on the close, momentum, position of stochastic indicators, and trend for each market. Most markets were labeled as bullish in the short-term, with some bearishness indicated in longer-term trends, such as the S&P 500, gold, and oil showing bearish momentum in the long-term.