

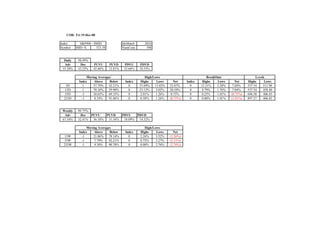
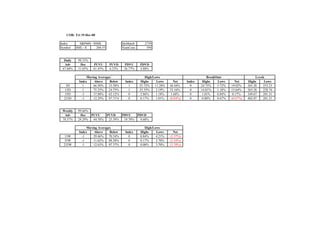
This document provides market index data and statistics for the S&P 100, Nasdaq 100, S&P 500, Russell 1000, Russell 2000, and Russell 3000 indexes as of Friday, December 19, 2008. It includes daily and weekly statistics on the percentage of advancing and declining issues and moving averages, as well as high/low and breakout data for each index.


