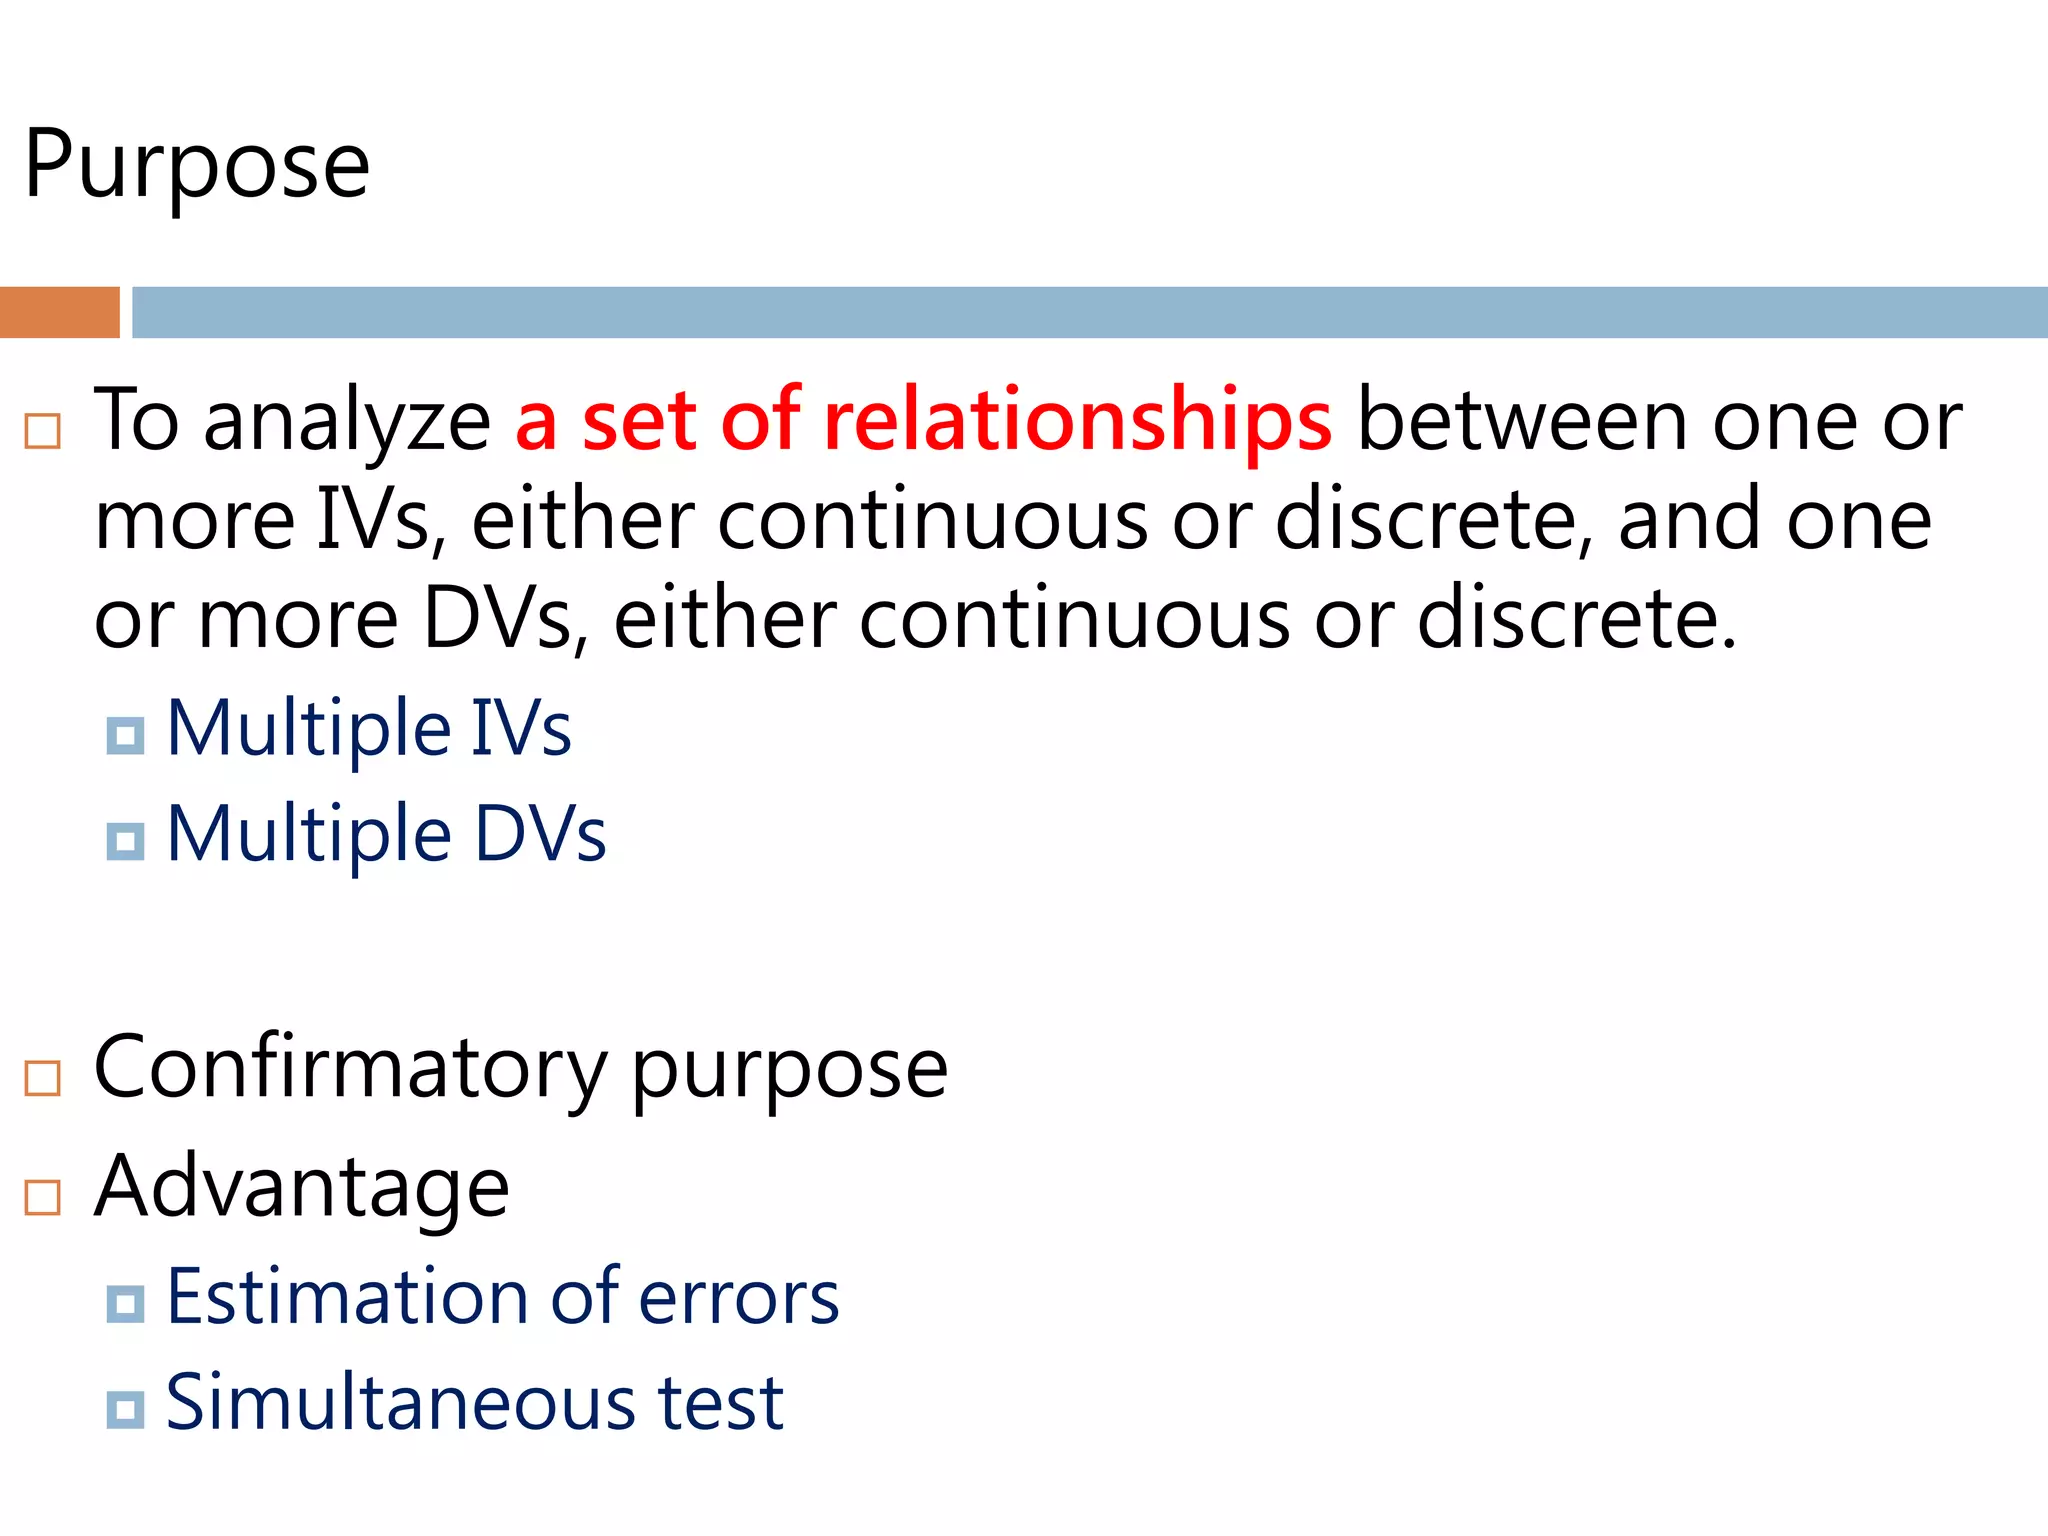
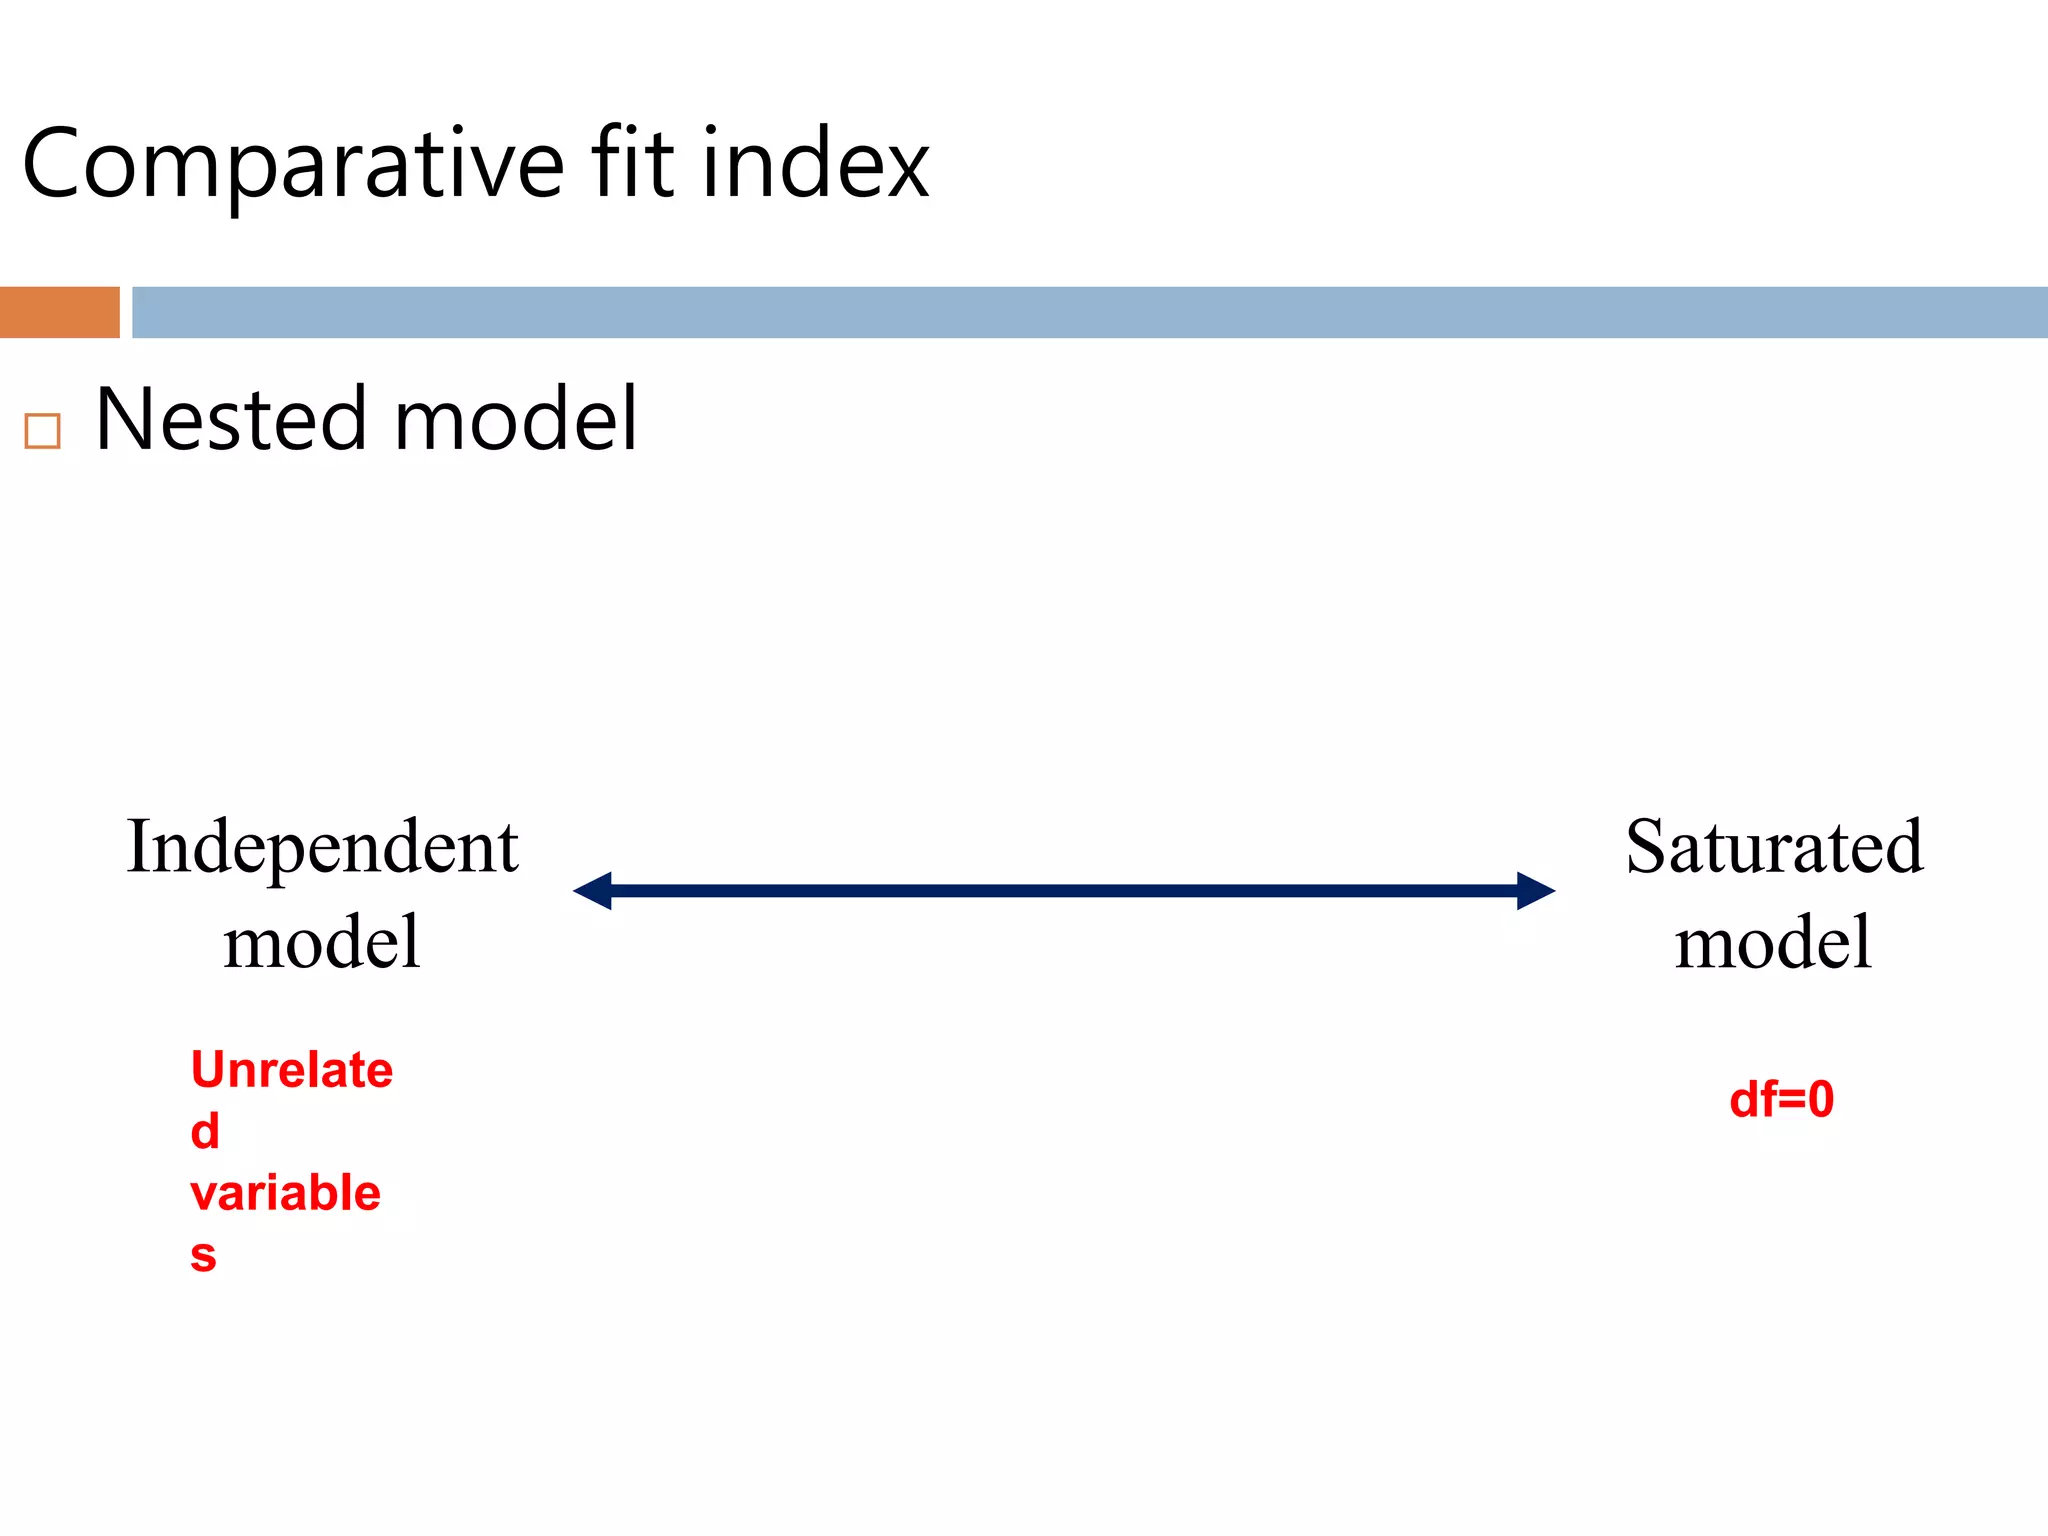
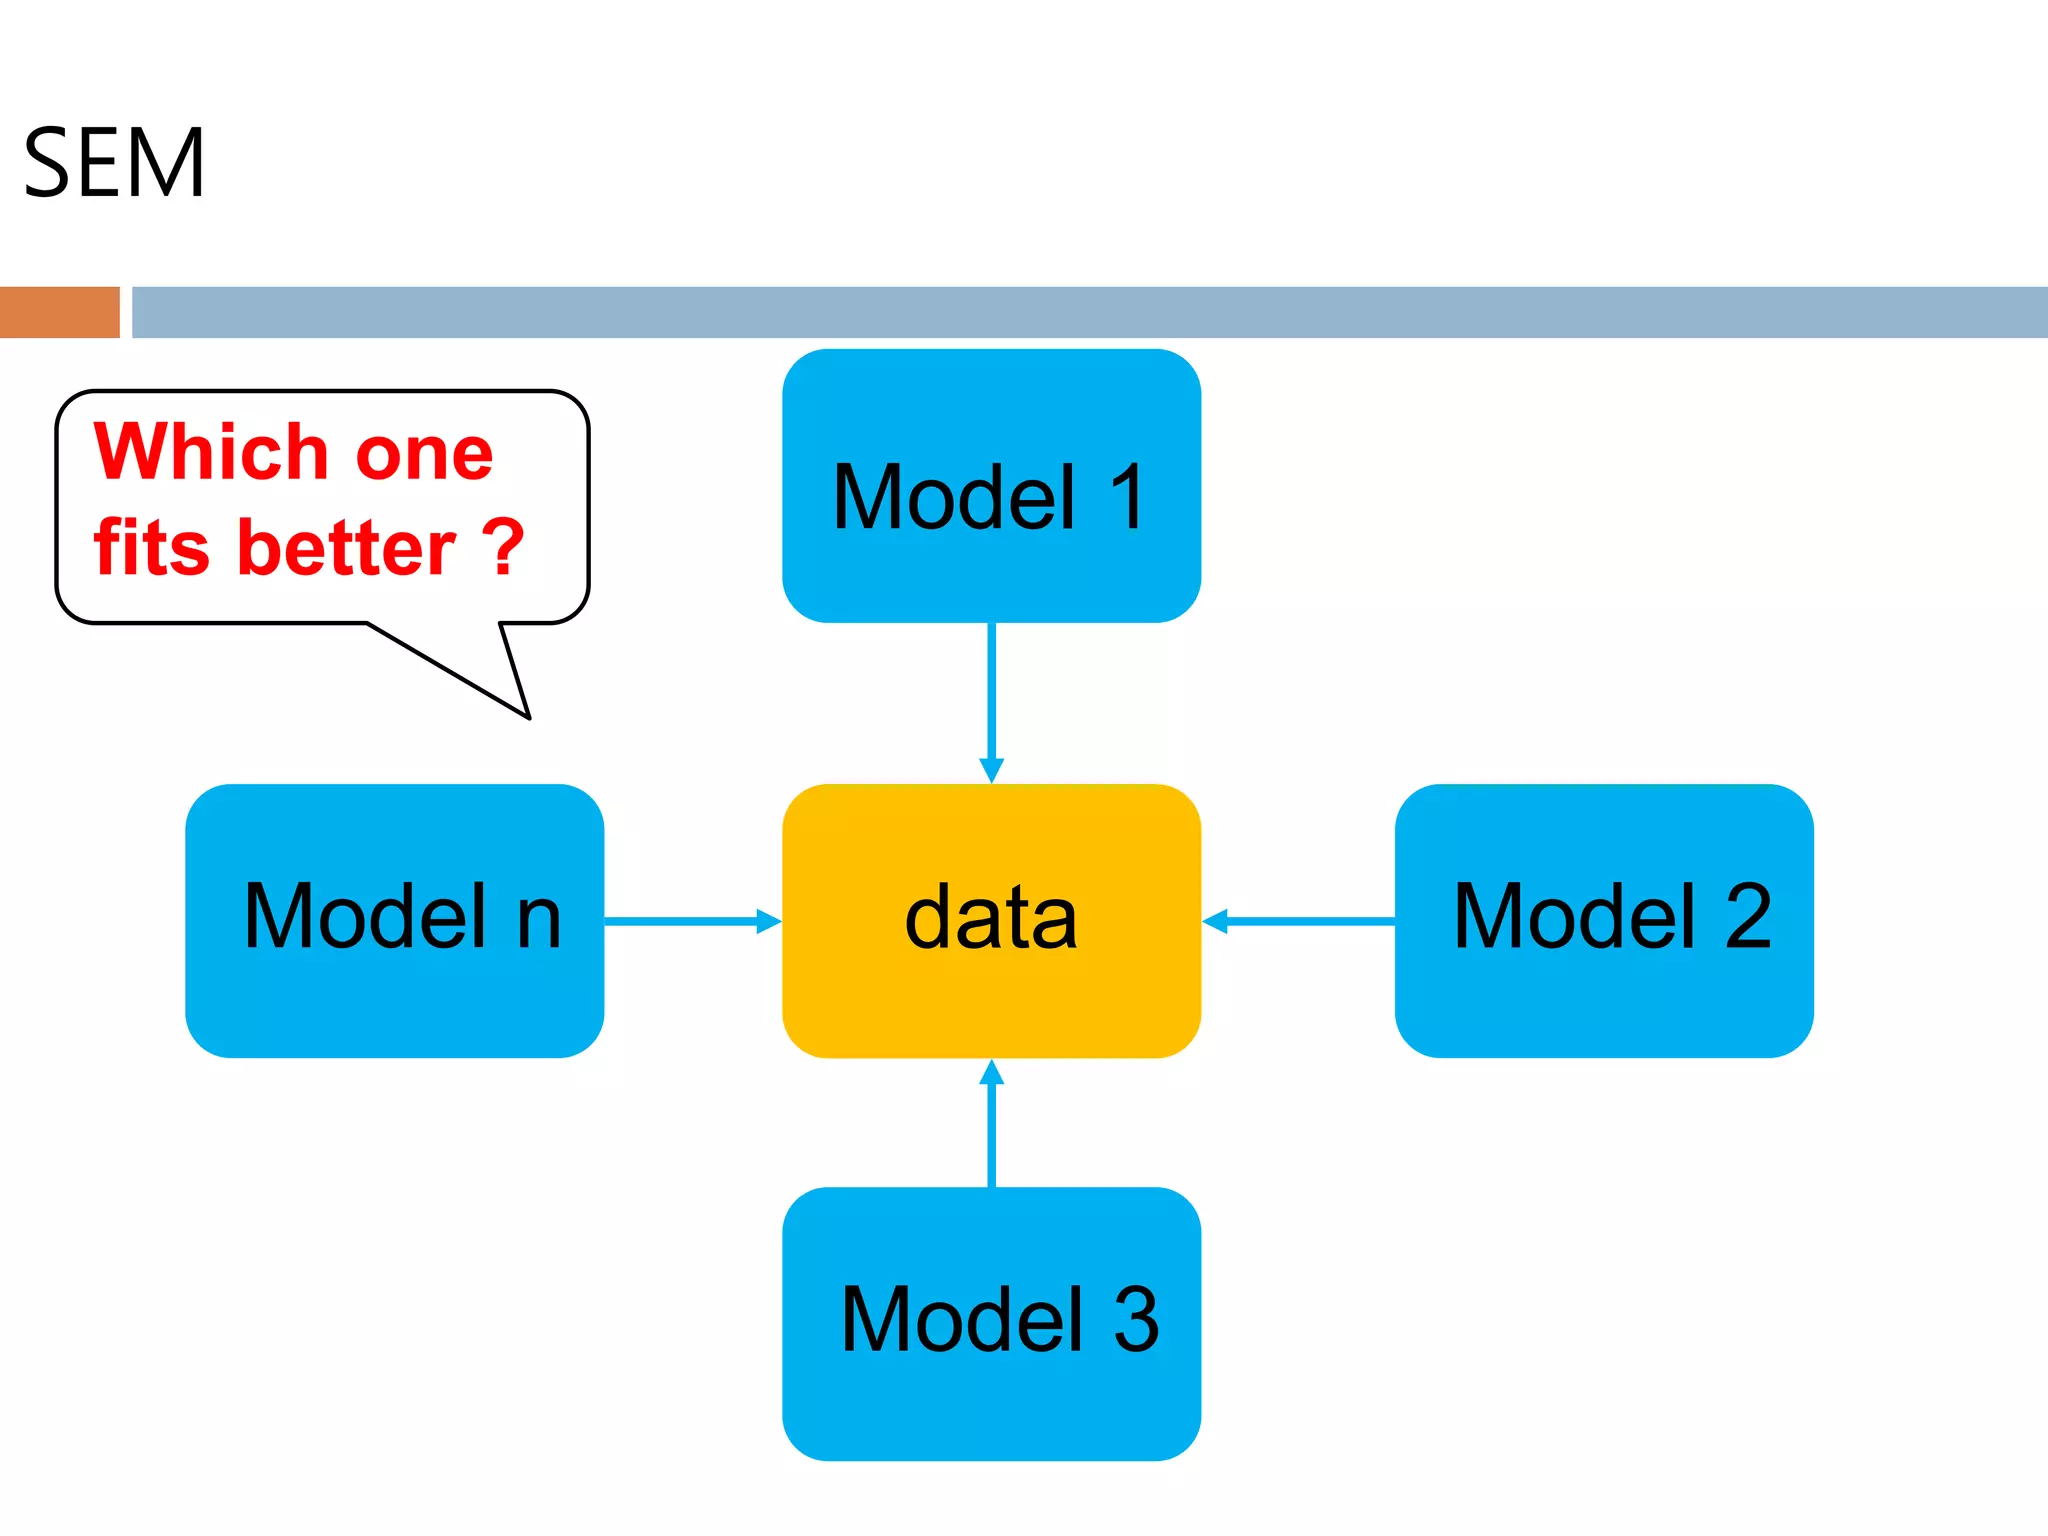
SlideShare a Scribd company logo
STRUCTURAL
EQUATIONS
MODELING (SEM)
Wei-Jiun, Shen Ph. D.
Purpose
 To analyze a set of relationships between one or
more IVs, either continuous or discrete, and one
or more DVs, either continuous or discrete.
 Multiple IVs
 Multiple DVs
 Confirmatory purpose
 Advantage
 Estimation of errors
 Simultaneous test
Kinds of research questions
 The goal of SEM is to examine whether the model
produce an estimated population covariance matrix
is fitted to the sample covariance matrix or not.
 Adequacy of model
 Testing theory
 Amount of variance in the variables accounted for by the
factors
 Reliability of the indicators
 Parameter estimates
 Intervening variables (indirect effect)
 Group difference
 Longitudinal difference
 Multilevel modeling
Limitations to factor analysis
 Theoretical issues
 Theory
 causality
 Practical issues
 Sample size and missing data
 15* umber of variable (Stevens, 1996)
 5* number of estimated parameter (Bentler & Chou, 1987)
 100 (Loehiln, 1992)
 Multivariate normality and outliers
 Linearity
 Absence of multicollinearity and singularity
 Residual
Fundamental equation for SEM
 Regression coefficients
 Variance-covariance matrices
 Data point
𝑌𝑗 = 𝛾𝑗𝑖 𝑋𝑖 + 𝜖1
𝐶𝑂𝑉 𝑋𝑖, 𝑌𝑗 = 𝐶𝑂𝑉(𝑋𝑖, 𝛾𝑗𝑖 𝑋𝑖 + 𝜖1)
= 𝛾𝑗𝑖 𝐶𝑂𝑉(𝑋𝑖, 𝑋𝑖)
= 𝛾𝑗𝑖 𝛿 𝑋 𝑖 𝑋 𝑖
η = 𝐵η + 𝛾ξ + ζ
𝑝 𝑝+1
2
variance +covariance
Graphical representation for SEM
x1
x2
x3
ξ belief η behavior
y1
y2
y3
δ1 ε1
λx1
γ
ζ
ε2
ε3
δ2
δ3
Error
Exogenous
observed
variable
Factor loading
Exogenous
latent variable
Structural parameter
Endogenous
latent variable
Factor loading
Endogenous
observed
variable
Structural
model
measurement
model
Error
λx2
λx3
λy1
λy2
λy3
measurement
model
Graphical representation for SEM
 Measurement model
 Confirmatory factor analysis (CFA)
x1
x3
x2
δ1
δ 2
δ 3
ξ1
λ11
λ21
λ31
δ[delta] ; λ[lambda]; ξ[xi]
x1= λ11 ξ1+ δ1
x2= λ21 ξ1+ δ2
x3= λ31 ξ1+ δ3
Some important issue
 Model identification
 A unique numerical solution for each of the
parameters in the model
 Data point
 Overidentified
 Data point >parameters (df>0)
 Just identified
 Data point =parameters (df=0)
 Underidentified (X)
 Data point <parameters (df<0)
𝑝 𝑝 + 1
2
Model
identification
Measurement
model
Structural
model
Assessing the fit of the model
Category Index
Absolute fit index
χ2, χ2/df
GFI
AGFI
Comparative fit index
RMSEA
CFI
NFI
NNFI
IFI
Parsimonious fit
index
PGFI
PNFI
CN
Residual
RMR
SRMR
Absolute fit index
 Chi-square test
 N.S.
 Chi-square / df < 2 (3)
 Indices of proportion of variance accounted
𝑔𝑜𝑜𝑑𝑛𝑒𝑠𝑠 − 𝑜𝑓 − 𝑓𝑖𝑡 𝑖𝑛𝑑𝑒𝑥 𝑮𝑭𝑰 =
𝑡𝑟( 𝜎′ 𝑊 𝜎)
𝑡𝑟(𝑠′ 𝑊𝑠)
𝑎𝑑𝑗𝑢𝑠𝑡𝑒𝑑 𝑔𝑜𝑜𝑑𝑛𝑒𝑠𝑠 − 𝑜𝑓 − 𝑓𝑖𝑡 𝑖𝑛𝑑𝑒𝑥 𝑨𝑮𝑭𝑰 =
1 − 𝐺𝐹𝐼
1 −
𝑛𝑢𝑚𝑏𝑒𝑟 𝑜𝑓 𝑒𝑠𝑡. 𝑝𝑎𝑟𝑎𝑚𝑒𝑡𝑒𝑟𝑠
𝑛𝑢𝑚𝑏𝑒𝑟 𝑜𝑓 𝑑𝑎𝑡𝑎 𝑝𝑜𝑖𝑛𝑡
Comparative fit index
 Nested model
Independent
model
Saturated
model
Unrelate
d
variable
s
df=0
Nested model
Phenome
na
Theor
y
Systematic
description
Data
Objectively
exist
Model
0
Framed by
theoretical
basement
fit or not
parameter estimation
Nested model
Saturated model
Model 1
Model 2
Model 3
Parent model or
Full model
all parameters are freely
estimated
restriction nested in
χ2 、df ↑
Comparative fit index
 Assessing the fit of the model
𝑐𝑜𝑚𝑝𝑎𝑟𝑎𝑡𝑖𝑣𝑒 𝑓𝑖𝑡 𝑖𝑛𝑑𝑒𝑥 𝑪𝑭𝑰 = 1 −
𝜏 𝑒𝑠𝑡.𝑚𝑜𝑑𝑒𝑙
𝜏𝑖𝑛𝑑𝑒𝑝.𝑚𝑜𝑑𝑒𝑙
𝜏 𝑒𝑠𝑡.𝑚𝑜𝑑𝑒𝑙 = χ𝑖𝑛𝑑𝑒𝑝.𝑚𝑜𝑑𝑒𝑙
2
− 𝑑𝑓𝑖𝑛𝑑𝑒𝑝.𝑚𝑜𝑑𝑒𝑙
𝜏 𝑒𝑠𝑡.𝑚𝑜𝑑𝑒𝑙 = χ 𝑒𝑠𝑡.𝑚𝑜𝑑𝑒𝑙
2
− 𝑑𝑓𝑒𝑠𝑡.𝑚𝑜𝑑𝑒𝑙
𝜏𝑖 = 𝑣𝑎𝑙𝑢𝑒 𝑜𝑓 𝑚𝑖𝑠𝑠𝑝𝑒𝑐𝑖𝑓𝑖𝑐𝑎𝑡𝑖𝑜𝑛
𝑟𝑜𝑜𝑡 𝑚𝑒𝑎𝑛 𝑠𝑞𝑢𝑎𝑟𝑒 𝑒𝑟𝑟𝑜𝑟 𝑜𝑓 𝑎𝑝𝑝𝑟𝑜𝑥𝑖𝑚𝑎𝑡𝑖𝑜𝑛 𝑹𝑴𝑺𝑬𝑨 =
𝐹0
𝑑𝑓 𝑚𝑜𝑑𝑒𝑙
𝐹0 =
χ 𝑚𝑜𝑑𝑒𝑙
2
− 𝑑𝑓 𝑚𝑜𝑑𝑒𝑙
𝑁
Compare to
independent
model
Compare to
saturated
model
Comparative fit index
𝑛𝑜𝑟𝑚𝑒𝑑 𝑓𝑖𝑡 𝑖𝑛𝑑𝑒𝑥 𝑵𝑭𝑰 =
χ𝑖𝑛𝑑𝑒𝑝
2
− χ 𝑚𝑜𝑑𝑒𝑙
2
χ𝑖𝑛𝑑𝑒𝑝
2
𝑛𝑜𝑛 − 𝑛𝑜𝑟𝑚𝑒𝑑 𝑓𝑖𝑡 𝑖𝑛𝑑𝑒𝑥 𝑵𝑵𝑭𝑰/𝑻𝑳𝑰 =
χ𝑖𝑛𝑑𝑒𝑝
2
−
𝑑𝑓𝑖𝑛𝑑𝑒𝑝
𝑑𝑓 𝑚𝑜𝑑𝑒𝑙
χ 𝑚𝑜𝑑𝑒𝑙
2
χ𝑖𝑛𝑑𝑒𝑝
2
− 𝑑𝑓𝑖𝑛𝑑𝑒𝑝
Underestimate with small N
Too sensitive to stable
𝑖𝑛𝑐𝑟𝑒𝑚𝑒𝑛𝑡𝑎𝑙 𝑓𝑖𝑡 𝑖𝑛𝑑𝑒𝑥 𝑰𝑭𝑰 =
χ𝑖𝑛𝑑𝑒𝑝
2
− χ 𝑚𝑜𝑑𝑒𝑙
2
χ𝑖𝑛𝑑𝑒𝑝
2
− 𝑑𝑓 𝑚𝑜𝑑𝑒𝑙
Parsimonious fit index
𝑝𝑎𝑟𝑠𝑖𝑚𝑜𝑛𝑦 𝐺𝐹𝐼 𝑷𝑮𝑭𝑰 = 1 −
𝑛𝑢𝑚𝑏𝑒𝑟 𝑜𝑓 𝑒𝑠𝑡. 𝑝𝑎𝑟𝑎𝑚𝑒𝑡𝑒𝑡𝑠
𝑛𝑢𝑚𝑏𝑒𝑟 𝑜𝑓 𝑑𝑎𝑡𝑎 𝑝𝑜𝑖𝑛𝑡𝑠
𝐺𝐹𝐼
𝐴𝑘𝑎𝑖𝑘𝑒 𝑖𝑛𝑓𝑜𝑟𝑚𝑎𝑡𝑖𝑜𝑛 𝑐𝑟𝑖𝑡𝑒𝑟𝑖𝑜𝑛 (𝑨𝑰𝑪) = χ 𝑚𝑜𝑑𝑒𝑙
2
− 2𝑑𝑓 𝑚𝑜𝑑𝑒𝑙
𝑐𝑜𝑛𝑠𝑖𝑠𝑡𝑒𝑛𝑡 𝐴𝑘𝑎𝑖𝑘𝑒 𝑖𝑛𝑓𝑜𝑟𝑚𝑎𝑡𝑖𝑜𝑛 𝑐𝑟𝑖𝑡𝑒𝑟𝑖𝑜𝑛 (𝑪𝑨𝑰𝑪) = χ 𝑚𝑜𝑑𝑒𝑙
2
− (𝑙𝑛𝑁 + 1)2𝑑𝑓 𝑚𝑜𝑑𝑒𝑙
Residual-based fit indices
 Average difference between sample and
estimated population variance-covariance
𝑟𝑜𝑜𝑡 𝑚𝑒𝑎𝑛 𝑠𝑞𝑢𝑎𝑟𝑒 𝑟𝑒𝑠𝑖𝑑𝑢𝑎𝑙 𝑹𝑴𝑹 = 2
𝑖=1
𝑞
𝑗=1
𝑖
𝑠𝑖𝑗 − 𝜎𝑖𝑗
2
𝑞 𝑞 + 1
1
2
Recommended value of index
Index Value
χ2 N.S.
Χ2/df <2 (3)
NFI >.95 (.90)
NNFI >.95 (.90)
IFI >.95 (.90)
CFI >.95 (.90)
GFI >.90
AGFI >.90
PGFI >.90
AIC Small
CAIC Small
RMSEA <.05 (.06)
SRMR <.08
What indices should be presented?
 Diamantopoulo & Siguaw (2000)
 χ2, χ2/df, RMSEA, SRMR, GFI/AGFI, CFI, ECVI
 Hoyle & Panter (1995)
 χ2, χ2/df, GFI/AGFI, CFI, NNFI, IFI, RNI
Model modification
 Chi-square difference test
 (χ2
2
− χ1
2
)/(𝑑𝑓2 − 𝑑𝑓1)
 Lagrange multiplier (LM) test
 Add parameters
 Wald test
 Delete parameters
CONFIRMATORY
FACTOR ANALYSIS
(CFA)
Application of SEM
 Measurement model
 Confirmatory factor analysis (CFA)
x1
x3
x2
δ1
δ 2
δ 3
ξ1
λ11
λ21
λ31
x1= λ11 ξ1+ δ1
x2= λ21 ξ1+ δ2
x3= λ31 ξ1+ δ3
Indices
 Goodness-of fit
 Factor loading (λ >.70)
 R2
 Convergent validity
 Composite reliability
 𝜌𝑐 =
λ 2
λ 2+ 𝜃
 Average variance extracted (AVE)
 𝜌 𝑣 =
λ2
λ 2+ 𝜃
 Discriminant validity
PRACTICE
運動團隊默契量表的效化檢驗
 運動團隊默契會反應在三種向度上,分別是正確
的:
 1.任務知識
 2.能力評價
 3.情緒覺察
 請進行驗證性因素分析提供進一步的效度證據。
SEM
MODEL COMPARISON
SEM
Phenome
na
Theor
y
Systematic
description
Data
Objectively
exist
Model
0
Framed by
theoretical
basement
fit or not
parameter estimation
SEM
data
Model 1
Model 2
Model 3
Model n
Which one
fits better ?
Nested model
Saturated model
Model 1
Model 2
Model 3
Parent model or
Full model
all parameters are freely
estimated
restriction nested in
χ2 、df ↑
Nested model
fixed path in structure model
x1
x2
x3
perceived
control
behavior
y1
y2
y3
x4 x5 x6
intention
C, 0
Nested model
fixed loading in measurement model
x1
x2
x3
ξ perceived
control
x4
x5
x6
ξ intention
x1
x2
x3
ξ perceived
control
x4
x5
x6
ξ intention
a
a
b
b
Nested model
fixed correlation between latent variables
in measurement model
x1
x2
x3
ξ perceived
control
x4
x5
x6
ξ intention
x1
x2
x3
ξ perceived
control
x4
x5
x6
ξ intention
C, 0
Which one fits better?
 Nested model
 △χ2 test
 Target coefficient
 Initial model χ𝑖
2
 Restricted model χ 𝑟
2
 T= χ𝑖
2
/ χ 𝑟
2
 Non-nested model
 AIC
 CAIC
Parsimonious purpose
 General concept and multiple dimensions
 1 order
 2 order
 Nested model
 Required number of lower order dimension
 >3
 3 (equivalent model)
PRACTICE
控制型教練領導行為量表的效化檢驗
 根據相關學理,教練的控制傾向會反應在四種向度
上,分別是:
 1.酬賞控制
 2.有條件式的關愛
 3.威嚇
 4.過度控制
 研究生康挫依中文化了控制型領導行為量表,請幫
他進行驗證性因素分析提供進一步的效度證據。
SEM
MEASUREMENT
INVARIANCE
Generalization
model
data 1
Population 1
fit
fit
Can we generalize the
psychological
phenomenon of P1 to P2 ?
Population 2
data 2
are the constructs comparable
between the two populations?
(mean, variance, covariance or
correlation)
Measurement invariance
 Measurement equivalence
 Construct comparability
 Advantage
 Identical operational definition
 Generalizability
 Minimize bias (culture, translation, or survey)
 However…
So, how
 Multiple group mean and covariance structure
analysis (MACS)(Little, 1997)
 Parameters (Meredith, 1993)
 Configural invariance
 Weak factorial invariance
 Strong factorial invariance
 Strict factorial invariance
 Structural invariance
Configural invariance
 Baseline model
𝑌1 = 𝑏0 + 𝑏11 𝑋1 + 𝑏21 𝑋2 + ⋯ + 𝑏 𝑝1 𝑋 𝑝 + 𝑒1
𝑌𝑞 = 𝑏0 + 𝑏1𝑞 𝑋1 + 𝑏2𝑞 𝑋2 + ⋯ + 𝑏 𝑝𝑞 𝑋 𝑝 + 𝑒 𝑞
⋮⋮ ⋮ ⋮ ⋮
intercept
(mean)
slope
(loading)
error
(Meredith, 1993)
Weak factorial invariance 𝜦 𝟏 = 𝜦 𝟐
 Measurement weight
𝑌1 = 𝑏0 + 𝑏11 𝑋1 + 𝑏21 𝑋2 + ⋯ + 𝑏 𝑝1 𝑋 𝑝 + 𝑒1
𝑌𝑞 = 𝑏0 + 𝑏1𝑞 𝑋1 + 𝑏2𝑞 𝑋2 + ⋯ + 𝑏 𝑝𝑞 𝑋 𝑝 + 𝑒 𝑞
⋮⋮ ⋮ ⋮ ⋮
intercept
(mean)
slope
(loading)
error
(Meredith, 1993)
Strong factorial invariance 𝝉 𝟏 = 𝝉 𝟐
 Mean
𝑌1 = 𝑏0 + 𝑏11 𝑋1 + 𝑏21 𝑋2 + ⋯ + 𝑏 𝑝1 𝑋 𝑝 + 𝑒1
𝑌𝑞 = 𝑏0 + 𝑏1𝑞 𝑋1 + 𝑏2𝑞 𝑋2 + ⋯ + 𝑏 𝑝𝑞 𝑋 𝑝 + 𝑒 𝑞
⋮⋮ ⋮ ⋮ ⋮
intercept
(mean)
slope
(loading)
error
(Meredith, 1993)
Strict factorial invariance 𝜽 𝟏 = 𝜽 𝟐
 Measurement residual
𝑌1 = 𝑏0 + 𝑏11 𝑋1 + 𝑏21 𝑋2 + ⋯ + 𝑏 𝑝1 𝑋 𝑝 + 𝑒1
𝑌𝑞 = 𝑏0 + 𝑏1𝑞 𝑋1 + 𝑏2𝑞 𝑋2 + ⋯ + 𝑏 𝑝𝑞 𝑋 𝑝 + 𝑒 𝑞
⋮⋮ ⋮ ⋮ ⋮
intercept
(mean)
slope
(loading)
error
(Meredith, 1993)
Structural invariance 𝝋 𝟏 = 𝝋 𝟐
 Variance and covariance
𝑌1 = 𝑏0 + 𝑏11 𝑋1 + 𝑏21 𝑋2 + ⋯ + 𝑏 𝑝1 𝑋 𝑝 + 𝑒1
𝑌𝑞 = 𝑏0 + 𝑏1𝑞 𝑋1 + 𝑏2𝑞 𝑋2 + ⋯ + 𝑏 𝑝𝑞 𝑋 𝑝 + 𝑒 𝑞
⋮⋮ ⋮ ⋮ ⋮
intercept
(mean)
slope
(loading)
error
(Meredith, 1993)
Model comparison-nested model
 Baseline model
 𝜦 𝟏 = 𝜦 𝟐
 𝜦 𝟏 = 𝜦 𝟐 + 𝝉 𝟏 = 𝝉 𝟐
 𝜦 𝟏 = 𝜦 𝟐 + 𝝉 𝟏 = 𝝉 𝟐 + 𝜽 𝟏 = 𝜽 𝟐
 𝜦 𝟏 = 𝜦 𝟐 + 𝝉 𝟏 = 𝝉 𝟐 + 𝜽 𝟏 = 𝜽 𝟐 + 𝝋 𝟏 = 𝝋 𝟐
(Meredith, 1993)
Configural invariance
Weak factorial
invariance
Strong factorial
invariance
Strict factorial
invariance
Structural invariance
Which one fits better?
 Nested model
 △χ2 test
 Fit index (Cheug & Rensvold, 2002; Little, 1997; McGaw & Joredkog, 1971)
 △ NNFI <.05 (.02)
 △ IFI <.05
 △CFI <.01
 △RFI <.05
PRACTICE
運動正念量表的效化檢驗
 根據相關學理,運動員的正念特性會反應在三個
向度上,分別是:
 1.覺察
 2.再專注
 3.不評價
 研究生歐芷觀發展了一份測量工具,請幫她進行
性別不變性的檢驗。

More Related Content

What's hot

Discriminant analysis group no. 4
Discriminant analysis  group no. 4Discriminant analysis  group no. 4
Discriminant analysis group no. 4
Advait Bhobe
 
Factor Analysis in Research
Factor Analysis in ResearchFactor Analysis in Research
Factor Analysis in Research
Qasim Raza
 
Exploratory Factor Analysis Assignment 2013-2014(1)
Exploratory Factor Analysis Assignment 2013-2014(1)Exploratory Factor Analysis Assignment 2013-2014(1)
Exploratory Factor Analysis Assignment 2013-2014(1)
TIEZHENG YUAN
 
Factor analysis
Factor analysisFactor analysis
Factor analysis
saba khan
 

What's hot (20)

Introduction to Structural Equation Modeling Partial Least Sqaures (SEM-PLS)
Introduction to Structural Equation Modeling Partial Least Sqaures (SEM-PLS)Introduction to Structural Equation Modeling Partial Least Sqaures (SEM-PLS)
Introduction to Structural Equation Modeling Partial Least Sqaures (SEM-PLS)
 
Discriminant analysis group no. 4
Discriminant analysis  group no. 4Discriminant analysis  group no. 4
Discriminant analysis group no. 4
 
Multivariate Analysis Techniques
Multivariate Analysis TechniquesMultivariate Analysis Techniques
Multivariate Analysis Techniques
 
MANOVA SPSS
MANOVA SPSSMANOVA SPSS
MANOVA SPSS
 
discriminant analysis
discriminant analysisdiscriminant analysis
discriminant analysis
 
Manova ppt
Manova pptManova ppt
Manova ppt
 
Factor Analysis with an Example
Factor Analysis with an ExampleFactor Analysis with an Example
Factor Analysis with an Example
 
Factor Analysis in Research
Factor Analysis in ResearchFactor Analysis in Research
Factor Analysis in Research
 
Factor analysis ppt
Factor analysis pptFactor analysis ppt
Factor analysis ppt
 
Manova
ManovaManova
Manova
 
Discriminant analysis
Discriminant analysisDiscriminant analysis
Discriminant analysis
 
Exploratory Factor Analysis Assignment 2013-2014(1)
Exploratory Factor Analysis Assignment 2013-2014(1)Exploratory Factor Analysis Assignment 2013-2014(1)
Exploratory Factor Analysis Assignment 2013-2014(1)
 
Factor analysis
Factor analysisFactor analysis
Factor analysis
 
Factor analysis
Factor analysisFactor analysis
Factor analysis
 
In Anova
In  AnovaIn  Anova
In Anova
 
Multiple Linear Regression II and ANOVA I
Multiple Linear Regression II and ANOVA IMultiple Linear Regression II and ANOVA I
Multiple Linear Regression II and ANOVA I
 
Confirmatory Factor Analysis
Confirmatory Factor AnalysisConfirmatory Factor Analysis
Confirmatory Factor Analysis
 
Structural Equation Modelling (SEM) Part 1
Structural Equation Modelling (SEM) Part 1Structural Equation Modelling (SEM) Part 1
Structural Equation Modelling (SEM) Part 1
 
Anova; analysis of variance
Anova; analysis of varianceAnova; analysis of variance
Anova; analysis of variance
 
Time series analysis- Part 2
Time series analysis- Part 2Time series analysis- Part 2
Time series analysis- Part 2
 

Viewers also liked

Confirmatory Factor Analysis Presented by Mahfoudh Mgammal
Confirmatory Factor Analysis Presented by Mahfoudh MgammalConfirmatory Factor Analysis Presented by Mahfoudh Mgammal
Confirmatory Factor Analysis Presented by Mahfoudh Mgammal
Dr. Mahfoudh Hussein Mgammal
 
12 основные возможности корпоративных приложений
12 основные возможности корпоративных приложений12 основные возможности корпоративных приложений
12 основные возможности корпоративных приложений
KewpaN
 
3 средства автоматизации проектирования корпоративных приложений
3 средства автоматизации проектирования корпоративных приложений3 средства автоматизации проектирования корпоративных приложений
3 средства автоматизации проектирования корпоративных приложений
KewpaN
 
Tablets Teaching Tech Slides
Tablets Teaching Tech SlidesTablets Teaching Tech Slides
Tablets Teaching Tech Slides
Jennifer Katzen
 

Viewers also liked (20)

Functional Forms of Regression Models | Eonomics
Functional Forms of Regression Models | EonomicsFunctional Forms of Regression Models | Eonomics
Functional Forms of Regression Models | Eonomics
 
SEM model examination
SEM model examinationSEM model examination
SEM model examination
 
The Confirmatory Factor Analysis of the Quality Criteria for Education Digita...
The Confirmatory Factor Analysis of the Quality Criteria for Education Digita...The Confirmatory Factor Analysis of the Quality Criteria for Education Digita...
The Confirmatory Factor Analysis of the Quality Criteria for Education Digita...
 
CFA Fit Statistics
CFA Fit StatisticsCFA Fit Statistics
CFA Fit Statistics
 
SEM History - version 2017
SEM History - version 2017SEM History - version 2017
SEM History - version 2017
 
Confirmatory Factor Analysis Presented by Mahfoudh Mgammal
Confirmatory Factor Analysis Presented by Mahfoudh MgammalConfirmatory Factor Analysis Presented by Mahfoudh Mgammal
Confirmatory Factor Analysis Presented by Mahfoudh Mgammal
 
Path analysis
Path analysisPath analysis
Path analysis
 
Confirmatory Factor Analysis
Confirmatory Factor AnalysisConfirmatory Factor Analysis
Confirmatory Factor Analysis
 
Structural equation modeling in amos
Structural equation modeling in amosStructural equation modeling in amos
Structural equation modeling in amos
 
Key ideas, terms and concepts in SEM
Key ideas, terms and concepts in SEMKey ideas, terms and concepts in SEM
Key ideas, terms and concepts in SEM
 
Scanning Electron Microscope (SEM)
Scanning Electron Microscope (SEM)Scanning Electron Microscope (SEM)
Scanning Electron Microscope (SEM)
 
Basics of Structural Equation Modeling
Basics of Structural Equation ModelingBasics of Structural Equation Modeling
Basics of Structural Equation Modeling
 
Scanning Electron Microscopy (SEM) lecture
Scanning Electron Microscopy (SEM) lectureScanning Electron Microscopy (SEM) lecture
Scanning Electron Microscopy (SEM) lecture
 
12 основные возможности корпоративных приложений
12 основные возможности корпоративных приложений12 основные возможности корпоративных приложений
12 основные возможности корпоративных приложений
 
blending station
blending stationblending station
blending station
 
Uzi grindler
Uzi grindlerUzi grindler
Uzi grindler
 
3 средства автоматизации проектирования корпоративных приложений
3 средства автоматизации проектирования корпоративных приложений3 средства автоматизации проектирования корпоративных приложений
3 средства автоматизации проектирования корпоративных приложений
 
life processes #aanchal
life processes #aanchallife processes #aanchal
life processes #aanchal
 
Cluster analysis
Cluster analysisCluster analysis
Cluster analysis
 
Tablets Teaching Tech Slides
Tablets Teaching Tech SlidesTablets Teaching Tech Slides
Tablets Teaching Tech Slides
 

Similar to SEM

Intro to Model Selection
Intro to Model SelectionIntro to Model Selection
Intro to Model Selection
chenhm
 
ForecastingBUS255 GoalsBy the end of this chapter, y.docx
ForecastingBUS255 GoalsBy the end of this chapter, y.docxForecastingBUS255 GoalsBy the end of this chapter, y.docx
ForecastingBUS255 GoalsBy the end of this chapter, y.docx
budbarber38650
 
AIAA-Aviation-VariableFidelity-2014-Mehmani
AIAA-Aviation-VariableFidelity-2014-MehmaniAIAA-Aviation-VariableFidelity-2014-Mehmani
AIAA-Aviation-VariableFidelity-2014-Mehmani
OptiModel
 
AMS_Aviation_2014_Ali
AMS_Aviation_2014_AliAMS_Aviation_2014_Ali
AMS_Aviation_2014_Ali
MDO_Lab
 
MDPSO_SDM_2012_Souma
MDPSO_SDM_2012_SoumaMDPSO_SDM_2012_Souma
MDPSO_SDM_2012_Souma
MDO_Lab
 

Similar to SEM (20)

Regression for class teaching
Regression for class teachingRegression for class teaching
Regression for class teaching
 
Factor analysis
Factor analysisFactor analysis
Factor analysis
 
Smart PLS 4 workshop by Dalowar & Mushtaq Al-Husnawi.pdf
Smart PLS 4 workshop by Dalowar & Mushtaq Al-Husnawi.pdfSmart PLS 4 workshop by Dalowar & Mushtaq Al-Husnawi.pdf
Smart PLS 4 workshop by Dalowar & Mushtaq Al-Husnawi.pdf
 
Corrleation and regression
Corrleation and regressionCorrleation and regression
Corrleation and regression
 
Intro to Model Selection
Intro to Model SelectionIntro to Model Selection
Intro to Model Selection
 
Measures of dispersion
Measures of dispersionMeasures of dispersion
Measures of dispersion
 
Measures of dispersion discuss 2.2
Measures of dispersion discuss 2.2Measures of dispersion discuss 2.2
Measures of dispersion discuss 2.2
 
ForecastingBUS255 GoalsBy the end of this chapter, y.docx
ForecastingBUS255 GoalsBy the end of this chapter, y.docxForecastingBUS255 GoalsBy the end of this chapter, y.docx
ForecastingBUS255 GoalsBy the end of this chapter, y.docx
 
6SigmaReferenceMaterials
6SigmaReferenceMaterials6SigmaReferenceMaterials
6SigmaReferenceMaterials
 
Cairo 02 Stat Inference
Cairo 02 Stat InferenceCairo 02 Stat Inference
Cairo 02 Stat Inference
 
AIAA-Aviation-VariableFidelity-2014-Mehmani
AIAA-Aviation-VariableFidelity-2014-MehmaniAIAA-Aviation-VariableFidelity-2014-Mehmani
AIAA-Aviation-VariableFidelity-2014-Mehmani
 
Intro to data science
Intro to data scienceIntro to data science
Intro to data science
 
Introduction To Data Science Using R
Introduction To Data Science Using RIntroduction To Data Science Using R
Introduction To Data Science Using R
 
7. logistics regression using spss
7. logistics regression using spss7. logistics regression using spss
7. logistics regression using spss
 
Measure of Dispersion in statistics
Measure of Dispersion in statisticsMeasure of Dispersion in statistics
Measure of Dispersion in statistics
 
Tales of correlation inflation (2013 CADD GRC)
Tales of correlation inflation (2013 CADD GRC) Tales of correlation inflation (2013 CADD GRC)
Tales of correlation inflation (2013 CADD GRC)
 
AMS_Aviation_2014_Ali
AMS_Aviation_2014_AliAMS_Aviation_2014_Ali
AMS_Aviation_2014_Ali
 
Feature Reduction Techniques
Feature Reduction TechniquesFeature Reduction Techniques
Feature Reduction Techniques
 
MDPSO_SDM_2012_Souma
MDPSO_SDM_2012_SoumaMDPSO_SDM_2012_Souma
MDPSO_SDM_2012_Souma
 
Hypothesis Testing
Hypothesis TestingHypothesis Testing
Hypothesis Testing
 

Recently uploaded

Opendatabay - Open Data Marketplace.pptx
Opendatabay - Open Data Marketplace.pptxOpendatabay - Open Data Marketplace.pptx
Opendatabay - Open Data Marketplace.pptx
Opendatabay
 
Professional Data Engineer Certification Exam Guide  _  Learn  _  Google Clou...
Professional Data Engineer Certification Exam Guide  _  Learn  _  Google Clou...Professional Data Engineer Certification Exam Guide  _  Learn  _  Google Clou...
Professional Data Engineer Certification Exam Guide  _  Learn  _  Google Clou...
Domenico Conte
 
Empowering Data Analytics Ecosystem.pptx
Empowering Data Analytics Ecosystem.pptxEmpowering Data Analytics Ecosystem.pptx
Empowering Data Analytics Ecosystem.pptx
benishzehra469
 
一比一原版(RUG毕业证)格罗宁根大学毕业证成绩单
一比一原版(RUG毕业证)格罗宁根大学毕业证成绩单一比一原版(RUG毕业证)格罗宁根大学毕业证成绩单
一比一原版(RUG毕业证)格罗宁根大学毕业证成绩单
vcaxypu
 
一比一原版(TWU毕业证)西三一大学毕业证成绩单
一比一原版(TWU毕业证)西三一大学毕业证成绩单一比一原版(TWU毕业证)西三一大学毕业证成绩单
一比一原版(TWU毕业证)西三一大学毕业证成绩单
ocavb
 
Investigate & Recover / StarCompliance.io / Crypto_Crimes
Investigate & Recover / StarCompliance.io / Crypto_CrimesInvestigate & Recover / StarCompliance.io / Crypto_Crimes
Investigate & Recover / StarCompliance.io / Crypto_Crimes
StarCompliance.io
 
一比一原版(YU毕业证)约克大学毕业证成绩单
一比一原版(YU毕业证)约克大学毕业证成绩单一比一原版(YU毕业证)约克大学毕业证成绩单
一比一原版(YU毕业证)约克大学毕业证成绩单
enxupq
 
Computer Presentation.pptx ecommerce advantage s
Computer Presentation.pptx ecommerce advantage sComputer Presentation.pptx ecommerce advantage s
Computer Presentation.pptx ecommerce advantage s
MAQIB18
 
standardisation of garbhpala offhgfffghh
standardisation of garbhpala offhgfffghhstandardisation of garbhpala offhgfffghh
standardisation of garbhpala offhgfffghh
ArpitMalhotra16
 
一比一原版(CBU毕业证)卡普顿大学毕业证成绩单
一比一原版(CBU毕业证)卡普顿大学毕业证成绩单一比一原版(CBU毕业证)卡普顿大学毕业证成绩单
一比一原版(CBU毕业证)卡普顿大学毕业证成绩单
nscud
 
一比一原版(UofM毕业证)明尼苏达大学毕业证成绩单
一比一原版(UofM毕业证)明尼苏达大学毕业证成绩单一比一原版(UofM毕业证)明尼苏达大学毕业证成绩单
一比一原版(UofM毕业证)明尼苏达大学毕业证成绩单
ewymefz
 
一比一原版(CU毕业证)卡尔顿大学毕业证成绩单
一比一原版(CU毕业证)卡尔顿大学毕业证成绩单一比一原版(CU毕业证)卡尔顿大学毕业证成绩单
一比一原版(CU毕业证)卡尔顿大学毕业证成绩单
yhkoc
 
一比一原版(UPenn毕业证)宾夕法尼亚大学毕业证成绩单
一比一原版(UPenn毕业证)宾夕法尼亚大学毕业证成绩单一比一原版(UPenn毕业证)宾夕法尼亚大学毕业证成绩单
一比一原版(UPenn毕业证)宾夕法尼亚大学毕业证成绩单
ewymefz
 
一比一原版(UMich毕业证)密歇根大学|安娜堡分校毕业证成绩单
一比一原版(UMich毕业证)密歇根大学|安娜堡分校毕业证成绩单一比一原版(UMich毕业证)密歇根大学|安娜堡分校毕业证成绩单
一比一原版(UMich毕业证)密歇根大学|安娜堡分校毕业证成绩单
ewymefz
 

Recently uploaded (20)

Opendatabay - Open Data Marketplace.pptx
Opendatabay - Open Data Marketplace.pptxOpendatabay - Open Data Marketplace.pptx
Opendatabay - Open Data Marketplace.pptx
 
Professional Data Engineer Certification Exam Guide  _  Learn  _  Google Clou...
Professional Data Engineer Certification Exam Guide  _  Learn  _  Google Clou...Professional Data Engineer Certification Exam Guide  _  Learn  _  Google Clou...
Professional Data Engineer Certification Exam Guide  _  Learn  _  Google Clou...
 
tapal brand analysis PPT slide for comptetive data
tapal brand analysis PPT slide for comptetive datatapal brand analysis PPT slide for comptetive data
tapal brand analysis PPT slide for comptetive data
 
Empowering Data Analytics Ecosystem.pptx
Empowering Data Analytics Ecosystem.pptxEmpowering Data Analytics Ecosystem.pptx
Empowering Data Analytics Ecosystem.pptx
 
Predicting Product Ad Campaign Performance: A Data Analysis Project Presentation
Predicting Product Ad Campaign Performance: A Data Analysis Project PresentationPredicting Product Ad Campaign Performance: A Data Analysis Project Presentation
Predicting Product Ad Campaign Performance: A Data Analysis Project Presentation
 
Business update Q1 2024 Lar España Real Estate SOCIMI
Business update Q1 2024 Lar España Real Estate SOCIMIBusiness update Q1 2024 Lar España Real Estate SOCIMI
Business update Q1 2024 Lar España Real Estate SOCIMI
 
一比一原版(RUG毕业证)格罗宁根大学毕业证成绩单
一比一原版(RUG毕业证)格罗宁根大学毕业证成绩单一比一原版(RUG毕业证)格罗宁根大学毕业证成绩单
一比一原版(RUG毕业证)格罗宁根大学毕业证成绩单
 
一比一原版(TWU毕业证)西三一大学毕业证成绩单
一比一原版(TWU毕业证)西三一大学毕业证成绩单一比一原版(TWU毕业证)西三一大学毕业证成绩单
一比一原版(TWU毕业证)西三一大学毕业证成绩单
 
Investigate & Recover / StarCompliance.io / Crypto_Crimes
Investigate & Recover / StarCompliance.io / Crypto_CrimesInvestigate & Recover / StarCompliance.io / Crypto_Crimes
Investigate & Recover / StarCompliance.io / Crypto_Crimes
 
一比一原版(YU毕业证)约克大学毕业证成绩单
一比一原版(YU毕业证)约克大学毕业证成绩单一比一原版(YU毕业证)约克大学毕业证成绩单
一比一原版(YU毕业证)约克大学毕业证成绩单
 
Computer Presentation.pptx ecommerce advantage s
Computer Presentation.pptx ecommerce advantage sComputer Presentation.pptx ecommerce advantage s
Computer Presentation.pptx ecommerce advantage s
 
Criminal IP - Threat Hunting Webinar.pdf
Criminal IP - Threat Hunting Webinar.pdfCriminal IP - Threat Hunting Webinar.pdf
Criminal IP - Threat Hunting Webinar.pdf
 
How can I successfully sell my pi coins in Philippines?
How can I successfully sell my pi coins in Philippines?How can I successfully sell my pi coins in Philippines?
How can I successfully sell my pi coins in Philippines?
 
standardisation of garbhpala offhgfffghh
standardisation of garbhpala offhgfffghhstandardisation of garbhpala offhgfffghh
standardisation of garbhpala offhgfffghh
 
Uber Ride Supply Demand Gap Analysis Report
Uber Ride Supply Demand Gap Analysis ReportUber Ride Supply Demand Gap Analysis Report
Uber Ride Supply Demand Gap Analysis Report
 
一比一原版(CBU毕业证)卡普顿大学毕业证成绩单
一比一原版(CBU毕业证)卡普顿大学毕业证成绩单一比一原版(CBU毕业证)卡普顿大学毕业证成绩单
一比一原版(CBU毕业证)卡普顿大学毕业证成绩单
 
一比一原版(UofM毕业证)明尼苏达大学毕业证成绩单
一比一原版(UofM毕业证)明尼苏达大学毕业证成绩单一比一原版(UofM毕业证)明尼苏达大学毕业证成绩单
一比一原版(UofM毕业证)明尼苏达大学毕业证成绩单
 
一比一原版(CU毕业证)卡尔顿大学毕业证成绩单
一比一原版(CU毕业证)卡尔顿大学毕业证成绩单一比一原版(CU毕业证)卡尔顿大学毕业证成绩单
一比一原版(CU毕业证)卡尔顿大学毕业证成绩单
 
一比一原版(UPenn毕业证)宾夕法尼亚大学毕业证成绩单
一比一原版(UPenn毕业证)宾夕法尼亚大学毕业证成绩单一比一原版(UPenn毕业证)宾夕法尼亚大学毕业证成绩单
一比一原版(UPenn毕业证)宾夕法尼亚大学毕业证成绩单
 
一比一原版(UMich毕业证)密歇根大学|安娜堡分校毕业证成绩单
一比一原版(UMich毕业证)密歇根大学|安娜堡分校毕业证成绩单一比一原版(UMich毕业证)密歇根大学|安娜堡分校毕业证成绩单
一比一原版(UMich毕业证)密歇根大学|安娜堡分校毕业证成绩单
 

SEM

  • 2. Purpose  To analyze a set of relationships between one or more IVs, either continuous or discrete, and one or more DVs, either continuous or discrete.  Multiple IVs  Multiple DVs  Confirmatory purpose  Advantage  Estimation of errors  Simultaneous test
  • 3. Kinds of research questions  The goal of SEM is to examine whether the model produce an estimated population covariance matrix is fitted to the sample covariance matrix or not.  Adequacy of model  Testing theory  Amount of variance in the variables accounted for by the factors  Reliability of the indicators  Parameter estimates  Intervening variables (indirect effect)  Group difference  Longitudinal difference  Multilevel modeling
  • 4. Limitations to factor analysis  Theoretical issues  Theory  causality  Practical issues  Sample size and missing data  15* umber of variable (Stevens, 1996)  5* number of estimated parameter (Bentler & Chou, 1987)  100 (Loehiln, 1992)  Multivariate normality and outliers  Linearity  Absence of multicollinearity and singularity  Residual
  • 5. Fundamental equation for SEM  Regression coefficients  Variance-covariance matrices  Data point 𝑌𝑗 = 𝛾𝑗𝑖 𝑋𝑖 + 𝜖1 𝐶𝑂𝑉 𝑋𝑖, 𝑌𝑗 = 𝐶𝑂𝑉(𝑋𝑖, 𝛾𝑗𝑖 𝑋𝑖 + 𝜖1) = 𝛾𝑗𝑖 𝐶𝑂𝑉(𝑋𝑖, 𝑋𝑖) = 𝛾𝑗𝑖 𝛿 𝑋 𝑖 𝑋 𝑖 η = 𝐵η + 𝛾ξ + ζ 𝑝 𝑝+1 2 variance +covariance
  • 6. Graphical representation for SEM x1 x2 x3 ξ belief η behavior y1 y2 y3 δ1 ε1 λx1 γ ζ ε2 ε3 δ2 δ3 Error Exogenous observed variable Factor loading Exogenous latent variable Structural parameter Endogenous latent variable Factor loading Endogenous observed variable Structural model measurement model Error λx2 λx3 λy1 λy2 λy3 measurement model
  • 7. Graphical representation for SEM  Measurement model  Confirmatory factor analysis (CFA) x1 x3 x2 δ1 δ 2 δ 3 ξ1 λ11 λ21 λ31 δ[delta] ; λ[lambda]; ξ[xi] x1= λ11 ξ1+ δ1 x2= λ21 ξ1+ δ2 x3= λ31 ξ1+ δ3
  • 8. Some important issue  Model identification  A unique numerical solution for each of the parameters in the model  Data point  Overidentified  Data point >parameters (df>0)  Just identified  Data point =parameters (df=0)  Underidentified (X)  Data point <parameters (df<0) 𝑝 𝑝 + 1 2 Model identification Measurement model Structural model
  • 9. Assessing the fit of the model Category Index Absolute fit index χ2, χ2/df GFI AGFI Comparative fit index RMSEA CFI NFI NNFI IFI Parsimonious fit index PGFI PNFI CN Residual RMR SRMR
  • 10. Absolute fit index  Chi-square test  N.S.  Chi-square / df < 2 (3)  Indices of proportion of variance accounted 𝑔𝑜𝑜𝑑𝑛𝑒𝑠𝑠 − 𝑜𝑓 − 𝑓𝑖𝑡 𝑖𝑛𝑑𝑒𝑥 𝑮𝑭𝑰 = 𝑡𝑟( 𝜎′ 𝑊 𝜎) 𝑡𝑟(𝑠′ 𝑊𝑠) 𝑎𝑑𝑗𝑢𝑠𝑡𝑒𝑑 𝑔𝑜𝑜𝑑𝑛𝑒𝑠𝑠 − 𝑜𝑓 − 𝑓𝑖𝑡 𝑖𝑛𝑑𝑒𝑥 𝑨𝑮𝑭𝑰 = 1 − 𝐺𝐹𝐼 1 − 𝑛𝑢𝑚𝑏𝑒𝑟 𝑜𝑓 𝑒𝑠𝑡. 𝑝𝑎𝑟𝑎𝑚𝑒𝑡𝑒𝑟𝑠 𝑛𝑢𝑚𝑏𝑒𝑟 𝑜𝑓 𝑑𝑎𝑡𝑎 𝑝𝑜𝑖𝑛𝑡
  • 11. Comparative fit index  Nested model Independent model Saturated model Unrelate d variable s df=0
  • 13. Nested model Saturated model Model 1 Model 2 Model 3 Parent model or Full model all parameters are freely estimated restriction nested in restriction nested in restriction nested in χ2 、df ↑
  • 14. Comparative fit index  Assessing the fit of the model 𝑐𝑜𝑚𝑝𝑎𝑟𝑎𝑡𝑖𝑣𝑒 𝑓𝑖𝑡 𝑖𝑛𝑑𝑒𝑥 𝑪𝑭𝑰 = 1 − 𝜏 𝑒𝑠𝑡.𝑚𝑜𝑑𝑒𝑙 𝜏𝑖𝑛𝑑𝑒𝑝.𝑚𝑜𝑑𝑒𝑙 𝜏 𝑒𝑠𝑡.𝑚𝑜𝑑𝑒𝑙 = χ𝑖𝑛𝑑𝑒𝑝.𝑚𝑜𝑑𝑒𝑙 2 − 𝑑𝑓𝑖𝑛𝑑𝑒𝑝.𝑚𝑜𝑑𝑒𝑙 𝜏 𝑒𝑠𝑡.𝑚𝑜𝑑𝑒𝑙 = χ 𝑒𝑠𝑡.𝑚𝑜𝑑𝑒𝑙 2 − 𝑑𝑓𝑒𝑠𝑡.𝑚𝑜𝑑𝑒𝑙 𝜏𝑖 = 𝑣𝑎𝑙𝑢𝑒 𝑜𝑓 𝑚𝑖𝑠𝑠𝑝𝑒𝑐𝑖𝑓𝑖𝑐𝑎𝑡𝑖𝑜𝑛 𝑟𝑜𝑜𝑡 𝑚𝑒𝑎𝑛 𝑠𝑞𝑢𝑎𝑟𝑒 𝑒𝑟𝑟𝑜𝑟 𝑜𝑓 𝑎𝑝𝑝𝑟𝑜𝑥𝑖𝑚𝑎𝑡𝑖𝑜𝑛 𝑹𝑴𝑺𝑬𝑨 = 𝐹0 𝑑𝑓 𝑚𝑜𝑑𝑒𝑙 𝐹0 = χ 𝑚𝑜𝑑𝑒𝑙 2 − 𝑑𝑓 𝑚𝑜𝑑𝑒𝑙 𝑁 Compare to independent model Compare to saturated model
  • 15. Comparative fit index 𝑛𝑜𝑟𝑚𝑒𝑑 𝑓𝑖𝑡 𝑖𝑛𝑑𝑒𝑥 𝑵𝑭𝑰 = χ𝑖𝑛𝑑𝑒𝑝 2 − χ 𝑚𝑜𝑑𝑒𝑙 2 χ𝑖𝑛𝑑𝑒𝑝 2 𝑛𝑜𝑛 − 𝑛𝑜𝑟𝑚𝑒𝑑 𝑓𝑖𝑡 𝑖𝑛𝑑𝑒𝑥 𝑵𝑵𝑭𝑰/𝑻𝑳𝑰 = χ𝑖𝑛𝑑𝑒𝑝 2 − 𝑑𝑓𝑖𝑛𝑑𝑒𝑝 𝑑𝑓 𝑚𝑜𝑑𝑒𝑙 χ 𝑚𝑜𝑑𝑒𝑙 2 χ𝑖𝑛𝑑𝑒𝑝 2 − 𝑑𝑓𝑖𝑛𝑑𝑒𝑝 Underestimate with small N Too sensitive to stable 𝑖𝑛𝑐𝑟𝑒𝑚𝑒𝑛𝑡𝑎𝑙 𝑓𝑖𝑡 𝑖𝑛𝑑𝑒𝑥 𝑰𝑭𝑰 = χ𝑖𝑛𝑑𝑒𝑝 2 − χ 𝑚𝑜𝑑𝑒𝑙 2 χ𝑖𝑛𝑑𝑒𝑝 2 − 𝑑𝑓 𝑚𝑜𝑑𝑒𝑙
  • 16. Parsimonious fit index 𝑝𝑎𝑟𝑠𝑖𝑚𝑜𝑛𝑦 𝐺𝐹𝐼 𝑷𝑮𝑭𝑰 = 1 − 𝑛𝑢𝑚𝑏𝑒𝑟 𝑜𝑓 𝑒𝑠𝑡. 𝑝𝑎𝑟𝑎𝑚𝑒𝑡𝑒𝑡𝑠 𝑛𝑢𝑚𝑏𝑒𝑟 𝑜𝑓 𝑑𝑎𝑡𝑎 𝑝𝑜𝑖𝑛𝑡𝑠 𝐺𝐹𝐼 𝐴𝑘𝑎𝑖𝑘𝑒 𝑖𝑛𝑓𝑜𝑟𝑚𝑎𝑡𝑖𝑜𝑛 𝑐𝑟𝑖𝑡𝑒𝑟𝑖𝑜𝑛 (𝑨𝑰𝑪) = χ 𝑚𝑜𝑑𝑒𝑙 2 − 2𝑑𝑓 𝑚𝑜𝑑𝑒𝑙 𝑐𝑜𝑛𝑠𝑖𝑠𝑡𝑒𝑛𝑡 𝐴𝑘𝑎𝑖𝑘𝑒 𝑖𝑛𝑓𝑜𝑟𝑚𝑎𝑡𝑖𝑜𝑛 𝑐𝑟𝑖𝑡𝑒𝑟𝑖𝑜𝑛 (𝑪𝑨𝑰𝑪) = χ 𝑚𝑜𝑑𝑒𝑙 2 − (𝑙𝑛𝑁 + 1)2𝑑𝑓 𝑚𝑜𝑑𝑒𝑙
  • 17. Residual-based fit indices  Average difference between sample and estimated population variance-covariance 𝑟𝑜𝑜𝑡 𝑚𝑒𝑎𝑛 𝑠𝑞𝑢𝑎𝑟𝑒 𝑟𝑒𝑠𝑖𝑑𝑢𝑎𝑙 𝑹𝑴𝑹 = 2 𝑖=1 𝑞 𝑗=1 𝑖 𝑠𝑖𝑗 − 𝜎𝑖𝑗 2 𝑞 𝑞 + 1 1 2
  • 18. Recommended value of index Index Value χ2 N.S. Χ2/df <2 (3) NFI >.95 (.90) NNFI >.95 (.90) IFI >.95 (.90) CFI >.95 (.90) GFI >.90 AGFI >.90 PGFI >.90 AIC Small CAIC Small RMSEA <.05 (.06) SRMR <.08
  • 19. What indices should be presented?  Diamantopoulo & Siguaw (2000)  χ2, χ2/df, RMSEA, SRMR, GFI/AGFI, CFI, ECVI  Hoyle & Panter (1995)  χ2, χ2/df, GFI/AGFI, CFI, NNFI, IFI, RNI
  • 20. Model modification  Chi-square difference test  (χ2 2 − χ1 2 )/(𝑑𝑓2 − 𝑑𝑓1)  Lagrange multiplier (LM) test  Add parameters  Wald test  Delete parameters
  • 22. Application of SEM  Measurement model  Confirmatory factor analysis (CFA) x1 x3 x2 δ1 δ 2 δ 3 ξ1 λ11 λ21 λ31 x1= λ11 ξ1+ δ1 x2= λ21 ξ1+ δ2 x3= λ31 ξ1+ δ3
  • 23. Indices  Goodness-of fit  Factor loading (λ >.70)  R2  Convergent validity  Composite reliability  𝜌𝑐 = λ 2 λ 2+ 𝜃  Average variance extracted (AVE)  𝜌 𝑣 = λ2 λ 2+ 𝜃  Discriminant validity
  • 25. 運動團隊默契量表的效化檢驗  運動團隊默契會反應在三種向度上,分別是正確 的:  1.任務知識  2.能力評價  3.情緒覺察  請進行驗證性因素分析提供進一步的效度證據。
  • 28. SEM data Model 1 Model 2 Model 3 Model n Which one fits better ?
  • 29. Nested model Saturated model Model 1 Model 2 Model 3 Parent model or Full model all parameters are freely estimated restriction nested in restriction nested in restriction nested in χ2 、df ↑
  • 30. Nested model fixed path in structure model x1 x2 x3 perceived control behavior y1 y2 y3 x4 x5 x6 intention C, 0
  • 31. Nested model fixed loading in measurement model x1 x2 x3 ξ perceived control x4 x5 x6 ξ intention x1 x2 x3 ξ perceived control x4 x5 x6 ξ intention a a b b
  • 32. Nested model fixed correlation between latent variables in measurement model x1 x2 x3 ξ perceived control x4 x5 x6 ξ intention x1 x2 x3 ξ perceived control x4 x5 x6 ξ intention C, 0
  • 33. Which one fits better?  Nested model  △χ2 test  Target coefficient  Initial model χ𝑖 2  Restricted model χ 𝑟 2  T= χ𝑖 2 / χ 𝑟 2  Non-nested model  AIC  CAIC
  • 34. Parsimonious purpose  General concept and multiple dimensions  1 order  2 order  Nested model  Required number of lower order dimension  >3  3 (equivalent model)
  • 36. 控制型教練領導行為量表的效化檢驗  根據相關學理,教練的控制傾向會反應在四種向度 上,分別是:  1.酬賞控制  2.有條件式的關愛  3.威嚇  4.過度控制  研究生康挫依中文化了控制型領導行為量表,請幫 他進行驗證性因素分析提供進一步的效度證據。
  • 38. Generalization model data 1 Population 1 fit fit Can we generalize the psychological phenomenon of P1 to P2 ? Population 2 data 2 are the constructs comparable between the two populations? (mean, variance, covariance or correlation)
  • 39. Measurement invariance  Measurement equivalence  Construct comparability  Advantage  Identical operational definition  Generalizability  Minimize bias (culture, translation, or survey)  However…
  • 40. So, how  Multiple group mean and covariance structure analysis (MACS)(Little, 1997)  Parameters (Meredith, 1993)  Configural invariance  Weak factorial invariance  Strong factorial invariance  Strict factorial invariance  Structural invariance
  • 41. Configural invariance  Baseline model 𝑌1 = 𝑏0 + 𝑏11 𝑋1 + 𝑏21 𝑋2 + ⋯ + 𝑏 𝑝1 𝑋 𝑝 + 𝑒1 𝑌𝑞 = 𝑏0 + 𝑏1𝑞 𝑋1 + 𝑏2𝑞 𝑋2 + ⋯ + 𝑏 𝑝𝑞 𝑋 𝑝 + 𝑒 𝑞 ⋮⋮ ⋮ ⋮ ⋮ intercept (mean) slope (loading) error (Meredith, 1993)
  • 42. Weak factorial invariance 𝜦 𝟏 = 𝜦 𝟐  Measurement weight 𝑌1 = 𝑏0 + 𝑏11 𝑋1 + 𝑏21 𝑋2 + ⋯ + 𝑏 𝑝1 𝑋 𝑝 + 𝑒1 𝑌𝑞 = 𝑏0 + 𝑏1𝑞 𝑋1 + 𝑏2𝑞 𝑋2 + ⋯ + 𝑏 𝑝𝑞 𝑋 𝑝 + 𝑒 𝑞 ⋮⋮ ⋮ ⋮ ⋮ intercept (mean) slope (loading) error (Meredith, 1993)
  • 43. Strong factorial invariance 𝝉 𝟏 = 𝝉 𝟐  Mean 𝑌1 = 𝑏0 + 𝑏11 𝑋1 + 𝑏21 𝑋2 + ⋯ + 𝑏 𝑝1 𝑋 𝑝 + 𝑒1 𝑌𝑞 = 𝑏0 + 𝑏1𝑞 𝑋1 + 𝑏2𝑞 𝑋2 + ⋯ + 𝑏 𝑝𝑞 𝑋 𝑝 + 𝑒 𝑞 ⋮⋮ ⋮ ⋮ ⋮ intercept (mean) slope (loading) error (Meredith, 1993)
  • 44. Strict factorial invariance 𝜽 𝟏 = 𝜽 𝟐  Measurement residual 𝑌1 = 𝑏0 + 𝑏11 𝑋1 + 𝑏21 𝑋2 + ⋯ + 𝑏 𝑝1 𝑋 𝑝 + 𝑒1 𝑌𝑞 = 𝑏0 + 𝑏1𝑞 𝑋1 + 𝑏2𝑞 𝑋2 + ⋯ + 𝑏 𝑝𝑞 𝑋 𝑝 + 𝑒 𝑞 ⋮⋮ ⋮ ⋮ ⋮ intercept (mean) slope (loading) error (Meredith, 1993)
  • 45. Structural invariance 𝝋 𝟏 = 𝝋 𝟐  Variance and covariance 𝑌1 = 𝑏0 + 𝑏11 𝑋1 + 𝑏21 𝑋2 + ⋯ + 𝑏 𝑝1 𝑋 𝑝 + 𝑒1 𝑌𝑞 = 𝑏0 + 𝑏1𝑞 𝑋1 + 𝑏2𝑞 𝑋2 + ⋯ + 𝑏 𝑝𝑞 𝑋 𝑝 + 𝑒 𝑞 ⋮⋮ ⋮ ⋮ ⋮ intercept (mean) slope (loading) error (Meredith, 1993)
  • 46. Model comparison-nested model  Baseline model  𝜦 𝟏 = 𝜦 𝟐  𝜦 𝟏 = 𝜦 𝟐 + 𝝉 𝟏 = 𝝉 𝟐  𝜦 𝟏 = 𝜦 𝟐 + 𝝉 𝟏 = 𝝉 𝟐 + 𝜽 𝟏 = 𝜽 𝟐  𝜦 𝟏 = 𝜦 𝟐 + 𝝉 𝟏 = 𝝉 𝟐 + 𝜽 𝟏 = 𝜽 𝟐 + 𝝋 𝟏 = 𝝋 𝟐 (Meredith, 1993) Configural invariance Weak factorial invariance Strong factorial invariance Strict factorial invariance Structural invariance
  • 47. Which one fits better?  Nested model  △χ2 test  Fit index (Cheug & Rensvold, 2002; Little, 1997; McGaw & Joredkog, 1971)  △ NNFI <.05 (.02)  △ IFI <.05  △CFI <.01  △RFI <.05
  • 49. 運動正念量表的效化檢驗  根據相關學理,運動員的正念特性會反應在三個 向度上,分別是:  1.覺察  2.再專注  3.不評價  研究生歐芷觀發展了一份測量工具,請幫她進行 性別不變性的檢驗。