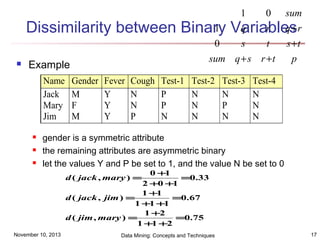
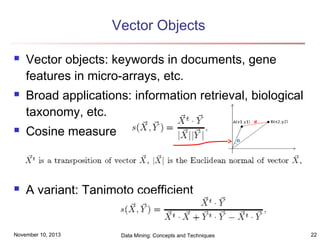
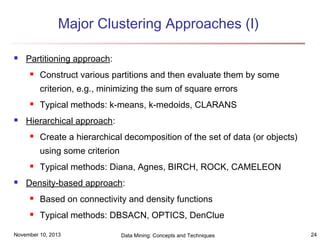
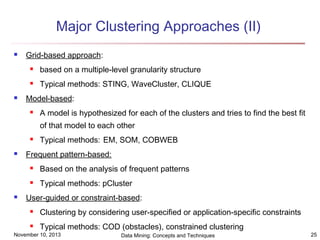
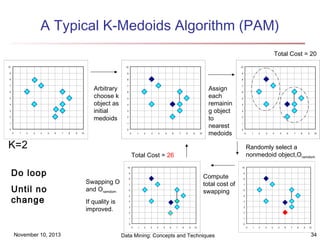
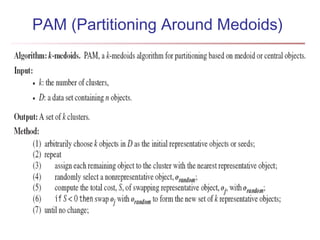
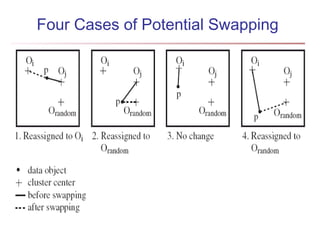
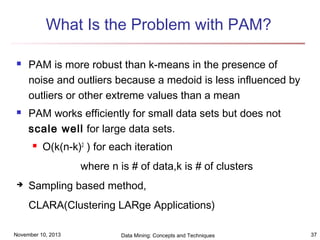
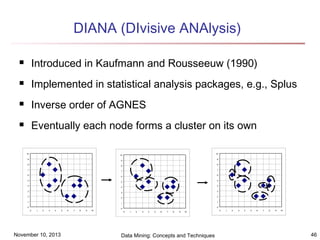
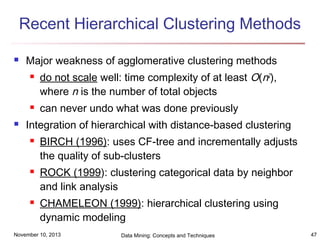
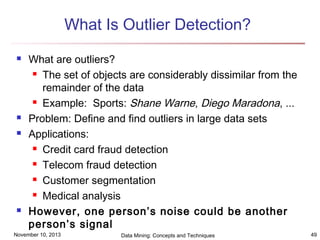
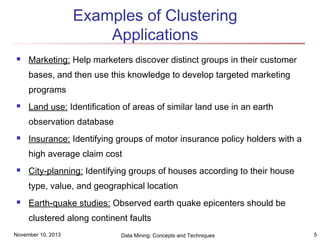
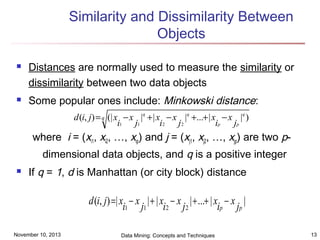
The document discusses cluster analysis and outlier analysis techniques for data mining. It covers key topics such as defining clusters and the goal of cluster analysis, different types of data that can be analyzed via clustering, major categories of clustering methods like partitioning, hierarchical, density-based, and model-based approaches. Specific clustering algorithms discussed include k-means, k-medoids, hierarchical clustering, DBSCAN, and EM. The document provides examples of clustering applications and discusses evaluating clustering quality and requirements for clustering in data mining.
Chapter - 7 Data Mining Concepts and Techniques 2nd Ed slides Han & Kambererror007
The document describes chapter 7 of the book "Data Mining: Concepts and Techniques" which covers cluster analysis. The chapter discusses what cluster analysis is, different types of data that can be analyzed, major clustering methods like partitioning, hierarchical, and density-based methods. It also covers measuring cluster quality, requirements for clustering in data mining, and how to calculate similarity and dissimilarity between data objects.
Data Mining: Concepts and Techniques — Chapter 2 —Salah Amean
the presentation contains the following :
-Data Objects and Attribute Types.
-Basic Statistical Descriptions of Data.
-Data Visualization.
-Measuring Data Similarity and Dissimilarity.
-Summary.
This document provides an overview of classification in machine learning. It discusses supervised learning and the classification process. It describes several common classification algorithms including k-nearest neighbors, Naive Bayes, decision trees, and support vector machines. It also covers performance evaluation metrics like accuracy, precision and recall. The document uses examples to illustrate classification tasks and the training and testing process in supervised learning.
Cluster analysis involves grouping data objects into clusters so that objects within the same cluster are more similar to each other than objects in other clusters. There are several major clustering approaches including partitioning methods that iteratively construct partitions, hierarchical methods that create hierarchical decompositions, density-based methods based on connectivity and density, grid-based methods using a multi-level granularity structure, and model-based methods that find the best fit of a model to the clusters. Partitioning methods like k-means and k-medoids aim to optimize a partitioning criterion by iteratively updating cluster centroids or medoids.
Strong Baselines for Neural Semi-supervised Learning under Domain ShiftSebastian Ruder
Oral presentation given at ACL 2018 about our paper Strong Baselines for Neural Semi-supervised Learning under Domain Shift (http://aclweb.org/anthology/P18-1096).
This document discusses data and attributes in data mining. It defines data as a collection of objects and their properties or attributes. Attributes can be nominal, ordinal, interval or ratio. The document describes different types of attributes and data sets, as well as important characteristics like dimensionality and sparsity. It also covers data quality issues, preprocessing techniques like aggregation, sampling and feature selection, and measures of similarity and dissimilarity between data objects.
An Importance Sampling Approach to Integrate Expert Knowledge When Learning B...NTNU
The introduction of expert knowledge when learning Bayesian Networks from data is known to be an excellent approach to boost the performance of automatic learning methods, specially when the data is scarce. Previous approaches for this problem based on Bayesian statistics introduce the expert knowledge modifying the prior probability distributions. In this study, we propose a new methodology based on Monte Carlo simulation which starts with non-informative priors and requires knowledge from the expert a posteriori, when the simulation ends. We also explore a new Importance Sampling method for Monte Carlo simulation and the definition of new non-informative priors for the structure of the network. All these approaches are experimentally validated with five standard Bayesian networks.
Read more:
http://link.springer.com/chapter/10.1007%2F978-3-642-14049-5_70
This document discusses various similarity measures that can be used to quantify the similarity between documents, queries, or a document and query in an information retrieval system. It describes classic measures like Dice coefficient, overlap coefficient, Jaccard coefficient, and cosine coefficient. It provides examples of calculating these measures and compares the relations between different measures. The document also discusses using term-document matrices and shows an example matrix.
Cluster analysis is an unsupervised learning technique that groups similar data objects into clusters. It finds internal structures within unlabeled data by grouping objects based on their characteristics. Clustering is used to gain insight into data distribution and as a preprocessing step for other algorithms. Some applications of clustering include marketing, land use analysis, insurance risk assessment, and city planning. The quality of clustering depends on how well it separates objects within a cluster from objects in other clusters. Hierarchical clustering creates clusters by iteratively merging or splitting groups of objects based on their distances in a dendrogram.
The document discusses classification and prediction techniques in data mining. It begins with an overview of classification vs. prediction and supervised vs. unsupervised learning. It then covers specific classification techniques like decision trees, Bayesian classification, rule-based classification and support vector machines. It provides details on Bayesian classification including the Bayesian theorem and how naive Bayesian classification works. It discusses issues in evaluating classification methods and gives examples of Bayesian classification.
Cluster analysis is a technique used to group objects into clusters based on similarities. There are several major approaches to cluster analysis including partitioning methods, hierarchy methods, density-based methods, and grid-based methods. Partitioning methods construct partitions of the data objects into a set number of clusters by optimizing a chosen criterion, such as k-means and k-medoids clustering algorithms.
Lazy learning is a machine learning method where generalization of training data is delayed until a query is made, unlike eager learning which generalizes before queries. K-nearest neighbors and case-based reasoning are examples of lazy learners, which store training data and classify new data based on similarity. Case-based reasoning specifically stores prior problem solutions to solve new problems by combining similar past case solutions.
Cluster analysis is an unsupervised learning technique used to group unlabeled data points into meaningful clusters. There are several approaches to cluster analysis including partitioning methods like k-means, hierarchical clustering methods like agglomerative nesting (AGNES), and density-based methods like DBSCAN. The quality of clusters is evaluated based on intra-cluster similarity and inter-cluster dissimilarity. Cluster analysis has applications in fields like pattern recognition, image processing, and market segmentation.
This document provides an overview of the Grade 8 Mathematics Assessment for the Texas Essential Knowledge and Skills (TEKS) student curriculum. It is divided into 5 reporting categories covering various mathematics concepts. Each category lists the associated TEKS standards describing what students are expected to learn and be assessed on. These include topics like numbers and operations, patterns and algebra, geometry, measurement, probability, and statistics. Underlying processes and mathematical tools are also covered that apply to solving problems across various disciplines.
Factors are categorical variables. The sums of the values of these variables are called levels. In this talk, we consider the variable selection problem where the set of potential predictors contains both factors and numerical variables. Formally, this problem is a particular case of the standard variable selection problema, where factors are coded using dummy variables. As such, the Bayesian solution would be straightforward and, possibly because of this, the problem. Despite its importance, this issue has not received much attention in the literature. Nevertheless, we show that this perception is illusory and that in fact several inputs, like the assignment of prior probabilities over the model space or the parameterization adopted for factors may have a large (and difficult to anticipate) impact on the results. We provide a solution to these issues that extends the proposals in the standard variable selection problem and does not depend on how the factors are coded using dummy variables. Our approach is illustrated with a real example concerning a childhood obesity study in Spain.
Authors: Gonzalo Garcia-donato and Rui Paulo
Document ranking using qprp with concept of multi dimensional subspacePrakash Dubey
This presentation discusses a project titled "Document Ranking Using QPRP with Concept of Multi-Dimensional Subspace". It was presented by Prakash Kumar Dubey and guided by Mr. Sourish Dhar and Mr. Bhagaban Swain of the Department of IT. The presentation provides an overview of the project, including an introduction to information retrieval, classical IR models such as Boolean, vector space, and probabilistic models. It then discusses quantum probability and how it can be applied to document ranking. The presentation outlines the proposed solution, data collection and implementation, and concludes with future work.
Graph Neural Network for Phenotype Predictiontuxette
This document describes a study on using graph neural networks (GNNs) for phenotype prediction from gene expression data. The objectives are to determine if including network information can improve predictions, which network types work best, and if GNNs can learn network inferences. It provides background on GNNs and how they generalize convolutional layers to graph data. The authors implemented a GNN model from previous work as a starting point and tested it on different network types to see which network information is most useful for predictions. Their methodology involves comparing GNN performance to other methods like random forests using 10-fold cross validation.
This tutorial covers machine learning approaches for learning to rank documents in information retrieval systems. It discusses how early IR methods did not incorporate machine learning. It then covers: (1) ordinal regression approaches that learn multiple thresholds to account for the ordered nature of relevance labels; (2) optimizing pairwise preferences between documents, which decomposes the problem and allows for efficient algorithms; (3) directly optimizing rank-based evaluation measures like MAP and NDCG using structural SVMs, boosting, or smooth approximations to allow for gradient descent optimization of discontinuous objectives. The goal is to outperform traditional IR methods by applying machine learning techniques to learn good ranking functions.
The document discusses discretization, which is the process of converting continuous numeric attributes in data into discrete intervals. Discretization is important for data mining algorithms that can only handle discrete attributes. The key steps in discretization are sorting values, selecting cut points to split intervals, and stopping the process based on criteria. Different discretization methods vary in their approach, such as being supervised or unsupervised, and splitting versus merging intervals. The document provides examples of discretization methods like K-means and minimum description length, and discusses properties and criteria for evaluating discretization techniques.
Decision trees are a type of supervised learning algorithm used for classification and regression. ID3 and C4.5 are algorithms that generate decision trees by choosing the attribute with the highest information gain at each step. Random forest is an ensemble method that creates multiple decision trees and aggregates their results, improving accuracy. It introduces randomness when building trees to decrease variance.
Reproducibility and differential analysis with selfishtuxette
Selfish is a Python tool for identifying differentially interacting chromatin regions from Hi-C contact maps of two conditions with no replicates. It begins by distance-correcting the interaction frequencies. It then computes Gaussian filters over neighboring bins to capture spatial dependencies. It compares the evolution of these filters between conditions and assigns p-values assuming Gaussian differences. Selfish is faster than existing methods and shows enrichment for epigenetic markers near differential regions. However, its statistical justification could be improved as it does not model overdispersion like other methods.
Fundementals of Machine Learning and Deep Learning ParrotAI
Introduction to machine learning and deep learning to beginners.Learn the applications of machine learning and deep learning and how ti can solve different problems
Text Classification, Sentiment Analysis, and Opinion MiningFabrizio Sebastiani
This document discusses text classification and provides an overview of the key concepts. It defines text classification as predicting which predefined category a text belongs to. Popular applications include filtering emails and news articles. The document outlines supervised learning as the main approach, where a classifier is trained on manually classified examples to learn how to categorize new texts. It also covers representing texts as vectors for classification, including feature extraction, selection, and weighting. Common supervised learning algorithms mentioned are support vector machines, boosted decision stumps, random forests and naive Bayesian methods.
The document summarizes key points from the book "Outliers" by Malcolm Gladwell. It discusses how successful people are often outliers who received opportunities they did not create through birth advantages like timing and family legacy. The 10,000 hour rule is mentioned, where mastery takes extensive practice over many years. Examples are given of celebrities and technology pioneers who achieved success later in life after extensive experience in their fields.
Outlier analysis is used to identify outliers, which are data objects that are inconsistent with the general behavior or model of the data. There are two main types of outlier detection - statistical distribution-based detection, which identifies outliers based on how far they are from the average statistical distribution, and distance-based detection, which finds outliers based on how far they are from other data objects. Outlier analysis is useful for tasks like fraud detection, where outliers may indicate fraudulent activity that is different from normal patterns in the data.
Outlier analysis identifies outliers, which are data objects that are grossly different from or inconsistent with the remaining set of data. Outliers can be identified using statistical, distance-based, density-based, or deviation-based approaches. Statistical approaches assume an underlying data distribution and identify outliers based on significance probabilities. Distance-based approaches identify outliers as objects with too few neighbors within a given distance. Density-based approaches identify local outliers based on local density comparisons. Deviation-based approaches identify outliers as objects that deviate from the main characteristics of their data group.
Outlier analysis is used to identify outliers, which are data objects that are inconsistent with the general behavior or model of the data. There are two main types of outlier detection - statistical distribution-based detection, which identifies outliers based on how far they are from the average statistical distribution, and distance-based detection, which finds outliers based on how far they are from other data objects. Outlier analysis is useful for tasks like fraud detection, where outliers may indicate fraudulent activity that is different from normal patterns in the data.
This document summarizes a research paper on class outlier mining, which aims to identify rare or unusual cases within individual classes of labeled data rather than across an entire dataset. It presents an approach to class outlier mining based on calculating distances between data points to find exceptions within each class. The abstract also outlines that the paper will provide an overview of the concept of class outliers and the distance-based approach presented in the full paper.
This document describes Amr Koura's work in implementing and comparing batch and incremental modes of the Local Outlier Factor (LOF) algorithm. The goals were to code LOF in batch and incremental modes, integrate the code into an open source project, and compare the two modes. Incremental LOF was found to have equivalent outlier detection performance to static LOF while requiring less computation time and having lower computational complexity of O(N log N).
This chapter discusses various methods for outlier detection in data mining, including statistical approaches that assume normal data fits a statistical model, proximity-based approaches that identify outliers as objects far from their nearest neighbors, and clustering-based approaches that find outliers as objects not belonging to large clusters. It also covers classification and semi-supervised approaches, detecting contextual and collective outliers, and challenges in high-dimensional outlier detection.
Il presente articolo spiega come di fronte alla crisi economica e finanziaria mondiale, la rete di impresa, può costituire una forma organizzativa di successo in grado dare slancio all’economia nazionale ed europea. Le reti d’impresa innovative si fondano sulla fiducia reciproca fra i partner. Esse vengono create nel tempo e favoriscono la circolazione dell’informazione, la diffusione della conoscenza e la generazione dell’innovazione. La fiducia, inoltre, riduce l’incertezza e i costi di transazione e limita i comportamenti opportunistici da parte di agenti free-rider. Tuttavia, il successo di tali forme organizzative dipende non solo da tali processi ma anche dall’interplay tra le imprese e le istituzioni politiche e dalle loro interazioni con il sistema formativo di ricerca. Con la legge 33/2009 il legislatore italiano ha disciplinato il «contratto di rete» come uno strumento attraverso il quale due o più imprese possono esercitare in comune una o più attività economiche allo scopo di accrescere la reciproca capacità innovativa e la competitività sul mercato. Tale contratto, affiancandosi ai tradizionali strumenti di promozione della collaborazione tra imprese, ha permesso di superare la logica dei cd. distretti territoriali, e senza incidere sull’autonomia delle singole imprese può permettere a quest’ultime di effettuare una cooperazione più snella e flessibile. Inoltre, la legge 11 novembre 2011, n. 180 disciplina la partecipazione delle reti di impresa nell’ambito delle procedure per l’aggiudicazione di contratti pubblici. Così facendo si è cercato di abbattere alcune barriere all’entrata che impedivano l’accesso agli appalti pubblici delle micro, piccole e medie imprese. Il presente articolo, inoltre effettua delle considerazioni sull’efficacia dell’intervento pubblico a favore delle reti di impresa e sottolinea l’importanza di diversi fattori tra i quali le diversità territoriali e le esigenze di innovazione, flessibilità e di efficienza imposte dalla competitività internazionale
Il turismo ha sempre avuto e continuerà ad avere nel futuro un grandissimo potenziale dal punto di vista culturale, politico ed economico. In Italia, malgrado la numerosa letteratura specialistica e la ricchezza delle proprie risorse naturali e culturali, il turismo resta rilegato a un ruolo di secondo ordine tra le priorità dei policy maker e non riesce ad esercitare quella funzione di sviluppo che gli spetterebbe sia rispetto alla questione dei grandi poli turistici e culturali di attrazione sia e soprattutto rispetto al patrimonio diffuso nei territori c.d. minori. L’articolo intende suggerire i principali tratti di un percorso di sviluppo sostenibile attraverso l’analisi dei territori c.d. minori e/o lenti. Allontanandoci da una visione esclusivamente economicistica si possono, infatti, individuare nuove traiettorie di sviluppo sostenibile in cui le identità territoriali, la storia locale, il capitale sociale, il patrimonio culturale e umano, diventano fattori strategici ed innovativi di qualsiasi politica di sviluppo sostenibile. Tali fattori possono essere quindi le pre-condizioni in grado di generare innovazione e sviluppo in un territorio. In definitiva l’articolo propone l’ipotesi di un sentiero di sviluppo sostenibile da parte dei c.d. territori minori o lenti attraverso l’adesione ad un modello di sviluppo fondato sullo stretto legame tra heritage e turismo, tra valore della cultura e del territorio e rigenerazione socio-economica, tra tradizione ed innovazione in un approccio distrettuale in cui il territorio, con la sua storia, tradizioni, identità costituisce un valore competitivo difficilmente riproducibile
This short document contains a link and encourages the reader to click on it to obtain an unspecified something. No other context or information is provided about what would be obtained by clicking the link or why the reader should click on it.
HI-TECH is an ISO certified Indian company that specializes in clean air and containment facilities for operating theaters. It prides itself on manufacturing high-quality products using the latest techniques to ensure reliability and long life. HI-TECH offers laminar airflow units, isolation rooms, and other modular operating theater equipment to help prevent infections in hospitals and meet various industry standards. It has numerous hospital and clinic customers throughout India that rely on its equipment.
The document displays the results of a content analysis of primary documents. It shows the frequency counts of four codes - "ecomomia", "familia", "govierno", and "piden un favor yo si les colab" - across three primary documents and totals. A bar graph is also included comparing the frequency of the four codes across the three documents.
Mentre a livello europeo non manca una rete di salvaguardia dei diritti sociali in via giurisdizionale, è pressocchè assente uno strumentario di realizzazione positiva dei diritti sociali, in virtù della stessa natura sussidiaria dell’azione comunitaria e del principio delle materie attribuite. La realizzazione dei diritti sociali resta di esclusiva competenza degli Stati, per i quali i principi ed i valori in senso sociale e solidale sono un vincolo costituzionale prioritario all’azione di governo. Il Trattato sull’Unione pone invece sullo stesso piano i vari aspetti dell’Europa unita: libero mercato e finalità sociali e solidali. Ciò ha consentito all’Europa, soprattutto negli ultimi anni di forte crisi economica, di scegliere tra i suoi obiettivi “costituzionali” uno in particolare che ha valorizzato a danno degli altri: il libero mercato, la stabilità economica e monetaria a discapito della coesione economica sociale e della solidarietà territoriale, mettendo in serio dubbio la natura personalista della “costituzione europea”. L’Euro sembra avere assunto a livello comunitario quella posizione centrale che nelle Costituzioni degli Stati è assegnata alla persona. La vocazione rigorista è testimoniata d’altronde, dall’adozione del Fiscal compact. Tutto ciò ha finito per condizionare la capacità di manovra degli Stati in ordine alle politiche di spesa, sia in termini di messa in campo di ammortizzatori sociali, come anche in termini di politiche pubbliche di spinta verso la crescita economica. Se è vero che nel breve termine il peso degli oneri economici implicati dalla garanzia di un quadro di diritti sociali si risolve in gap di competitività, è anche vero che tale sistema di coesione sociale, se adeguatamente valorizzato nell’Unione, potrebbe assicurare una più solida tenuta della società europea rispetto a quelle realtà, pure produttive, ma prive di un quadro ordinamentale di tutela dei diritti sociali. Dal punto di vista costituzionale, ciò implica che si passi a livello europeo da una “Costituzione materiale” Eurocentrica ad un indirizzo politico costituzionale dell’Unione di piena valorizzazione della vocazione sociale propria del Trattato di Lisbona
The changes characterizing the relations between the member States of the International Community and those existing between national law and International law produce a reflection on the dichotomy between monism and dualism.
It is indisputable fact that recently we assist to a clear prevalence of an International law that produces direct effects within the member States and their national legal system positively considered, beyond any question relative to the necessary or non “coincidence” between internal and international legal phenomenon, and beyond any ascertainment relative to a supposed (and often inexistent) legitimacy of this prevalence of one over the other, as well as of the diversity and different right to legitimacy of the relative legal sources.
In this context, the European Union law has, de facto gone beyond any question of contrast between dualism and monism (question that is not at all unclear being, legally talking, the European Union at all effects, an International law sub specie of third grade international norms) with consequent removal of the legal sources from the traditional schemes of modern democracies, thus causing distortion of the guarantee functions of the political-constitutional structures of the States.
Under this specific aspect, therefore, emerges a kind of colonization of member States by the European Union considering that the States, apparently and legally free to withdraw from contractual obligations (those descending from the constitutive Treaties), politically – and specially economically – are deprived of any capacity to self-determination or any possible re-exercise of their sovereign competencies.
In other terms, with due respect for any consideration concerning monism or dualism, the European Union has become an instrument of that authoritative monism which considers legislative function an instrument at service of technocratic oligarchies, completely free of any democratic legitimacy.
In this context, the weakening of the State’s sovereignty is the direct and immediate consequence and the governments of the member States, therefore, exercise their political jurisdiction only apparently, given that, in substance, the European Union, betraying the founding pact, is (self)invested of instruments and competencies which go beyond of those initially delegated by the member States, mining or impeding the free exercise of their sovereignties
La crescente importanza che lo sport ha assunto sia a livello nazionale sia a livello mondiale, ha di fatto reso necessario integrarne la regolamentazione. Gli interessi sociali, politici ed economici che ne sono a fondamento, hanno reso lo sport uno degli strumenti più forti e altamente strategici per la cooperazione tra gli Stati.
In via preliminare, la dottrina si è occupata della tutela dell’uomo in quanto portatore di diritti civili, politici, economici, sociali e culturali. In un secondo momento, vista l’enorme rilevanza assunta nel tempo dal fenomeno in esame, ci si è occupati di dare voce anche a quei diritti che, per molti studiosi, sono il mezzo per perseguire la pace universale, ovvero i diritti allo sviluppo, alla solidarietà, all’ambiente sano e alla comunicazione e, fra questi, vi è incluso anche il diritto allo sport.
La codificazione iniziata alla fine del XIX secolo, ha subito innumerevoli mutamenti, tesi alla salvaguardia delle nuove esigenze della società contemporanea. A ciò si aggiunga il determinante contributo dell’Unione Europea all’orientamento strategico sul ruolo dello sport, un impegno che ha rafforzato in modo deciso quanto in passato era già stato compiuto.
Il valore e il ruolo sociale dello Sport, sviluppatisi nel tempo, hanno reso necessaria una più puntuale regolamentazione, al fine di evitare il diffondersi del fenomeno del commercio di sostanze dopanti e promuovere i valori fondamentali di rispetto e di giustizia nei confronti di ogni essere umano, senza distinzioni di razza, di colore, di sesso, di lingua, di religione, di opinione politica o di altro genere, di origine nazionale o sociale, di ricchezza, di nascita o di altra condizione.
L’articolo si propone inquadrare la situazione in termini prevalentemente giuridici, non trascurando considerazioni che, a nostro parere, sono necessarie per meglio rafforzare il quadro giuridico entro cui il fenomeno indagato va collocato
HI-TECH is an ISO 9001:2008 certified Indian company that specializes in clean air and containment facilities for bio-tech industries. The company takes pride in manufacturing high quality products using the latest techniques to ensure long life. Their range of products include laminar air flow cabinets, glass bead sterilizers, air curtains, and fan filter units. They are confident they can provide a competitive solution to meet various customer needs and requirements. Key products include laminar air flow cabinets, glass bead sterilizers, pass boxes, and fan filter units for class 100,000. The company serves various clients in India including government organizations and private industries.
This document discusses different clustering methods in data mining. It begins by defining cluster analysis and its applications. It then categorizes major clustering methods into partitioning methods, hierarchical methods, density-based methods, grid-based methods, and model-based clustering methods. Finally, it provides details on partitioning methods like k-means and k-medoids clustering algorithms.
This document provides an overview of cluster analysis techniques. It discusses different types of data that can be used for cluster analysis, including interval-scaled, binary, nominal, ordinal and ratio variables. It also categorizes major clustering methods into partitioning methods, hierarchical methods, density-based methods, grid-based methods and model-based methods. Additionally, it covers measuring the quality of clusters, requirements for clustering in data mining, and calculating distances between clusters.
This document provides an overview of cluster analysis techniques. It discusses different types of data that can be used for cluster analysis, including interval-scaled, binary, nominal, ordinal and ratio variables. It also categorizes major clustering methods into partitioning methods, hierarchical methods, density-based methods, grid-based methods and model-based methods. Finally, it discusses calculating distances between clusters.
This document discusses cluster analysis and clustering methods. It begins by defining cluster analysis and describing its goal of grouping similar data objects into clusters. It then categorizes major clustering methods into partitioning methods, hierarchical methods, density-based methods, grid-based methods, and model-based methods. Finally, it discusses calculating distances between data objects and clusters.
Cluster analysis is an unsupervised machine learning technique that groups similar data objects into clusters. It finds internal structures within unlabeled data by partitioning it into groups based on similarity. Some key applications of cluster analysis include market segmentation, document classification, and identifying subtypes of diseases. The quality of clusters depends on both the similarity measure used and how well objects are grouped within each cluster versus across clusters.
This document provides an overview of cluster analysis techniques. It begins by defining cluster analysis and its applications. It then categorizes major clustering methods into partitioning methods (like k-means and k-medoids), hierarchical methods, density-based methods, grid-based methods, and model-based methods. The document discusses different data types that can be clustered and measures for determining cluster quality. It also outlines requirements for effective clustering in data mining.
This document discusses various techniques for analyzing and visualizing data to gain insights. It covers data attribute types, basic statistical descriptions to understand data distribution and outliers, different visualization methods to discover patterns and relationships, and various ways to measure similarity between data objects, including distances, coefficients, and cosine similarity for text. The goal is to preprocess and understand data at a high level before applying more advanced analytics.
The document discusses chapter 8 of a textbook on data mining concepts and techniques. It covers various topics related to cluster analysis, including what cluster analysis is, different types of data that can be used for cluster analysis, major categories of clustering methods like partitioning, hierarchical, density-based, grid-based, and model-based methods. It also discusses outlier analysis and provides examples of clustering applications.
This document provides an overview of clustering techniques. It discusses what clustering is, different types of attributes that can be clustered, and major clustering approaches. The major approaches covered are partitioning algorithms, which construct partitions and evaluate them; hierarchical algorithms, which create a hierarchical decomposition; and density-based algorithms, which are based on connectivity and density. Examples of applications are also provided.
The document summarizes key concepts from Chapter 8 of the textbook "Data Mining: Concepts and Techniques" which covers cluster analysis. It discusses different types of data that can be used for cluster analysis as well as major clustering methods including partitioning, hierarchical, density-based, grid-based, and model-based approaches. Specific partitioning algorithms covered are k-means and k-medoids clustering.
FUNCTION OF RIVAL SIMILARITY IN A COGNITIVE DATA ANALYSIS Maxim Kazantsev
The document discusses the use of a rival similarity function (FRiS) in cognitive data analysis and machine learning algorithms. FRiS measures the similarity of an object to one object over another, and accounts for locality, normality, invariance and other properties. The authors describe how FRiS can be used to improve algorithms for tasks like classification, feature selection, filling in missing data, and ordering objects. They provide examples of algorithms like FRiS-Class that apply FRiS to problems involving clustering and taxonomy. Evaluation on real datasets shows these FRiS-based algorithms outperform other common methods.
- What is Clustering, Honeypots and Density Based Clustering?
- What is Optics Clustering and how is it different than DB Clustering? …and how
can it be used for outlier detection.
- What is so-called soft clustering and how is it different than clustering? …and how
can it be used for outlier detection.
Data Tactics Data Science Brown Bag (April 2014)Rich Heimann
This is a presentation we perform internally every quarter as part of our Data Science Brown Bag Series. This presentation was talking about different types of soft clustering techniques - all of which the team currently performs depending on the complexity of the data and the complexity of customer problems. If you are interested in learning more about working with L-3 Data Tactics or interested in working for the L-3 Data Tactics Data Science team please contact us soon! Thank you.
The document provides information about the syllabus for the Data Analytics (KIT-601) course. It includes 5 units that will be covered: Introduction to Data Analytics, Data Analysis techniques including regression modeling and multivariate analysis, Mining Data Streams, Frequent Itemsets and Clustering, and Frameworks and Visualization. It lists the course outcomes and Bloom's taxonomy levels. It also provides details on the topics to be covered in each unit, including proposed lecture hours, textbooks, and an evaluation scheme. The syllabus aims to discuss concepts of data analytics and apply techniques such as classification, regression, clustering, and frequent pattern mining on data.
This document discusses cluster analysis and its various techniques. It begins by defining cluster analysis and outlining the major categories of clustering methods, including partitioning, hierarchical, density-based, grid-based, and model-based methods. It then discusses the types of data that can be used for cluster analysis and how to measure similarity and dissimilarity between data objects. The document also covers considerations for different data types, such as how to handle binary, nominal, ordinal, and ratio-scaled variables. It concludes by discussing what constitutes good clustering and requirements for clustering in data mining.
The document discusses cluster analysis and various clustering methods. It begins with defining what cluster analysis is and some key concepts. It then discusses different types of applications of cluster analysis. Next, it covers different data types and how to calculate distances between data points for different attribute types. Finally, it provides an overview of major clustering methods including partitioning methods, hierarchical methods, density-based methods, grid-based methods, and model-based methods.
Goodbye Windows 11: Make Way for Nitrux Linux 3.5.0!SOFTTECHHUB
As the digital landscape continually evolves, operating systems play a critical role in shaping user experiences and productivity. The launch of Nitrux Linux 3.5.0 marks a significant milestone, offering a robust alternative to traditional systems such as Windows 11. This article delves into the essence of Nitrux Linux 3.5.0, exploring its unique features, advantages, and how it stands as a compelling choice for both casual users and tech enthusiasts.
Programming Foundation Models with DSPy - Meetup SlidesZilliz
Prompting language models is hard, while programming language models is easy. In this talk, I will discuss the state-of-the-art framework DSPy for programming foundation models with its powerful optimizers and runtime constraint system.
Sudheer Mechineni, Head of Application Frameworks, Standard Chartered Bank
Discover how Standard Chartered Bank harnessed the power of Neo4j to transform complex data access challenges into a dynamic, scalable graph database solution. This keynote will cover their journey from initial adoption to deploying a fully automated, enterprise-grade causal cluster, highlighting key strategies for modelling organisational changes and ensuring robust disaster recovery. Learn how these innovations have not only enhanced Standard Chartered Bank’s data infrastructure but also positioned them as pioneers in the banking sector’s adoption of graph technology.
GraphSummit Singapore | The Future of Agility: Supercharging Digital Transfor...Neo4j
Leonard Jayamohan, Partner & Generative AI Lead, Deloitte
This keynote will reveal how Deloitte leverages Neo4j’s graph power for groundbreaking digital twin solutions, achieving a staggering 100x performance boost. Discover the essential role knowledge graphs play in successful generative AI implementations. Plus, get an exclusive look at an innovative Neo4j + Generative AI solution Deloitte is developing in-house.
HCL Notes and Domino License Cost Reduction in the World of DLAUpanagenda
Webinar Recording: https://www.panagenda.com/webinars/hcl-notes-and-domino-license-cost-reduction-in-the-world-of-dlau/
The introduction of DLAU and the CCB & CCX licensing model caused quite a stir in the HCL community. As a Notes and Domino customer, you may have faced challenges with unexpected user counts and license costs. You probably have questions on how this new licensing approach works and how to benefit from it. Most importantly, you likely have budget constraints and want to save money where possible. Don’t worry, we can help with all of this!
We’ll show you how to fix common misconfigurations that cause higher-than-expected user counts, and how to identify accounts which you can deactivate to save money. There are also frequent patterns that can cause unnecessary cost, like using a person document instead of a mail-in for shared mailboxes. We’ll provide examples and solutions for those as well. And naturally we’ll explain the new licensing model.
Join HCL Ambassador Marc Thomas in this webinar with a special guest appearance from Franz Walder. It will give you the tools and know-how to stay on top of what is going on with Domino licensing. You will be able lower your cost through an optimized configuration and keep it low going forward.
These topics will be covered
- Reducing license cost by finding and fixing misconfigurations and superfluous accounts
- How do CCB and CCX licenses really work?
- Understanding the DLAU tool and how to best utilize it
- Tips for common problem areas, like team mailboxes, functional/test users, etc
- Practical examples and best practices to implement right away
Unlocking Productivity: Leveraging the Potential of Copilot in Microsoft 365, a presentation by Christoforos Vlachos, Senior Solutions Manager – Modern Workplace, Uni Systems
Pushing the limits of ePRTC: 100ns holdover for 100 daysAdtran
At WSTS 2024, Alon Stern explored the topic of parametric holdover and explained how recent research findings can be implemented in real-world PNT networks to achieve 100 nanoseconds of accuracy for up to 100 days.
How to Get CNIC Information System with Paksim Ga.pptxdanishmna97
Pakdata Cf is a groundbreaking system designed to streamline and facilitate access to CNIC information. This innovative platform leverages advanced technology to provide users with efficient and secure access to their CNIC details.
Maruthi Prithivirajan, Head of ASEAN & IN Solution Architecture, Neo4j
Get an inside look at the latest Neo4j innovations that enable relationship-driven intelligence at scale. Learn more about the newest cloud integrations and product enhancements that make Neo4j an essential choice for developers building apps with interconnected data and generative AI.
Infrastructure Challenges in Scaling RAG with Custom AI modelsZilliz
Building Retrieval-Augmented Generation (RAG) systems with open-source and custom AI models is a complex task. This talk explores the challenges in productionizing RAG systems, including retrieval performance, response synthesis, and evaluation. We’ll discuss how to leverage open-source models like text embeddings, language models, and custom fine-tuned models to enhance RAG performance. Additionally, we’ll cover how BentoML can help orchestrate and scale these AI components efficiently, ensuring seamless deployment and management of RAG systems in the cloud.
In his public lecture, Christian Timmerer provides insights into the fascinating history of video streaming, starting from its humble beginnings before YouTube to the groundbreaking technologies that now dominate platforms like Netflix and ORF ON. Timmerer also presents provocative contributions of his own that have significantly influenced the industry. He concludes by looking at future challenges and invites the audience to join in a discussion.
Building Production Ready Search Pipelines with Spark and MilvusZilliz
Spark is the widely used ETL tool for processing, indexing and ingesting data to serving stack for search. Milvus is the production-ready open-source vector database. In this talk we will show how to use Spark to process unstructured data to extract vector representations, and push the vectors to Milvus vector database for search serving.
Observability Concepts EVERY Developer Should Know -- DeveloperWeek Europe.pdfPaige Cruz
Monitoring and observability aren’t traditionally found in software curriculums and many of us cobble this knowledge together from whatever vendor or ecosystem we were first introduced to and whatever is a part of your current company’s observability stack.
While the dev and ops silo continues to crumble….many organizations still relegate monitoring & observability as the purview of ops, infra and SRE teams. This is a mistake - achieving a highly observable system requires collaboration up and down the stack.
I, a former op, would like to extend an invitation to all application developers to join the observability party will share these foundational concepts to build on:
“An Outlook of the Ongoing and Future Relationship between Blockchain Technologies and Process-aware Information Systems.” Invited talk at the joint workshop on Blockchain for Information Systems (BC4IS) and Blockchain for Trusted Data Sharing (B4TDS), co-located with with the 36th International Conference on Advanced Information Systems Engineering (CAiSE), 3 June 2024, Limassol, Cyprus.
Best 20 SEO Techniques To Improve Website Visibility In SERPPixlogix Infotech
Boost your website's visibility with proven SEO techniques! Our latest blog dives into essential strategies to enhance your online presence, increase traffic, and rank higher on search engines. From keyword optimization to quality content creation, learn how to make your site stand out in the crowded digital landscape. Discover actionable tips and expert insights to elevate your SEO game.
2. Chapter 7. Cluster Analysis
1. What is Cluster Analysis?
2. Types of Data in Cluster Analysis
3. A Categorization of Major Clustering Methods
4. Partitioning Methods
5. Hierarchical Methods
6. Outlier Analysis
7. Summary
November 10, 2013
Data Mining: Concepts and Techniques
2
3. What is Cluster Analysis?
Cluster: a collection of data objects
Similar to one another within the same cluster
Dissimilar to the objects in other clusters
Cluster analysis
Finding similarities between data according to the
characteristics found in the data and grouping similar
data objects into clusters
Unsupervised learning: no predefined classes
Typical applications
As a stand-alone tool to get insight into data distribution
As a preprocessing step for other algorithms
November 10, 2013
Data Mining: Concepts and Techniques
3
4. Clustering: Rich Applications and
Multidisciplinary Efforts
Pattern Recognition
Spatial Data Analysis
Create thematic maps in GIS by clustering feature
spaces
Detect spatial clusters or for other spatial mining tasks
Image Processing
Economic Science (especially market research)
WWW
Document classification
Cluster Weblog data to discover groups of similar
access patterns
November 10, 2013
Data Mining: Concepts and Techniques
4
5. Examples of Clustering
Applications
Marketing: Help marketers discover distinct groups in their customer
bases, and then use this knowledge to develop targeted marketing
programs
Land use: Identification of areas of similar land use in an earth
observation database
Insurance: Identifying groups of motor insurance policy holders with a
high average claim cost
City-planning: Identifying groups of houses according to their house
type, value, and geographical location
Earth-quake studies: Observed earth quake epicenters should be
clustered along continent faults
November 10, 2013
Data Mining: Concepts and Techniques
5
6. Quality: What Is Good Clustering?
A good clustering method will produce high quality
clusters with
high intra-class similarity
low inter-class similarity
The quality of a clustering result depends on both the
similarity measure used by the method and its
implementation
The quality of a clustering method is also measured by its
ability to discover some or all of the hidden patterns
November 10, 2013
Data Mining: Concepts and Techniques
6
7. Measure the Quality of Clustering
Dissimilarity/Similarity metric: Similarity is expressed in
terms of a distance function, typically metric: d (i, j)
There is a separate “quality” function that measures the
“goodness” of a cluster.
The definitions of distance functions are usually very
different for interval-scaled, binary, categorical, ordinal
ratio, and vector variables.
Weights should be associated with different variables
based on applications and data semantics.
It is hard to define “similar enough” or “good enough”
the answer is typically highly subjective.
November 10, 2013
Data Mining: Concepts and Techniques
7
8. Requirements of Clustering in Data Mining
Scalability
Ability to deal with different types of attributes
Ability to handle dynamic data
Discovery of clusters with arbitrary shape
Minimal requirements for domain knowledge to
determine input parameters
Able to deal with noise and outliers
Insensitive to order of input records
High dimensionality
Incorporation of user-specified constraints
Interpretability and usability
November 10, 2013
Data Mining: Concepts and Techniques
8
9. Chapter 7. Cluster Analysis
1. What is Cluster Analysis?
2. Types of Data in Cluster Analysis
3. A Categorization of Major Clustering Methods
4. Partitioning Methods
5. Hierarchical Methods
6. Outlier Analysis
7. Summary
November 10, 2013
Data Mining: Concepts and Techniques
9
11. Type of data in clustering analysis
Interval-scaled variables
Binary variables
Nominal, ordinal, and ratio variables
Variables of mixed types
November 10, 2013
Data Mining: Concepts and Techniques
11
12. Interval-valued variables
Standardize data
Calculate the mean absolute deviation:
s f = 1 (| x1 f − m f | + | x2 f − m f | +...+ | xnf − m f |)
n
where
m f = 1 x + x +...+ x
n 1f
2f
nf
.
Calculate the standardized measurement (z-score)
xif − m f
zif =
sf
Using mean absolute deviation is more robust than using
standard deviation
November 10, 2013
Data Mining: Concepts and Techniques
12
13. Similarity and Dissimilarity Between
Objects
Distances are normally used to measure the similarity or
dissimilarity between two data objects
Some popular ones include: Minkowski distance:
d (i, j) = q (| x − x |q + | x − x |q +...+ | x − x |q )
i1 j1
i2 j 2
ip jp
where i = (xi1, xi2, …, xip) and j = (xj1, xj2, …, xjp) are two pdimensional data objects, and q is a positive integer
If q = 1, d is Manhattan (or city block) distance
d (i, j) =| x − x | + | x − x | + ...+ | x − x |
i1 j1 i2 j 2
ip jp
November 10, 2013
Data Mining: Concepts and Techniques
13
15. Similarity and Dissimilarity Between
Objects (Cont.)
If q = 2, d is Euclidean distance:
d (i, j) = (| x − x | 2 + | x − x |2 +...+ | x − x | 2 )
i1
j1
i2
j2
ip
jp
Properties
d(i,i) = 0
d(i,j) = d(j,i)
d(i,j) ≥ 0
d(i,j) ≤ d(i,k) + d(k,j)
(triangle inequality)
Also, one can use weighted distance, parametric
Pearson product moment correlation, or other
disimilarity measures
November 10, 2013
Data Mining: Concepts and Techniques
15
16. Binary Variables
A contingency table for binary
Object i
data
Object j
1
0
1
q
s
0
r
t
sum q + s r + t
Distance measure for
symmetric binary variables:
Distance measure for
asymmetric binary variables:
Jaccard coefficient (similarity
measure for asymmetric
d (i, j) =
November 10, 2013
r +s
q + +s
r
simJaccard (i, j) =
Data Mining: Concepts and Techniques
p
r +s
q +r +s +t
d (i, j) =
binary variables):
sum
q+r
s +t
q
q+r +s
16
17. 1
Dissimilarity between Binary
0
sum q + s r + t
Example
Name
Jack
Mary
Jim
1
0 sum
q
r q+
Variablesr
s
t
s +t
Gender
M
F
M
Fever
Y
Y
Y
Cough
N
N
P
Test-1
P
P
N
Test-2
N
N
N
Test-3
N
P
N
p
Test-4
N
N
N
gender is a symmetric attribute
the remaining attributes are asymmetric binary
let the values Y and P be set to 1, and the value N be set to 0
0 +1
=0.33
2 +0 +1
1 +1
d ( jack , jim ) =
=0.67
1 +1 +1
1 +2
d ( jim , mary ) =
=0.75
1 +1 +2
d ( jack , mary ) =
November 10, 2013
Data Mining: Concepts and Techniques
17
18. Nominal Variables
A generalization of the binary variable in that it can take
more than 2 states, e.g., red, yellow, blue, green
Method 1: Simple matching
m: # of matches, p: total # of variables
d (i, j) = p −m
p
Method 2: use a large number of binary variables
creating a new binary variable for each of the M
nominal states
November 10, 2013
Data Mining: Concepts and Techniques
18
19. Ordinal Variables
An ordinal variable can be discrete or continuous
Order is important, e.g., rank
Can be treated like interval-scaled
replace xif by their rank
rif ∈ 1,..., M f }
{
map the range of each variable onto [0, 1] by replacing
i-th object in the f-th variable by
r −
1
zif = if
M
−
1
f
compute the dissimilarity using methods for intervalscaled variables
November 10, 2013
Data Mining: Concepts and Techniques
19
20. Ratio-Scaled Variables
Ratio-scaled variable: a positive measurement on a
nonlinear scale, approximately at exponential scale,
such as AeBt or Ae-Bt
Methods:
treat them like interval-scaled variables—not a good
choice! (why?—the scale can be distorted)
apply logarithmic transformation
yif = loge(xif)
treat them as continuous ordinal data or treat their
ranks as interval-scaled
November 10, 2013
Data Mining: Concepts and Techniques
20
21. Variables of Mixed Types
A database may contain all the six types of variables
symmetric binary, asymmetric binary, nominal,
ordinal, interval-valued and ratio-scaled
One may use a weighted formula to combine their
p
(
(
effects
Σ =1δ f ) d ij f )
d (i, j ) = f p ij ( f )
Σ =1δ
f
ij
f is binary or nominal:
dij(f) = 0 if xif = xjf , or dij(f) = 1 otherwise
f is interval-based: use the normalized distance
f is ordinal or ratio-scaled
compute ranks r and
if
zif = r −1
and treat z as interval-scaled
M −1
if
if
f
November 10, 2013
Data Mining: Concepts and Techniques
21
22. Vector Objects
Vector objects: keywords in documents, gene
features in micro-arrays, etc.
Broad applications: information retrieval, biological
taxonomy, etc.
Cosine measure
A variant: Tanimoto coefficient
November 10, 2013
Data Mining: Concepts and Techniques
22
23. Chapter 7. Cluster Analysis
1. What is Cluster Analysis?
2. Types of Data in Cluster Analysis
3. A Categorization of Major Clustering Methods
4. Partitioning Methods
5. Hierarchical Methods
6. Outlier Analysis
7. Summary
November 10, 2013
Data Mining: Concepts and Techniques
23
24. Major Clustering Approaches (I)
Partitioning approach:
Construct various partitions and then evaluate them by some
criterion, e.g., minimizing the sum of square errors
Typical methods: k-means, k-medoids, CLARANS
Hierarchical approach:
Create a hierarchical decomposition of the set of data (or objects)
using some criterion
Typical methods: Diana, Agnes, BIRCH, ROCK, CAMELEON
Density-based approach:
Based on connectivity and density functions
Typical methods: DBSACN, OPTICS, DenClue
November 10, 2013
Data Mining: Concepts and Techniques
24
25. Major Clustering Approaches (II)
Grid-based approach:
based on a multiple-level granularity structure
Typical methods: STING, WaveCluster, CLIQUE
Model-based:
A model is hypothesized for each of the clusters and tries to find the best fit
of that model to each other
Typical methods: EM, SOM, COBWEB
Frequent pattern-based:
Based on the analysis of frequent patterns
Typical methods: pCluster
User-guided or constraint-based:
Clustering by considering user-specified or application-specific constraints
Typical methods: COD (obstacles), constrained clustering
November 10, 2013
Data Mining: Concepts and Techniques
25
26. Chapter 7. Cluster Analysis
1. What is Cluster Analysis?
2. Types of Data in Cluster Analysis
3. A Categorization of Major Clustering Methods
4. Partitioning Methods
5. Hierarchical Methods
6. Outlier Analysis
7. Summary
November 10, 2013
Data Mining: Concepts and Techniques
26
27. Partitioning Algorithms: Basic Concept
Partitioning method: Construct a partition of a database D of n objects
into a set of k clusters, s.t., minimize sum of squared distance
Σ ik=1Σ p∈C p − mi
2
i
Given a k, find a partition of k clusters that optimizes the chosen
partitioning criterion
Global optimal: exhaustively enumerate all partitions
Heuristic methods: k-means and k-medoids algorithms
k-means (MacQueen’67): Each cluster is represented by the
centre (or mean) of the cluster
k-medoids or PAM (Partition around medoids) (Kaufman &
Rousseeuw’87): Each cluster is represented by one of the objects
in the cluster
November 10, 2013
Data Mining: Concepts and Techniques
27
28. The K-Means Clustering Method
Given k, the k-means algorithm is implemented in four
steps:
Partition objects into k non-empty subsets
Compute seed points as the centroids of the
clusters of the current partition (the centroid is the
centre, i.e., mean point, of the cluster)
Assign each object to the cluster with the nearest
seed point based on distance
Go back to Step 2, stop when no more movement
between clusters
November 10, 2013
Data Mining: Concepts and Techniques
28
30. Comments on the K-Means Method
Strength: Relatively efficient: O(tkn), where n is # objects, k is #
clusters, and t is # iterations. Normally, k, t << n.
Comparing: PAM: O(k(n-k)2 ), CLARA: O(ks2 + k(n-k))
Comment: Often terminates at a local optimum. The global optimum
may be found using techniques such as: deterministic annealing and
genetic algorithms
Weakness
Applicable only when mean is defined, then what about categorical
data?
Need to specify k, the number of clusters, in advance
Unable to handle noisy data and outliers
Not suitable to discover clusters with non-convex shapes
November 10, 2013
Data Mining: Concepts and Techniques
30
31. Variations of the K-Means Method
A few variants of the k-means which differ in
Dissimilarity calculations
Selection of the initial k means
Strategies to calculate cluster means
Handling categorical data: k-modes (Huang’98)
Replacing means of clusters with modes
Using new dissimilarity measures to deal with categorical objects
Using a frequency-based method to update modes of clusters
A mixture of categorical and numerical data: k-prototype method
November 10, 2013
Data Mining: Concepts and Techniques
31
32. What Is the Problem of the K-Means Method?
The k-means algorithm is sensitive to outliers !
Since an object with an extremely large value may substantially
distort the distribution of the data.
K-Medoids: Instead of taking the mean value of the object in a cluster
as a reference point, medoids can be used, which is the most
centrally located object in a cluster.
10
10
9
9
8
8
7
7
6
6
5
5
4
4
3
3
2
2
1
1
0
0
0
November 10, 2013
1
2
3
4
5
6
7
8
9
10
0
1
2
3
Data Mining: Concepts and Techniques
4
5
6
7
8
9
10
32
33. The K-Medoids Clustering Method
Find representative objects, called medoids, in clusters
PAM (Partitioning Around Medoids, 1987)
starts from an initial set of medoids and iteratively replaces one
of the medoids by one of the non-medoids if it improves the total
distance of the resulting clustering
PAM works effectively for small data sets, but does not scale
well for large data sets
CLARA (Kaufmann & Rousseeuw, 1990)
CLARANS (Ng & Han, 1994): Randomized sampling
Focusing + spatial data structure (Ester et al., 1995)
November 10, 2013
Data Mining: Concepts and Techniques
33
34. A Typical K-Medoids Algorithm (PAM)
Total Cost = 20
10
10
10
9
9
9
8
8
8
Arbitrary
choose k
object as
initial
medoids
7
6
5
4
3
2
1
0
7
6
5
4
3
2
1
0
0
1
2
3
4
5
6
7
8
9
10
0
K=2
Do loop
Until no
change
1
2
3
4
5
6
7
8
9
10
Assign
each
remainin
g object
to
nearest
medoids
7
6
5
4
3
2
1
0
0
10
Compute
total cost of
swapping
8
4
5
6
7
8
9
10
7
6
5
9
8
7
6
5
4
4
3
3
2
2
1
1
0
0
0
November 10, 2013
3
10
9
If quality is
improved.
2
Randomly select a
nonmedoid object,Oramdom
Total Cost = 26
Swapping O
and Oramdom
1
1
2
3
4
5
6
7
8
9
10
Data Mining: Concepts and Techniques
0
1
2
3
4
5
6
7
8
9
10
34
37. What Is the Problem with PAM?
PAM is more robust than k-means in the presence of
noise and outliers because a medoid is less influenced by
outliers or other extreme values than a mean
PAM works efficiently for small data sets but does not
scale well for large data sets.
O(k(n-k)2 ) for each iteration
where n is # of data,k is # of clusters
Sampling based method,
CLARA(Clustering LARge Applications)
November 10, 2013
Data Mining: Concepts and Techniques
37
38. Chapter 7. Cluster Analysis
1. What is Cluster Analysis?
2. Types of Data in Cluster Analysis
3. A Categorization of Major Clustering Methods
4. Partitioning Methods
5. Hierarchical Methods
6. Outlier Analysis
7. Summary
November 10, 2013
Data Mining: Concepts and Techniques
38
39. Hierarchical Methods
Agglomerative Hierarchical Clustering
Starts by placing each object in its own cluster and
then merges these atomic clusters into larger and
larger clusters
Divisive Hierarchical Clustering
Bottom-up strategy
Top-down strategy
Starts with all objects in one cluster and then
subdivide the cluster into smaller and smaller pieces
Stopping (or termination) conditions
November 10, 2013
Data Mining: Concepts and Techniques
39
40. Stopping Conditions
Agglomerative Hierarchical Clustering
Merging continues until all objects are in a single
cluster or until certain termination criteria are satisfied
Divisive Hierarchical Clustering
Subdividing continues until each object forms a cluster
on its own or until it satisfies certain termination
criteria:
A desired number of clusters is obtained
The diameter of each cluster is within a certain
threshold
November 10, 2013
Data Mining: Concepts and Techniques
40
41. Hierarchical Clustering
Use distance matrix as clustering criteria. This method
does not require the number of clusters k as an input, but
needs a termination condition
Step 0
a
b
Step 1
Step 2 Step 3 Step 4
ab
abcde
c
cde
d
de
e
Step 4
November 10, 2013
agglomerative
(AGNES)
Step 3
Step 2 Step 1 Step 0
Data Mining: Concepts and Techniques
divisive
(DIANA)
41
42. AGNES (AGglomerative NESting)
Introduced in Kaufmann and Rousseeuw (1990)
Implemented in statistical analysis packages, e.g., Splus
Use the Single-Link method and the Distance matrix.
Merge nodes that have the least distance
Go on in a non-decreasing (in terms of size) fashion
Eventually all nodes belong to the same cluster
10
9
8
7
6
5
4
3
2
1
0
0
1
2
3
4
5
November 10, 2013
6
7
8
9
10
Data Mining: Concepts and Techniques
42
43. AGNES (AGglomerative NESting)
Introduced in Kaufmann and Rousseeuw (1990)
Implemented in statistical analysis packages, e.g., Splus
Use the Single-Link method and the Distance matrix.
Merge nodes that have the least distance
Go on in a non-decreasing (in terms of size) fashion
Eventually all nodes belong to the same cluster
10
10
10
9
9
9
8
8
8
7
7
7
6
6
6
5
5
5
4
4
4
3
3
3
2
2
2
1
1
1
0
0
0
1
2
3
4
5
November 10, 2013
6
7
8
9
10
0
0
1
2
3
4
5
6
7
8
9
10
Data Mining: Concepts and Techniques
0
1
2
3
4
5
6
7
8
9
10
43
44. Dendrogram: Shows How the Clusters are Merged
November 10, 2013
Data Mining: Concepts and Techniques
44
45. DIANA (DIvisive ANAlysis)
Introduced in Kaufmann and Rousseeuw (1990)
Implemented in statistical analysis packages, e.g., Splus
Inverse order of AGNES
Eventually each node forms a cluster on its own
10
9
8
7
6
5
4
3
2
1
0
0
1
2
3
4
November 10, 2013
5
6
7
8
9
10
Data Mining: Concepts and Techniques
45
46. DIANA (DIvisive ANAlysis)
Introduced in Kaufmann and Rousseeuw (1990)
Implemented in statistical analysis packages, e.g., Splus
Inverse order of AGNES
Eventually each node forms a cluster on its own
10
10
10
9
9
9
8
8
8
7
7
7
6
6
6
5
5
5
4
4
4
3
3
3
2
2
2
1
1
1
0
0
1
2
3
4
November 10, 2013
5
6
7
8
9
10
0
0
0
1
2
3
4
5
6
7
8
9
10
Data Mining: Concepts and Techniques
0
1
2
3
4
5
6
7
8
9
10
46
47. Recent Hierarchical Clustering Methods
Major weakness of agglomerative clustering methods
do not scale well: time complexity of at least O(n2),
where n is the number of total objects
can never undo what was done previously
Integration of hierarchical with distance-based clustering
BIRCH (1996): uses CF-tree and incrementally adjusts
the quality of sub-clusters
ROCK (1999): clustering categorical data by neighbor
and link analysis
CHAMELEON (1999): hierarchical clustering using
dynamic modeling
November 10, 2013
Data Mining: Concepts and Techniques
47
48. Chapter 7. Cluster Analysis
1. What is Cluster Analysis?
2. Types of Data in Cluster Analysis
3. A Categorization of Major Clustering Methods
4. Partitioning Methods
5. Hierarchical Methods
6. Outlier Analysis
7. Summary
November 10, 2013
Data Mining: Concepts and Techniques
48
49. What Is Outlier Detection?
What are outliers?
The set of objects are considerably dissimilar from the
remainder of the data
Example: Sports: Shane Warne, Diego Maradona, ...
Problem: Define and find outliers in large data sets
Applications:
Credit card fraud detection
Telecom fraud detection
Customer segmentation
Medical analysis
However, one person’s noise could be another
person’s signal
November 10, 2013
Data Mining: Concepts and Techniques
49
50. Outlier Detection:
Statistical Approaches
Assume a model underlying distribution that generates
data set (e.g. normal distribution)
Use discordancy tests depending on
data distribution
distribution parameter (e.g., mean, variance)
number of expected outliers
Drawbacks
most tests are for single attribute
In many cases, data distribution may not be known
November 10, 2013
Data Mining: Concepts and Techniques
50
51. Outlier Detection: Distance-Based
Approach
Introduced to counter the main limitations imposed by
statistical methods
Find those objects that do not have “enough”
neighbours, where neighbours are defined
based on distance from the given object
Distance-based outlier: A DB(p, D)-outlier is an object O
in a dataset T such that at least a fraction p of the objects
in T lies at a distance greater than D from O
Algorithms for mining distance-based outliers
Index-based algorithm
Nested-loop algorithm
Cell-based algorithm
November 10, 2013
Data Mining: Concepts and Techniques
51
52. Density-Based Local
Outlier Detection
Distance-based outlier detection
is based on global distance
distribution
It encounters difficulties to
identify outliers if data is not
uniformly distributed
Ex. C1 contains 400 loosely
distributed points, C2 has 100
tightly condensed points, 2
outlier points o1, o2
Distance-based method cannot
identify o2 as an outlier
Need the concept of local outlier
November 10, 2013
Local outlier factor (LOF)
Assume outlier is not
crisp
Each point has a LOF
Data Mining: Concepts and Techniques
52
53. Outlier Detection: Deviation-Based Approach
Identifies outliers by examining the main characteristics
of objects in a group
Objects that “deviate” from this description are
considered outliers
Sequential exception technique
simulates the way in which humans can distinguish
unusual objects from among a series of supposedly
like objects
OLAP data cube technique
uses data cubes to identify regions of anomalies in
large multidimensional data
November 10, 2013
Data Mining: Concepts and Techniques
53