Download to read offline

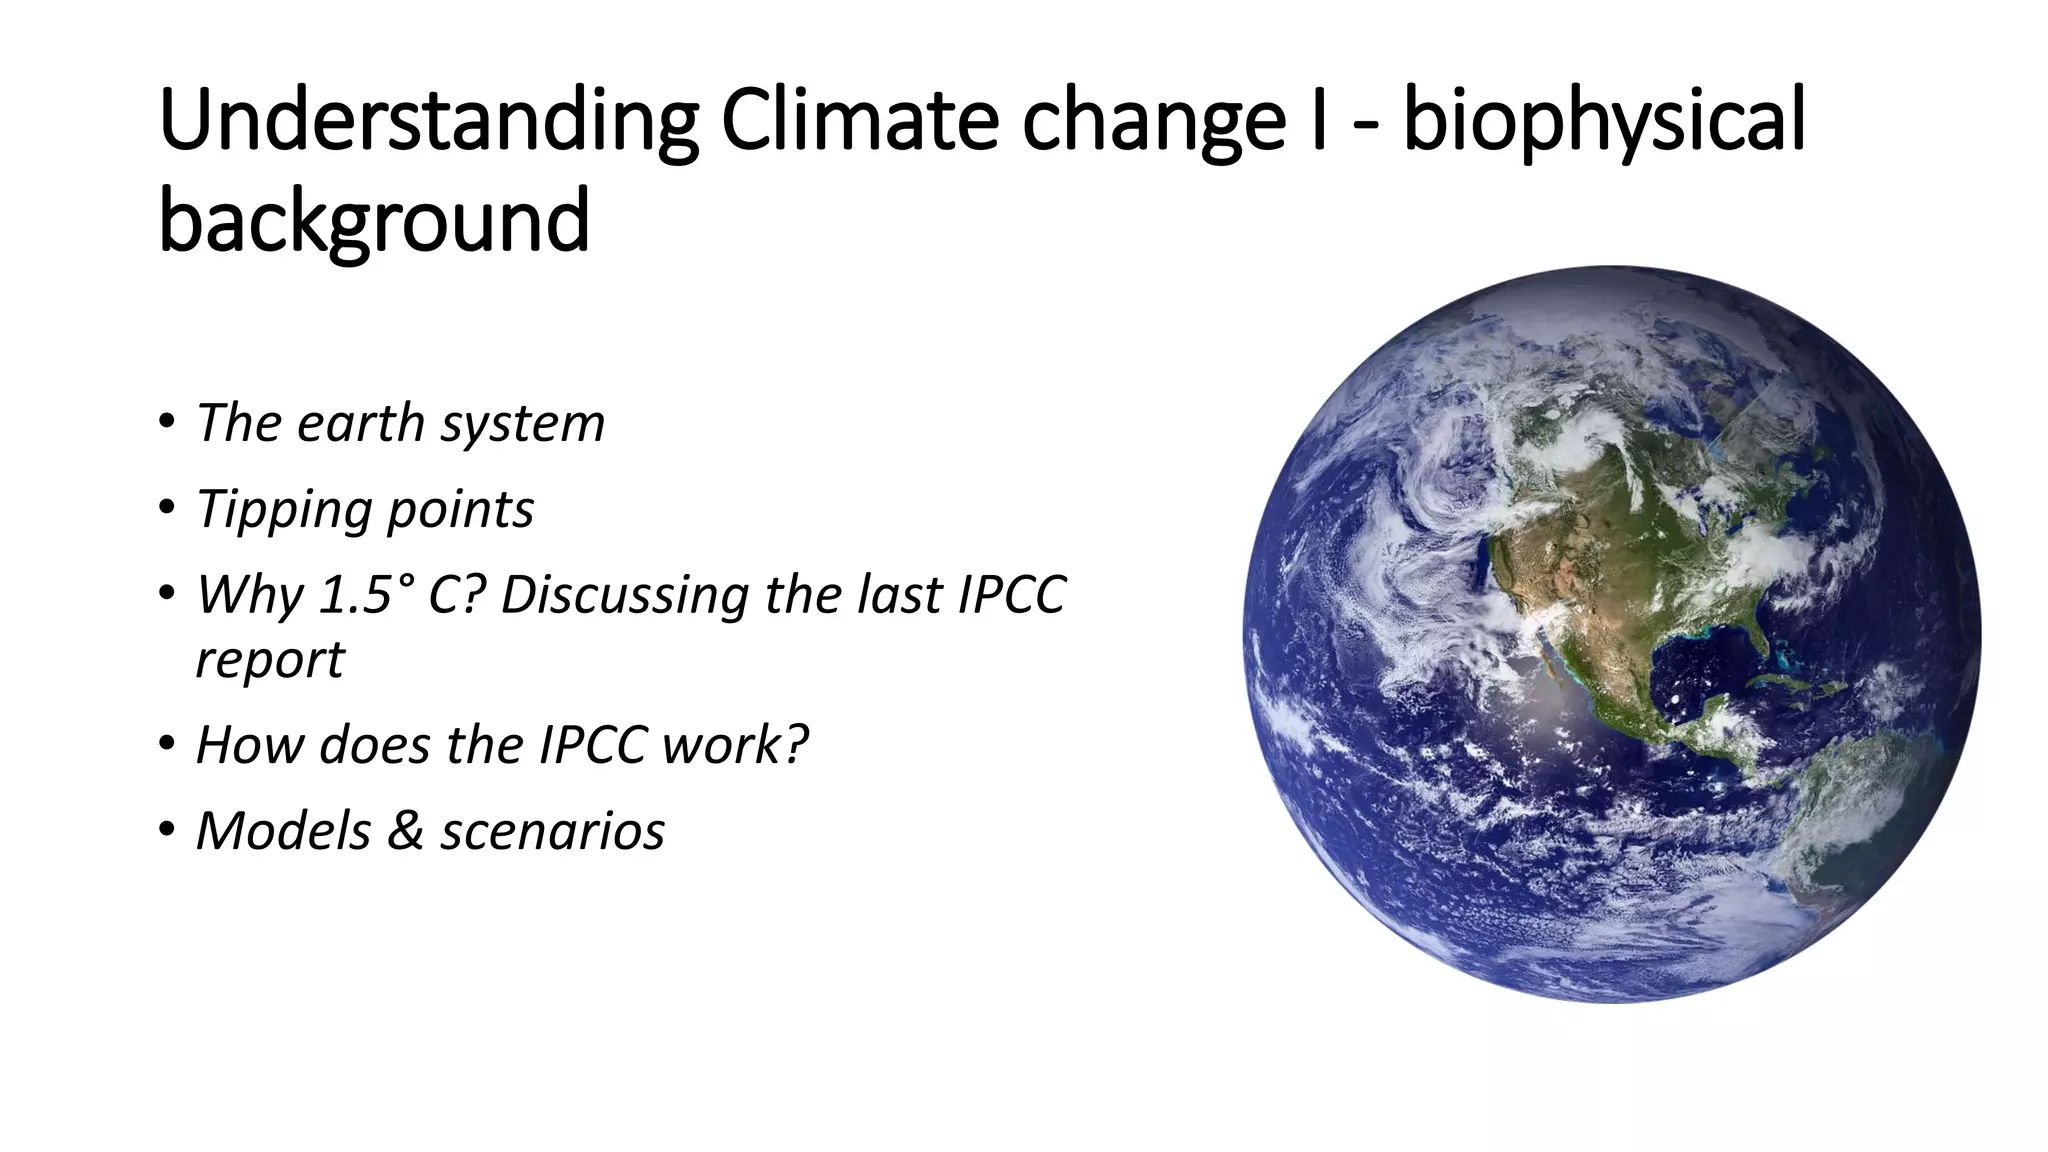
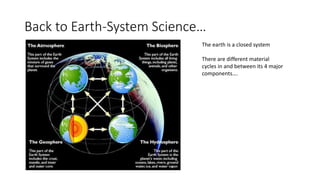

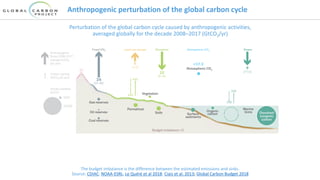
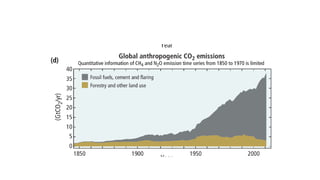
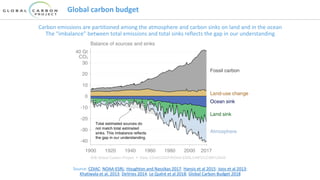
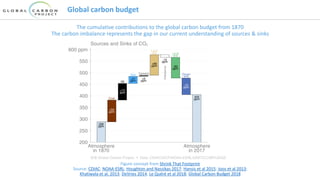
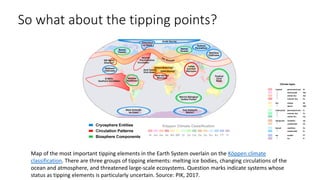

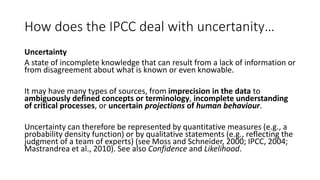


The document discusses the biophysical background of climate change, focusing on the Earth's system, the global carbon cycle, and anthropogenic impacts on emissions and sinks. It highlights the relevance of tipping points, the need for understanding the global carbon budget, and varying emissions by country and source. Additionally, it examines the uncertainties related to climate change assessments and the importance of modeling and scenarios for addressing future uncertainties.


![Hdr 20072008 Presentation[1]](https://cdn.slidesharecdn.com/ss_thumbnails/HDR20072008presentation1-123602819722-phpapp02-thumbnail.jpg?width=640&height=640&fit=bounds)


