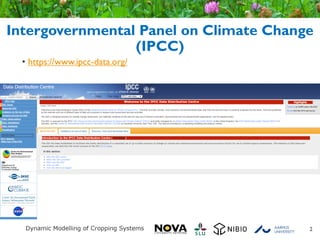
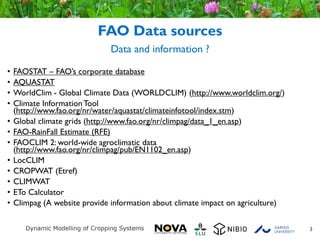
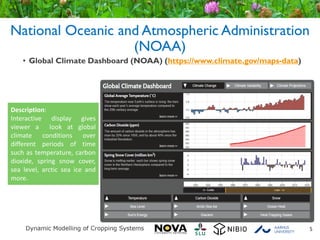
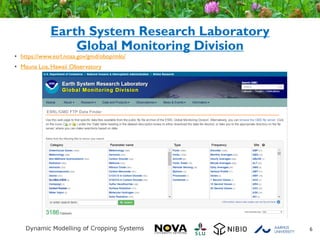
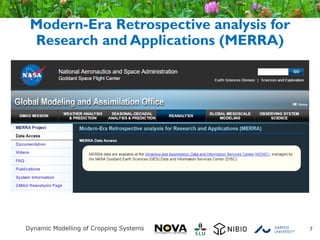
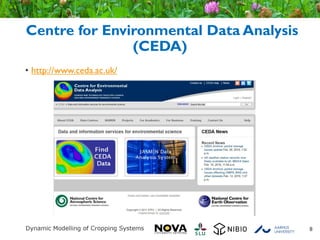
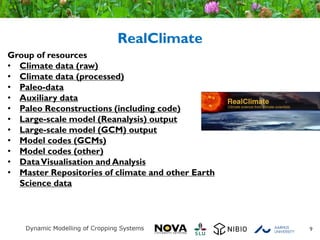
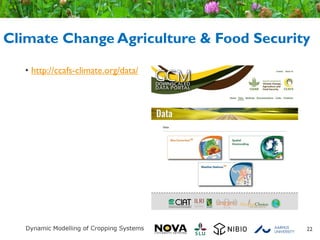
drought monitoring and management using remote sensingveerendra manduri
Monitoring drought and its management became easier with the help of remote sensing..several drought monitoring indices can be used to monitor drought condition. this ppt consists of information regarding droughts in relation to agriculture and their monitoring with the help of remotely sense based indices.
Climate data can provide a great deal of information about the atmospheric environment that impacts almost all aspects of human endeavour. This module explains the importance of climate data, its storage, security, applications and other aspects, in a nutshell.
Remote Sensing Based Soil Moisture DetectionCIMMYT
Remote sensing –Beyond images
Mexico 14-15 December 2013
The workshop was organized by CIMMYT Global Conservation Agriculture Program (GCAP) and funded by the Bill & Melinda Gates Foundation (BMGF), the Mexican Secretariat of Agriculture, Livestock, Rural Development, Fisheries and Food (SAGARPA), the International Maize and Wheat Improvement Center (CIMMYT), CGIAR Research Program on Maize, the Cereal System Initiative for South Asia (CSISA) and the Sustainable Modernization of the Traditional Agriculture (MasAgro)
Weather forecasting is the prediction of the state of the atmosphere for a given location using the application of science and technology. This includes temperature, rain, cloudiness, wind speed, and humidity. Weather warnings are a special kind of short-range forecast carried out for the protection of human life. This module explains the details of weather forecasting.
Land Use and Land Cover change monitoring of Surajpur Wetland, Uttar Pradesh:...Arnab Saha
Abstract:
Wetlands are extremely important areas throughout the world for wildlife protection, recreation, sediment control and flood prevention. Wetlands are important bird’s habitats and birds use them for feeding, roosting, nesting and rearing their young. In Surajpur Wetland are mainly used for agriculture, fisheries, reclamation for harboring and irrigation purposes. In this paper an attempt is made to study the changes in land use and land cover in Surajpur wetland area over 11 years’ period (2003-2014). LULC is an important component in understanding the interactions of the human activities with the environment and thus it is necessary to be able to simulate changes. The land cover mapping of study area was attempted using remotely sensed images of Landsat and Google Earth imagery. The study area was classified into five categories on the basis of field study, geographical conditions, and remote sensing data. LULC changes have been detected by image processing method in EDRAS imagine 2014 and ArcGIS 10.3. The eleven years’ time period of 2003-2014 shows the major type of land use change. Vegetation area that occupied about around 60 per cent of the Surajpur wetland area in 2003 has decreased to 34.25 percent in 2014. Wetland is increased 8.17 percent and Urban area, Fallow land and Water body also have experienced change. Finally, through the work it is recommended that the wetlands need detail mapping through the use of advance remote sensing techniques like microwave and LIDAR for restoration and management of wetland.
Keywords: LULC, ArcGIS, Surajpur, ERDAS, Remote Sensing
Crops yield estimation through remote sensingCIMMYT
Remote sensing –Beyond images
Mexico 14-15 December 2013
The workshop was organized by CIMMYT Global Conservation Agriculture Program (GCAP) and funded by the Bill & Melinda Gates Foundation (BMGF), the Mexican Secretariat of Agriculture, Livestock, Rural Development, Fisheries and Food (SAGARPA), the International Maize and Wheat Improvement Center (CIMMYT), CGIAR Research Program on Maize, the Cereal System Initiative for South Asia (CSISA) and the Sustainable Modernization of the Traditional Agriculture (MasAgro)
Workshop on Operationalizing the Regional Collaborative Platform to Address ‘Water Consumption, Water Productivity and Drought Management’ in Agriculture, 27 - 29 October 2015, Cairo, Egypt
Presentation on behalf of the SA Weather Service presented during SA National Science Week - The harsh realities of climate change, 29 July to 2 August 2019.
Presentation from the Kick-off Meeting "Seasonal to Decadal Forecast towards Climate Services: Joint Kickoff Meetings" for ECOMS, EUPORIAS, NACLIM and SPECS FP7 projects.
At the FAO Workshop, held in Panama City on August 6 - 8th the CGIAR Research Program on Climate Change, Agriculture and Food Security (CCAFS), Head of Research James Hansen gave a presentation on CRAFT tool. More info: http://ow.ly/ocIqJ
DSD-INT 2019 - Global Data Services and Analysis Frameworks - TwigtDeltares
Presentation by Daniel Twigt and Mark Hegnauer, Deltares, at the Delft3D - User Days (Day 1: Hydrology and hydrodynamics), during Delft Software Days - Edition 2019. Monday, 11 November 2019, Delft.
Commercial & research landscape for smart irrigation systems. A survey of commercial product offerings, research prototypes and approaches to smart irrigation. I also cover the why there is such a dire need to conserve water and increase yield.
Application packaging and systematic processing in earth observation exploita...terradue
An overview of Terradue's solutions supporting Earth Observations (EO) Exploitation Platforms across multiple domains.
Presentation done as part of the Open Geospatial Consortium (OGC) Technical Committee ad-hoc meeting for the setup of a new domain working group on EO Exploitation Platforms.
DSD-SEA 2019 Use of Earth Observation Data to Enhance Water Resource Manageme...Deltares
Presentation by Mr. Miguel Laverde, Asian Disaster Preparedness Center (Thailand) at the Seminar Hydro Software to support policy development and real-time decision making, during the Deltares Software Days South-East Asia 2019. Wednesday, 27 November 2019, Bangkok.
Overall description of Finnish Meteorological Institute's information management system. The presentation describes how FMI produce and handle data and how machine learning is used in the process.
Available data sources & Real-time data collectionCLEEN_Ltd
The amount of environmental data is increasing, and the data would be valuable to the society if they are delivered to the right processes at the right time. In the seminar, we show examples of available data, how they are produced and processed, and how the data can be used in new innovative applications.
This presentation is part of the Environmental Data for Applications Seminar held on the 23rd of September 2015. The seminar was organised by the MMEA (Measurement, Measuring and Environmental Assessment) research programme under the Cleen Ltd (SHOK). The presentations are based on the research results related to environmental data interoperability. The participants included key players and partners in the field of environmental monitoring in Finland.
More info at www.mmea.fi
Ethnobotany and Ethnopharmacology:
Ethnobotany in herbal drug evaluation,
Impact of Ethnobotany in traditional medicine,
New development in herbals,
Bio-prospecting tools for drug discovery,
Role of Ethnopharmacology in drug evaluation,
Reverse Pharmacology.
How to Create Map Views in the Odoo 17 ERPCeline George
The map views are useful for providing a geographical representation of data. They allow users to visualize and analyze the data in a more intuitive manner.
How to Split Bills in the Odoo 17 POS ModuleCeline George
Bills have a main role in point of sale procedure. It will help to track sales, handling payments and giving receipts to customers. Bill splitting also has an important role in POS. For example, If some friends come together for dinner and if they want to divide the bill then it is possible by POS bill splitting. This slide will show how to split bills in odoo 17 POS.
Students, digital devices and success - Andreas Schleicher - 27 May 2024..pptxEduSkills OECD
Andreas Schleicher presents at the OECD webinar ‘Digital devices in schools: detrimental distraction or secret to success?’ on 27 May 2024. The presentation was based on findings from PISA 2022 results and the webinar helped launch the PISA in Focus ‘Managing screen time: How to protect and equip students against distraction’ https://www.oecd-ilibrary.org/education/managing-screen-time_7c225af4-en and the OECD Education Policy Perspective ‘Students, digital devices and success’ can be found here - https://oe.cd/il/5yV
Unit 8 - Information and Communication Technology (Paper I).pdfThiyagu K
This slides describes the basic concepts of ICT, basics of Email, Emerging Technology and Digital Initiatives in Education. This presentations aligns with the UGC Paper I syllabus.
2024.06.01 Introducing a competency framework for languag learning materials ...Sandy Millin
http://sandymillin.wordpress.com/iateflwebinar2024
Published classroom materials form the basis of syllabuses, drive teacher professional development, and have a potentially huge influence on learners, teachers and education systems. All teachers also create their own materials, whether a few sentences on a blackboard, a highly-structured fully-realised online course, or anything in between. Despite this, the knowledge and skills needed to create effective language learning materials are rarely part of teacher training, and are mostly learnt by trial and error.
Knowledge and skills frameworks, generally called competency frameworks, for ELT teachers, trainers and managers have existed for a few years now. However, until I created one for my MA dissertation, there wasn’t one drawing together what we need to know and do to be able to effectively produce language learning materials.
This webinar will introduce you to my framework, highlighting the key competencies I identified from my research. It will also show how anybody involved in language teaching (any language, not just English!), teacher training, managing schools or developing language learning materials can benefit from using the framework.
Read| The latest issue of The Challenger is here! We are thrilled to announce that our school paper has qualified for the NATIONAL SCHOOLS PRESS CONFERENCE (NSPC) 2024. Thank you for your unwavering support and trust. Dive into the stories that made us stand out!
The Indian economy is classified into different sectors to simplify the analysis and understanding of economic activities. For Class 10, it's essential to grasp the sectors of the Indian economy, understand their characteristics, and recognize their importance. This guide will provide detailed notes on the Sectors of the Indian Economy Class 10, using specific long-tail keywords to enhance comprehension.
For more information, visit-www.vavaclasses.com
3. FAO Data sources
3
Data and information ?
• FAOSTAT – FAO’s corporate database
• AQUASTAT
• WorldClim - Global Climate Data (WORLDCLIM) (http://www.worldclim.org/)
• Climate Information Tool
(http://www.fao.org/nr/water/aquastat/climateinfotool/index.stm)
• Global climate grids (http://www.fao.org/nr/climpag/data_1_en.asp)
• FAO-RainFall Estimate (RFE)
• FAOCLIM 2: world-wide agroclimatic data
(http://www.fao.org/nr/climpag/pub/EN1102_en.asp)
• LocCLIM
• CROPWAT (Etref)
• CLIMWAT
• ETo Calculator
• Climpag (A website provide information about climate impact on agriculture)
4. National Oceanic and Atmospheric Administration
(NOAA)
4
Climate Data Online (https://www.ncdc.noaa.gov/cdo-web/datasets)
5. National Oceanic and Atmospheric Administration
(NOAA)
• Global Climate Dashboard (NOAA) (https://www.climate.gov/maps-data)
5
Description:
Interactive display gives
viewer a look at global
climate conditions over
different periods of time
such as temperature, carbon
dioxide, spring snow cover,
sea level, arctic sea ice and
more.
6. Earth System Research Laboratory
Global Monitoring Division
• https://www.esrl.noaa.gov/gmd/obop/mlo/
• Mauna Loa, Hawaii Observatory
6
9. RealClimate
9
Group of resources
• Climate data (raw)
• Climate data (processed)
• Paleo-data
• Auxiliary data
• Paleo Reconstructions (including code)
• Large-scale model (Reanalysis) output
• Large-scale model (GCM) output
• Model codes (GCMs)
• Model codes (other)
• DataVisualisation and Analysis
• Master Repositories of climate and other Earth
Science data
11. WorldClim
11
WorldClim is a set of global
climate layers (gridded climate
data) with a spatial resolution
of about 1 km2.These data
can be used for mapping and
spatial modeling.
http://worldclim.org/version2
12. TERRACLIMATE
• Dataset of monthly climate and climatic water balance for global
terrestrial surfaces from 1958-2015.
• http://www.climatologylab.org/terraclimate.html
12
13. KNMI Climate Explorer
• European Climate Assessment & Dataset project
(https://www.ecad.eu/)
• A research tool to investigate the climate
• http://climexp.knmi.nl/start.cgi
13
16. Climate InformationTool Kit (CLIK)
•A web-based climate information tool, is motivated
by the desire to empower users to take advantage
of climate information and forecasts.
•CLIK aids users in retrieving and utilizing climate
prediction data and information available from
APCC data servers in a user-friendly manner.
16
17. CLIMGEN
• Describing or geolocating the location
• Preparing the location parameters either with
statistical analysis of historial weather data, or
providing know monthly statistics.
• Generating the data.
• Exporting the data to available file formats used
by other applications.
http://modeling.bsyse.wsu.edu/CS_Suite/ClimGen/
help/index.htm
17
23. PRISM Climate Group
• The PRISM Climate Group gathers
climate observations from a wide range of
monitoring networks, applies sophisticated
quality control measures, and develops
spatial climate datasets to reveal short-
and long-term climate patterns.
• Publishes a series of state-level climate
maps and data sets
• http://www.prism.oregonstate.edu/
• http://www.prism.oregonstate.edu/compar
isons/drought.php
23
24. CAIT Climate Data Explorer
• CAIT Climate Data Explorer (Climate Watch) a new online climate
data platform designed to empower policymakers, researchers, media
and other stakeholders with the climate data, visualizations and
resources they need to gather insights on national and global
progress on climate change. Climate Watch will maintain many of the
same tools from CAIT, while continuing to add a range of data sets
and tools for actionable analysis on climate change.
• http://cait.wri.org/
24