Download as PDF, PPTX

![Research Question and Hypotheses
Is it possible for users to understand text which explain
process versus outcome orientation?
Is it possible for users to understand graphics which
explain process versus outcome orientation?
Hypothesis: Based on research (Sharp, 2001), readers
perform better with process graphics than with outcome
graphics. However (based on previous findings on a
similar context [Roy, 2006]), when text and graphics are
presented in coordination, readers perform equally well
with both process and outcome graphics.
Technical Communication Laboratory](https://image.slidesharecdn.com/circuitdesignpresentation-120801015423-phpapp01/85/Circuit-design-presentation-12-320.jpg)
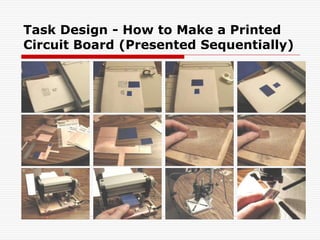
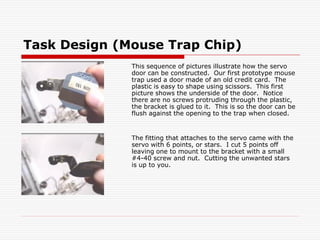
![Task Design
Each graphic presented in the sequence.
A description (major statement) for each sequence was provided.
Two task sequences were used [1. Printed Circuit Board (24-step);
Mouse Trap Chip (18-step)]
Each graphic had one line of text support in 1st sequence.
Each graphic had a paragraph of text support (30 words or less) in
2nd sequence.
First sequence has 8 slot process/process-outcome/outcome
graphic each.
Second sequence has 6 slot process/process-outcome/outcome
graphic each.
1st and 2nd sequence are similar in terms of difficulty levels (as
suggested in inter-coder reliability analysis with graphics only/text
only).
Repeated measures conducted over three weeks to learn about
distributed practice effect.](https://image.slidesharecdn.com/circuitdesignpresentation-120801015423-phpapp01/85/Circuit-design-presentation-17-320.jpg)


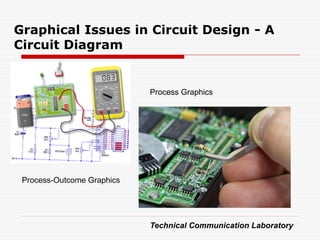
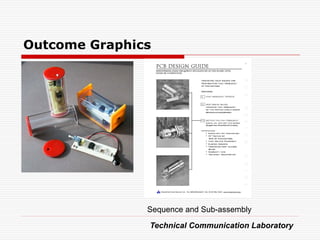
This document discusses designing procedural instructions for user manuals. It focuses specifically on circuit diagrams. There are several challenges with complex machine instructions, including multiple components, subassemblies shown from different angles. The author proposes using pictorial and schematic styles of circuit diagrams to improve understanding. A case study examines how readers comprehend process versus outcome graphics and text-graphic coordination for circuit assembly instructions. The study assessed comprehension of sequences and subassemblies through matching tasks.