Downloaded 1,787 times


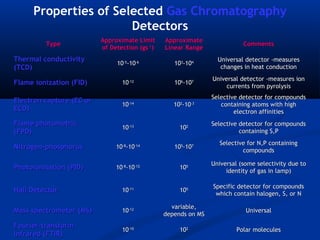
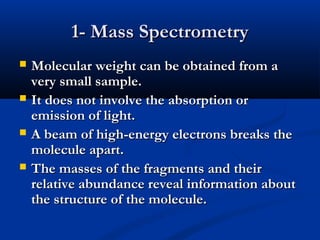
![Instrumentation - Detectors
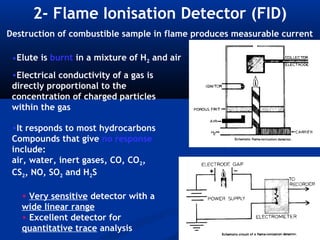
Destructive
• Mass Spectral (CI/EI) [625]
• Flame Ionization (FID) [604]
• Nitrogen-Phosphorus (NPD) [8141A]
• Flame Photometric (FPD) [8141A]
• Electrolytic Conductivity (Hall/ELCD) [502.2]](https://image.slidesharecdn.com/chromatography-121221191926-phpapp02/85/Chromatography-58-320.jpg)
![Instrumentation - Detectors
Non-Destructive
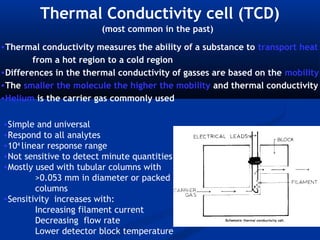
• Thermal Conductivity (TCD)
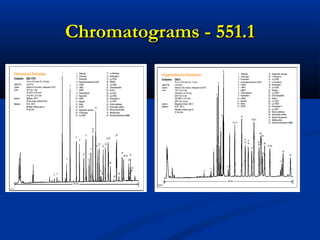
• Electron Capture (ECD) [551.1]
• Photo Ionization (PID) [502.2]](https://image.slidesharecdn.com/chromatography-121221191926-phpapp02/85/Chromatography-59-320.jpg)
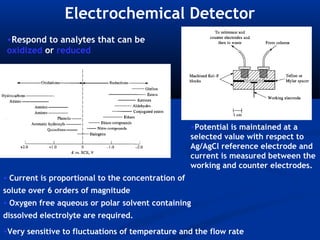


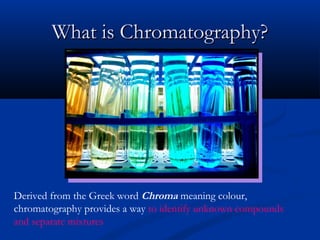
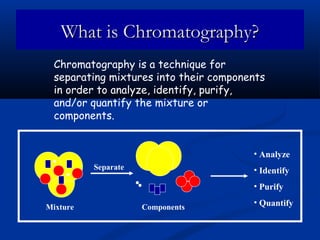
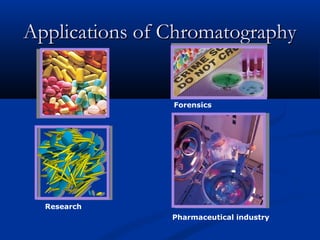
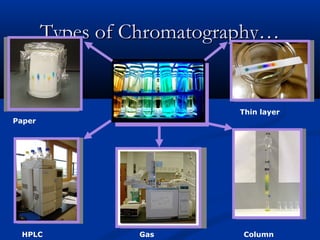
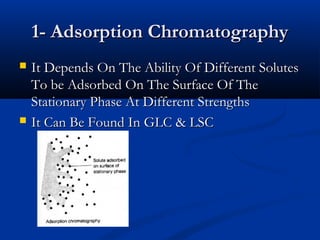
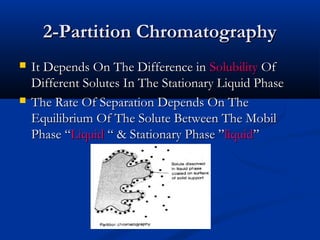
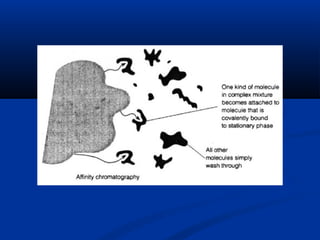
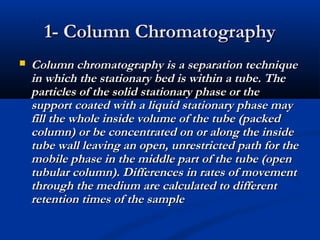
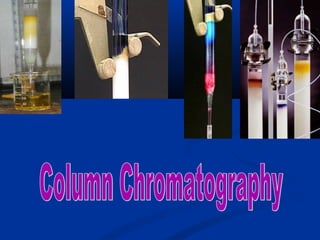
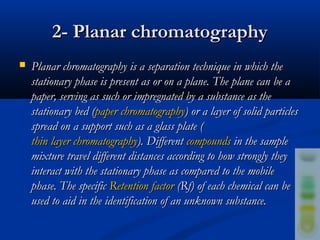
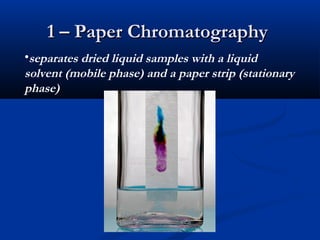
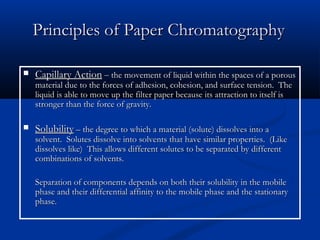
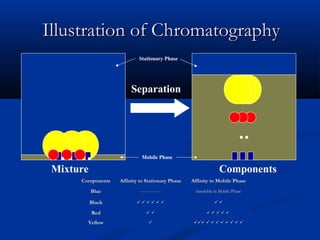
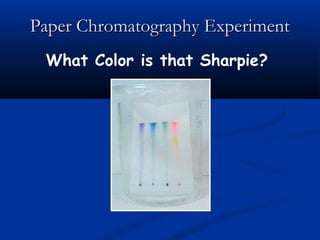
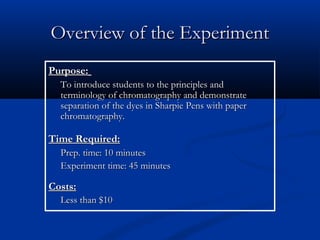
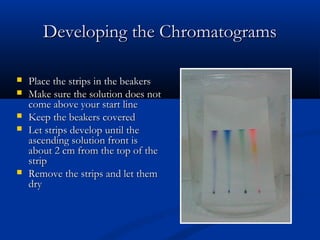
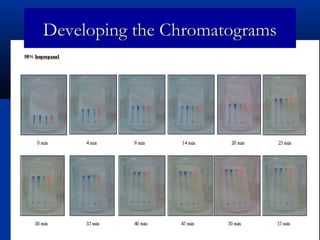
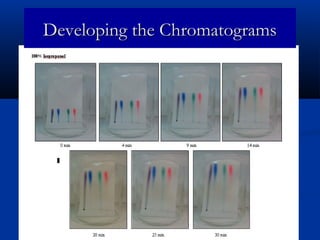
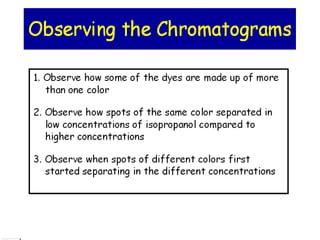
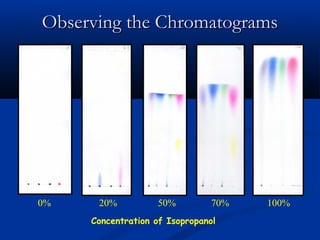
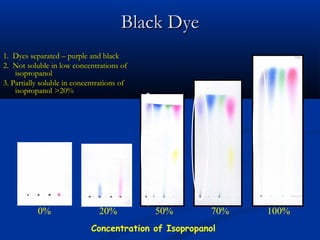
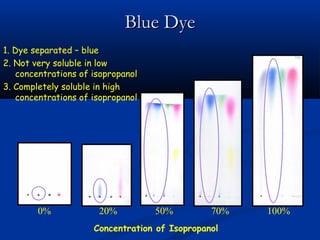
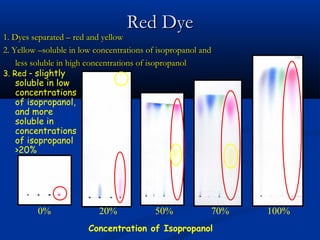
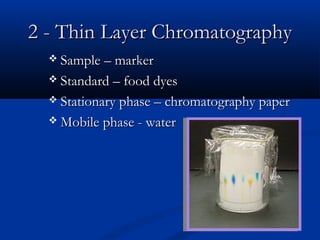
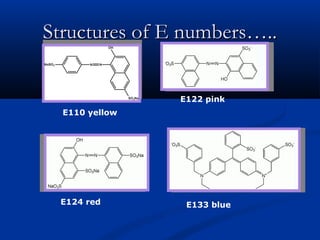
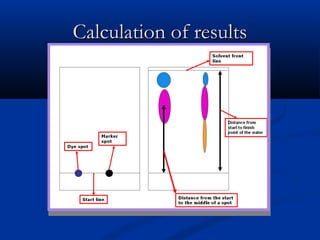
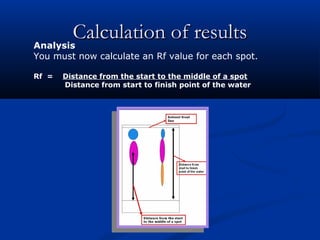
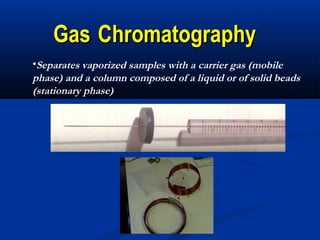
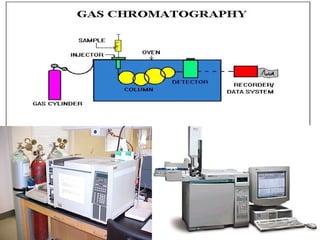
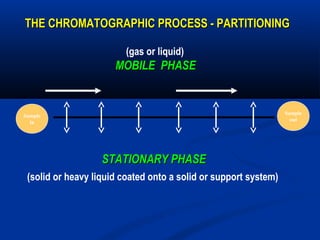
Chromatography is a critical technique used to separate and analyze mixtures into their components, applicable in various fields such as forensics and pharmaceuticals. It includes different methods like adsorption, partition, and affinity chromatography, along with various formats such as paper and thin-layer chromatography. The document also discusses practical applications, experimental procedures, and analyses across different types of chromatography, demonstrating their utility in identifying compounds and optimizing separations.


