Downloaded 650 times


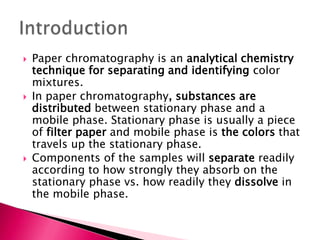


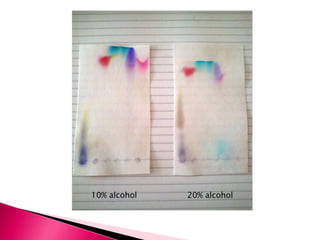
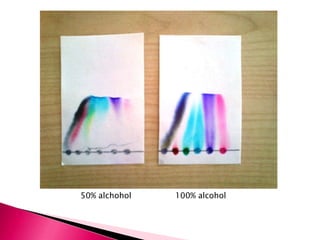


This document describes how to perform paper chromatography to separate mixtures of colored ink dyes. Paper chromatography works by using solvents to differentially migrate the dye mixtures across a stationary filter paper phase based on differences in their polarities. The experiment demonstrated separation of 6 colored ink dyes (black, red, green, blue, purple, pink) across solutions with varying concentrations of isopropanol solvent. Observation of how far each dye migrated showed they separated into distinct components due to differences in solubility related to their chemical structures and polarities.


