Download as PDF, PPTX

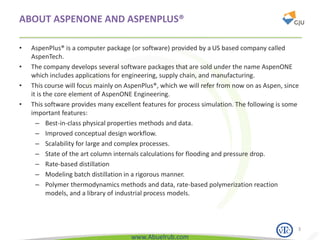
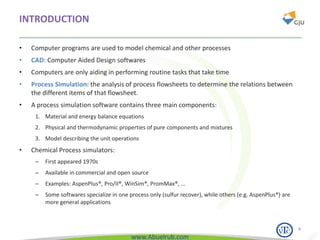
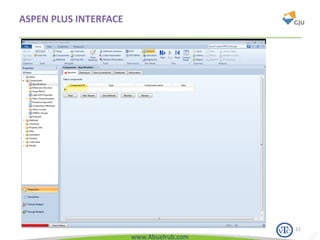
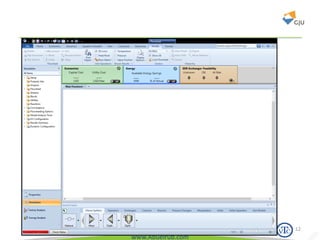

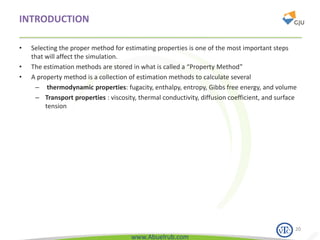
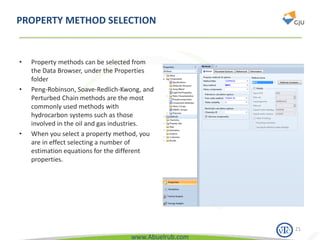

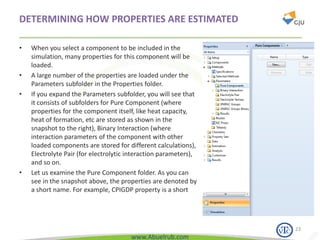
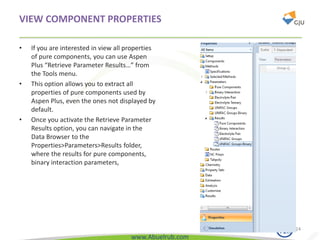
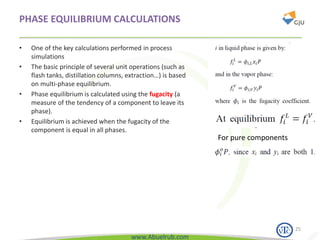
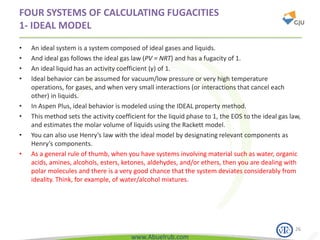

This document provides an overview of using Aspen Plus simulation software for modeling pharmaceutical processes. It introduces Aspen Plus and describes its interface, key components like the model library, data browser, and simulation run toolbar. It also covers selecting appropriate thermodynamic models and property methods, which are crucial for simulation accuracy. The document outlines topics to be covered, including thermodynamic properties, unit operations like heat exchangers and reactors, and provides an example flowsheet of a vitamin concentration process.