Downloaded 5,033 times


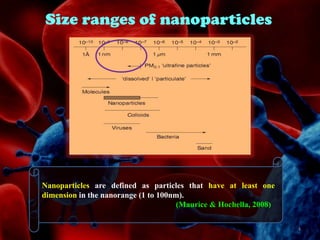


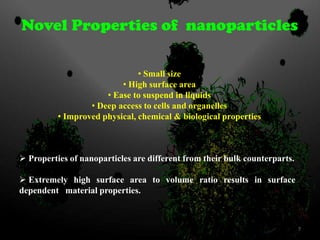


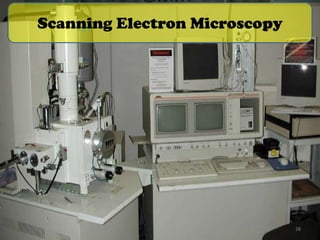


The document provides an overview of characterization techniques for nanoparticles. It discusses how characterization refers to studying the features, composition, structure and properties of materials. Nanoparticles are defined as particles between 1 to 100 nanometers in at least one dimension. Their small size results in unique physical, chemical and biological properties compared to bulk materials. A variety of characterization techniques are described including optical microscopy techniques like dynamic light scattering, electron microscopy techniques like scanning electron microscopy, and other methods like photon spectroscopy. The techniques allow analyzing properties of nanoparticles like size, shape, structure and chemical composition.