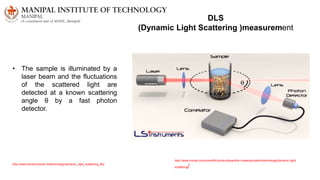
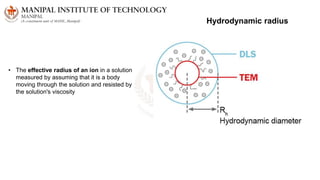
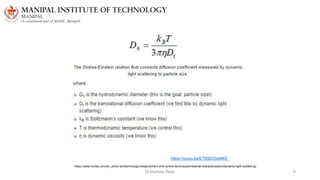
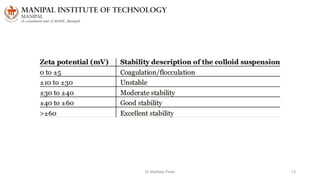
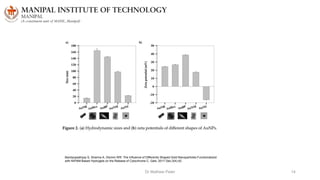
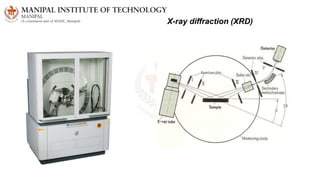
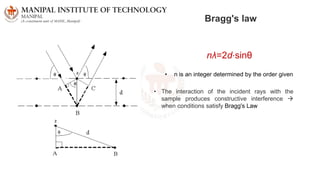
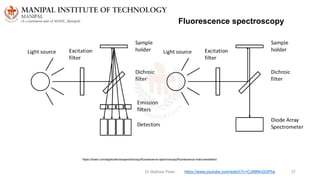
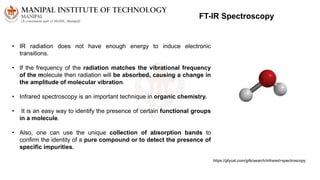
Dr Mathew Peter 1
Characterization of Nanomaterials
NM
Lecture-5
Dr Mathew Peter 2
Recap
DLS
(Dynamic Light Scattering )measurement
• The sample is illuminated by a
laser beam and the fluctuations
of the scattered light are
detected at a known scattering
angle θ by a fast photon
detector.
http://www.horiba.com/scientific/products/particle-characterization/technology/dynamic-light-
scattering/
http://www.lsinstruments.ch/technology/dynamic_light_scattering_dls/
• The effective radius of an ion in a solution
measured by assuming that it is a body
moving through the solution and resisted by
the solution's viscosity
Hydrodynamic radius
Dr Mathew Peter 5
https://youtu.be/ET6S03GeMKE
https://www.horiba.com/en_en/en-en/technology/measurement-and-control-techniques/material-characterization/dynamic-light-scattering/
• Light from the laser light source illuminates the
sample in the cell.
• The scattered light signal is collected with one of
two detectors, either at a 90 degree (right angle) or
173 degree (back angle) scattering angle.
• The provision of both detectors allows more flexibility
in choosing measurement conditions.
• Particles can be dispersed in a variety of liquids.
• Only liquid refractive index and viscosity needs to
be known for interpreting the measurement
results.
https://www.horiba.com/en_en/en-en/technology/measurement-and-control-techniques/material-characterization/dynamic-light-scattering/
Dr Mathew Peter 7
Dr Mathew Peter 8
• The signal can be interpreted in terms of an
autocorrelation function.
• Incoming data is processed in real time with a
digital signal processing device known as a
correlator and the autocorrelation function as
a function of delay time, τ, is extracted.
• For a sample where all of the particles are the same
size, the baseline subtracted autocorrelation
function, C, is simply an exponential decay of the
following form
Dr Mathew Peter 9
• Γ is readily derived from experimental data by a curve fit.
• The diffusion coefficient is obtained from the relation Γ=Dtq2 where q
is the scattering vector, given by
• q=(4πη/λ)sin(θ/2).
• The refractive index of the liquid is η.
• scattering angle, θ.
• The wavelength of the laser light is λ, and scattering angle, θ.
• Inserting Dt into the Stokes-Einstein equation above and solving for
particle size is the final step.
Zeta Potential Measurement
• The electric potential at the slip plane is
known as the zeta potential
• Particles with zeta potentials more
positive than +30 mV or more negative
than -30 mV are normally considered
stable.
https://www.sciencedirect.com/topics/chemistry/zeta-potential
• Zeta potential is determined by a
number of factors, such as the particle
• Surface charge density
• The concentration of counter
ions in the solution
• Solvent polarity
• Temperature
https://www.materials-talks.com/wp-content/uploads/2014/08/surface-zeta-principle.jpg?utm_source=MaterialsTalks&utm_medium=blog&utm_campaign=measure-surface-zeta-
potential&utm_term=10146&utm_content=entryContentLink
Dr Mathew Peter 12
• Electrophoresis: the movement of a
charged particle relative to the
liquid it is suspended in under the
influence of an applied electric field
𝜁 =
4𝜋𝜂
𝜀 × 𝑈 × 300 × 300 × 1000
𝑈 = 𝑣 𝑉 𝐿
• 𝜺 dielectric constant of the medium
• 𝜼 viscosity of the solution
• U electrophoretic mobility
• v velocity of the particles under mobility
• V applied voltage,
• L distance from the electrode
Dr Mathew Peter 13
Dr Mathew Peter 14
Bandyopadhyay S, Sharma A, Glomm WR. The Influence of Differently Shaped Gold Nanoparticles Functionalized
with NIPAM-Based Hydrogels on the Release of Cytochrome C. Gels. 2017 Dec;3(4):42.
X-ray diffraction (XRD)
Bragg's law
nλ=2d⋅sinθ
• n is an integer determined by the order given
• The interaction of the incident rays with the
sample produces constructive interference 
when conditions satisfy Bragg's Law
X-ray tube, a sample holder, and an X-ray detector.
• X-rays -cathode ray tube - heating a
filament to produce electrons 
accelerating the electrons toward a target
by applying a voltage bombarding the
target material with electrons dislodge
inner shell electrons of the target material
 x-ray
• X-rays are collimated and directed onto the
sample
• Sample and detector are rotated
• Intensity of the reflected x-rays is recorded
.
XRD of LaF3: Nd3+ NPs
• diffraction pattern is used to identify the
specimen's crystalline phases and to
measure its structural properties
• From the shift in peak positions, one can calculate the change in d-
spacing, which is the result of the change of lattice constants under
a strain.
• Broadening of the diffraction peaks Inhomogeneous strain
(dependent of sin θ), finite size of crystallites (independent of sin θ)
Dr Mathew Peter 20
Phase identification
https://www.youtube.com/watch?v=9n1u8ymc8aw
Dr Mathew Peter 21
Scherrer's formula
• D Crystallite size
• K  dimensionless shape factor, with a
value close to unity. (0.94)
• β  line broadening at half the
maximum intensity (FWHM) (rad)
• λ  X-ray wavelength (= 1.54060 Å (in the
case of CuKa1))
𝑹𝒂𝒅 =
𝑫𝒆𝒈𝒓𝒆𝒆𝒔 × 𝝅
𝟏𝟖𝟎
https://instanano.com/characterization/theoretical/xrd-size-calculation/
K  0.94
β  FWHM (rad)
D Crystallite size
λ  X-ray wavelength (= 1.54060 Å
(in the case of CuKa1))
Dr Mathew Peter 23
Powder X-ray patterns of (a) amorphous, and (b) crystalline sucrose.
Binding Energy: BE = hγ− KE
h-plank constant, γ- Energy of X-ray, KE- kinetic energy of the emitted electron
.
Electron Spectroscopy for Chemical Analysis ( ESCA) / X-ray photoelectron
spectroscopy (XPS)
Additional reading: Refer chapter “SURFACE PROPERTIESAND SURFACE CHARACTERIZATION OF BIOMATERIALS”- Biomaterials Science :An Introduction to Materials in Medicine Third Edition. Buddy Ratner
Dr Mathew Peter 25
• XPS: The interaction of the X-rays with the atoms in the specimen causes the emission of core
level (inner shell) electrons.
• The energy of these electrons is measured and their values provide information about the nature
and environment of the atom or atoms from which they came.
Dr Mathew Peter 26
• Elements present & concentrations
• Bonding environments- oxidation state
• Bonding atoms
• Aromatic or unsaturated structures
• Surface heterogeneity
• Hydrated (frozen) surfaces
• Organic groups using derivatization reactions
• In SIMS analysis, a surface is bombarded with a beam of
accelerated ions.
• The collision of these ions with the atoms and
molecules in the surface zone can transfer enough
energy that they sputter from the surface.
Secondary Ion Mass Spectrometry
Additional Reading : Refer chapter “SURFACE PROPERTIESAND SURFACE CHARACTERIZATION OF BIOMATERIALS”- Biomaterials Science :An Introduction to Materials in Medicine Third Edition.
Buddy Ratner
Dr Mathew Peter 28
• The particles ejected from the surface are
positive and negative ions (secondary ions),
radicals, excited states, and neutrals.
• The secondary ions are differentiated based on
mass and charge (m/z) by a mass analyser and
spectrum is generated.
Dr Mathew Peter 29
• Trace elemental and isotopic compositions
• Contamination
• Depth profiling layer structures
Absorption & Transmission spectroscopy
Change in Intensity  Absorption
https://orbitbiotech.com/molecular-analysis-using-uv-visible-spectroscopy-spectroscopy-uv-absorption-reflection-spectra-electromagnetic-radiation/
Beer- Lambert’s law
• ϵ is called molar absorptivity or molar
extinction coefficient and is a measure of the
probability of the electronic transition
https://www.edinst.com/blog/the-beer-lambert-law/
Dr Mathew Peter 32
Dr Mathew Peter 33
https://nanocomposix.com/pages/gold-nanoparticles-optical-properties
Effect of Gold Size on Optical Properties
• Measured transmittance for (a) PMMA at incident wavelengths of 400, 500, and 600 nm for as
synthesized (∼14 ( 6 nm) and heat-treated (∼42 ( 15 nm) CeF3: Yb-Er nanoparticles at different solids
loadings.
Mei Chee Tan, Swanand D. Patil, and Richard E. Riman; Applied materials and interphase;VOL. 2 • NO. 7 • 1884–1891 • 2010
Photoluminescence spectroscopy
• Luminescence refers to the emission of light by a material through any process other than blackbody
radiation
• The spectral distribution and time dependence of the emission  electronic transition probabilities within
the sample,  qualitative and/or quantitative information about chemical composition, structure, impurities,
kinetic process and energy transfer
• Radiative and non-radiative relaxation
• Fluorescence and Phosphorescence
𝑄𝑢𝑎𝑛𝑡𝑢𝑚 𝑦𝑖𝑒𝑙𝑑 =
𝑝ℎ𝑜𝑡𝑜𝑛𝑠 𝑒𝑚𝑖𝑡𝑡𝑒𝑑
𝑝ℎ𝑜𝑡𝑜𝑛𝑠 𝑎𝑏𝑠𝑜𝑟𝑏𝑒𝑑
Dr Mathew Peter 37
https://ibsen.com/applications/spectroscopy/fluorescence-spectroscopy/fluorescence-instrumentation/
Fluorescence spectroscopy
https://www.youtube.com/watch?v=CcN8NnGGPhs
Dr Mathew Peter 38
Quantum confinement in semiconductor crystal.
Jagtap S, Chopade P, Tadepalli S, Bhalerao A, Gosavi S. A review on the progress of ZnSe as inorganic scintillator. Opto-Electronics Review. 2019 Mar 1;27(1):90-103.
Eg = band gap energy
h= Planck constatnt
R= radius of particle
me
* = effective mass of excited electron
mh
* = effective mass of excited hole
ΔE = the emission energy.
E = h c λ
c is the speed of light.
Dr Mathew Peter 39
Asok A, Gandhi MN, Kulkarni AR. Enhanced visible photoluminescence in ZnO quantum dots by promotion of oxygen vacancy formation. Nanoscale. 2012;4(16):4943-6.
FT-IR Spectroscopy
• IR radiation does not have enough energy to induce electronic
transitions.
• If the frequency of the radiation matches the vibrational frequency
of the molecule then radiation will be absorbed, causing a change in
the amplitude of molecular vibration.
• Infrared spectroscopy is an important technique in organic chemistry.
• It is an easy way to identify the presence of certain functional groups
in a molecule.
• Also, one can use the unique collection of absorption bands to
confirm the identity of a pure compound or to detect the presence of
specific impurities.
https://gfycat.com/gifs/search/infrared+spectroscopy
Dr Mathew Peter 41
• The range of Infrared region is 12800 ~
10 cm-1and can be divided into near-
infrared region (12800 ~ 4000 cm-1),
mid-infrared region (4000 ~ 200 cm-1)
and far-infrared region (50 ~ 1000 cm-
1).
• Infrared absorption spectroscopy is the
method which scientists use to
determine the structures of
molecules with the molecules’
characteristic absorption of infrared
radiation
IR Band Name Wavelength Range (microns)
Near IR (NIR) 0.7 - 1.4
Short Wave IR (SWIR) 1.4 - 3
Mid Wavelength IR (MWIR) 3 - 8
Long Wavelength IR (LWIR) 8 - 15
Far IR (FIR) 15 - 1000
Dr Mathew Peter 42
Symmetrical
stretching
Asymmetrical
stretching
Scissoring
(Bending)
Rocking Wagging Twisting
Infrared Spectroscopy
Additional Reading - https://www.youtube.com/watch?v=0S_bt3JI150
• Finger print region
<1500 cm-1
• Functional group region
> 1500 cm-1
Dr Mathew Peter 45
(a) Schematic illustration of Au electrode modification with GQDs, fGQDs & cTnI/fGQDs, (b)
voltammogram of Au/GQDs, Au/GQDs-cTnI, Au/fGQDs and Au/fGQDs-cTnI, and (c) FTIR spectra of cTnI,
and cTnI/fGQs.
Functionalized Graphene Quantum Dot Interfaced Electrochemical Detection
of Cardiac Troponin I: An Antibody Free Approach

NM - lecture 6-Characterization-2.pptx

  • 1.
    Dr Mathew Peter1 Characterization of Nanomaterials NM Lecture-5
  • 2.
  • 3.
    DLS (Dynamic Light Scattering)measurement • The sample is illuminated by a laser beam and the fluctuations of the scattered light are detected at a known scattering angle θ by a fast photon detector. http://www.horiba.com/scientific/products/particle-characterization/technology/dynamic-light- scattering/ http://www.lsinstruments.ch/technology/dynamic_light_scattering_dls/
  • 4.
    • The effectiveradius of an ion in a solution measured by assuming that it is a body moving through the solution and resisted by the solution's viscosity Hydrodynamic radius
  • 5.
    Dr Mathew Peter5 https://youtu.be/ET6S03GeMKE https://www.horiba.com/en_en/en-en/technology/measurement-and-control-techniques/material-characterization/dynamic-light-scattering/
  • 6.
    • Light fromthe laser light source illuminates the sample in the cell. • The scattered light signal is collected with one of two detectors, either at a 90 degree (right angle) or 173 degree (back angle) scattering angle. • The provision of both detectors allows more flexibility in choosing measurement conditions. • Particles can be dispersed in a variety of liquids. • Only liquid refractive index and viscosity needs to be known for interpreting the measurement results. https://www.horiba.com/en_en/en-en/technology/measurement-and-control-techniques/material-characterization/dynamic-light-scattering/
  • 7.
  • 8.
    Dr Mathew Peter8 • The signal can be interpreted in terms of an autocorrelation function. • Incoming data is processed in real time with a digital signal processing device known as a correlator and the autocorrelation function as a function of delay time, τ, is extracted. • For a sample where all of the particles are the same size, the baseline subtracted autocorrelation function, C, is simply an exponential decay of the following form
  • 9.
    Dr Mathew Peter9 • Γ is readily derived from experimental data by a curve fit. • The diffusion coefficient is obtained from the relation Γ=Dtq2 where q is the scattering vector, given by • q=(4πη/λ)sin(θ/2). • The refractive index of the liquid is η. • scattering angle, θ. • The wavelength of the laser light is λ, and scattering angle, θ. • Inserting Dt into the Stokes-Einstein equation above and solving for particle size is the final step.
  • 10.
    Zeta Potential Measurement •The electric potential at the slip plane is known as the zeta potential • Particles with zeta potentials more positive than +30 mV or more negative than -30 mV are normally considered stable. https://www.sciencedirect.com/topics/chemistry/zeta-potential
  • 11.
    • Zeta potentialis determined by a number of factors, such as the particle • Surface charge density • The concentration of counter ions in the solution • Solvent polarity • Temperature https://www.materials-talks.com/wp-content/uploads/2014/08/surface-zeta-principle.jpg?utm_source=MaterialsTalks&utm_medium=blog&utm_campaign=measure-surface-zeta- potential&utm_term=10146&utm_content=entryContentLink
  • 12.
    Dr Mathew Peter12 • Electrophoresis: the movement of a charged particle relative to the liquid it is suspended in under the influence of an applied electric field 𝜁 = 4𝜋𝜂 𝜀 × 𝑈 × 300 × 300 × 1000 𝑈 = 𝑣 𝑉 𝐿 • 𝜺 dielectric constant of the medium • 𝜼 viscosity of the solution • U electrophoretic mobility • v velocity of the particles under mobility • V applied voltage, • L distance from the electrode
  • 13.
  • 14.
    Dr Mathew Peter14 Bandyopadhyay S, Sharma A, Glomm WR. The Influence of Differently Shaped Gold Nanoparticles Functionalized with NIPAM-Based Hydrogels on the Release of Cytochrome C. Gels. 2017 Dec;3(4):42.
  • 15.
  • 16.
    Bragg's law nλ=2d⋅sinθ • nis an integer determined by the order given • The interaction of the incident rays with the sample produces constructive interference  when conditions satisfy Bragg's Law
  • 17.
    X-ray tube, asample holder, and an X-ray detector. • X-rays -cathode ray tube - heating a filament to produce electrons  accelerating the electrons toward a target by applying a voltage bombarding the target material with electrons dislodge inner shell electrons of the target material  x-ray • X-rays are collimated and directed onto the sample • Sample and detector are rotated • Intensity of the reflected x-rays is recorded .
  • 18.
    XRD of LaF3:Nd3+ NPs • diffraction pattern is used to identify the specimen's crystalline phases and to measure its structural properties
  • 19.
    • From theshift in peak positions, one can calculate the change in d- spacing, which is the result of the change of lattice constants under a strain. • Broadening of the diffraction peaks Inhomogeneous strain (dependent of sin θ), finite size of crystallites (independent of sin θ)
  • 20.
    Dr Mathew Peter20 Phase identification https://www.youtube.com/watch?v=9n1u8ymc8aw
  • 21.
    Dr Mathew Peter21 Scherrer's formula • D Crystallite size • K  dimensionless shape factor, with a value close to unity. (0.94) • β  line broadening at half the maximum intensity (FWHM) (rad) • λ  X-ray wavelength (= 1.54060 Å (in the case of CuKa1)) 𝑹𝒂𝒅 = 𝑫𝒆𝒈𝒓𝒆𝒆𝒔 × 𝝅 𝟏𝟖𝟎
  • 22.
    https://instanano.com/characterization/theoretical/xrd-size-calculation/ K  0.94 β FWHM (rad) D Crystallite size λ  X-ray wavelength (= 1.54060 Å (in the case of CuKa1))
  • 23.
    Dr Mathew Peter23 Powder X-ray patterns of (a) amorphous, and (b) crystalline sucrose.
  • 24.
    Binding Energy: BE= hγ− KE h-plank constant, γ- Energy of X-ray, KE- kinetic energy of the emitted electron . Electron Spectroscopy for Chemical Analysis ( ESCA) / X-ray photoelectron spectroscopy (XPS) Additional reading: Refer chapter “SURFACE PROPERTIESAND SURFACE CHARACTERIZATION OF BIOMATERIALS”- Biomaterials Science :An Introduction to Materials in Medicine Third Edition. Buddy Ratner
  • 25.
    Dr Mathew Peter25 • XPS: The interaction of the X-rays with the atoms in the specimen causes the emission of core level (inner shell) electrons. • The energy of these electrons is measured and their values provide information about the nature and environment of the atom or atoms from which they came.
  • 26.
    Dr Mathew Peter26 • Elements present & concentrations • Bonding environments- oxidation state • Bonding atoms • Aromatic or unsaturated structures • Surface heterogeneity • Hydrated (frozen) surfaces • Organic groups using derivatization reactions
  • 27.
    • In SIMSanalysis, a surface is bombarded with a beam of accelerated ions. • The collision of these ions with the atoms and molecules in the surface zone can transfer enough energy that they sputter from the surface. Secondary Ion Mass Spectrometry Additional Reading : Refer chapter “SURFACE PROPERTIESAND SURFACE CHARACTERIZATION OF BIOMATERIALS”- Biomaterials Science :An Introduction to Materials in Medicine Third Edition. Buddy Ratner
  • 28.
    Dr Mathew Peter28 • The particles ejected from the surface are positive and negative ions (secondary ions), radicals, excited states, and neutrals. • The secondary ions are differentiated based on mass and charge (m/z) by a mass analyser and spectrum is generated.
  • 29.
    Dr Mathew Peter29 • Trace elemental and isotopic compositions • Contamination • Depth profiling layer structures
  • 30.
    Absorption & Transmissionspectroscopy Change in Intensity  Absorption https://orbitbiotech.com/molecular-analysis-using-uv-visible-spectroscopy-spectroscopy-uv-absorption-reflection-spectra-electromagnetic-radiation/
  • 31.
    Beer- Lambert’s law •ϵ is called molar absorptivity or molar extinction coefficient and is a measure of the probability of the electronic transition https://www.edinst.com/blog/the-beer-lambert-law/
  • 32.
  • 33.
    Dr Mathew Peter33 https://nanocomposix.com/pages/gold-nanoparticles-optical-properties Effect of Gold Size on Optical Properties
  • 34.
    • Measured transmittancefor (a) PMMA at incident wavelengths of 400, 500, and 600 nm for as synthesized (∼14 ( 6 nm) and heat-treated (∼42 ( 15 nm) CeF3: Yb-Er nanoparticles at different solids loadings. Mei Chee Tan, Swanand D. Patil, and Richard E. Riman; Applied materials and interphase;VOL. 2 • NO. 7 • 1884–1891 • 2010
  • 35.
    Photoluminescence spectroscopy • Luminescencerefers to the emission of light by a material through any process other than blackbody radiation • The spectral distribution and time dependence of the emission  electronic transition probabilities within the sample,  qualitative and/or quantitative information about chemical composition, structure, impurities, kinetic process and energy transfer • Radiative and non-radiative relaxation • Fluorescence and Phosphorescence
  • 36.
    𝑄𝑢𝑎𝑛𝑡𝑢𝑚 𝑦𝑖𝑒𝑙𝑑 = 𝑝ℎ𝑜𝑡𝑜𝑛𝑠𝑒𝑚𝑖𝑡𝑡𝑒𝑑 𝑝ℎ𝑜𝑡𝑜𝑛𝑠 𝑎𝑏𝑠𝑜𝑟𝑏𝑒𝑑
  • 37.
    Dr Mathew Peter37 https://ibsen.com/applications/spectroscopy/fluorescence-spectroscopy/fluorescence-instrumentation/ Fluorescence spectroscopy https://www.youtube.com/watch?v=CcN8NnGGPhs
  • 38.
    Dr Mathew Peter38 Quantum confinement in semiconductor crystal. Jagtap S, Chopade P, Tadepalli S, Bhalerao A, Gosavi S. A review on the progress of ZnSe as inorganic scintillator. Opto-Electronics Review. 2019 Mar 1;27(1):90-103. Eg = band gap energy h= Planck constatnt R= radius of particle me * = effective mass of excited electron mh * = effective mass of excited hole ΔE = the emission energy. E = h c λ c is the speed of light.
  • 39.
    Dr Mathew Peter39 Asok A, Gandhi MN, Kulkarni AR. Enhanced visible photoluminescence in ZnO quantum dots by promotion of oxygen vacancy formation. Nanoscale. 2012;4(16):4943-6.
  • 40.
    FT-IR Spectroscopy • IRradiation does not have enough energy to induce electronic transitions. • If the frequency of the radiation matches the vibrational frequency of the molecule then radiation will be absorbed, causing a change in the amplitude of molecular vibration. • Infrared spectroscopy is an important technique in organic chemistry. • It is an easy way to identify the presence of certain functional groups in a molecule. • Also, one can use the unique collection of absorption bands to confirm the identity of a pure compound or to detect the presence of specific impurities. https://gfycat.com/gifs/search/infrared+spectroscopy
  • 41.
    Dr Mathew Peter41 • The range of Infrared region is 12800 ~ 10 cm-1and can be divided into near- infrared region (12800 ~ 4000 cm-1), mid-infrared region (4000 ~ 200 cm-1) and far-infrared region (50 ~ 1000 cm- 1). • Infrared absorption spectroscopy is the method which scientists use to determine the structures of molecules with the molecules’ characteristic absorption of infrared radiation IR Band Name Wavelength Range (microns) Near IR (NIR) 0.7 - 1.4 Short Wave IR (SWIR) 1.4 - 3 Mid Wavelength IR (MWIR) 3 - 8 Long Wavelength IR (LWIR) 8 - 15 Far IR (FIR) 15 - 1000
  • 42.
    Dr Mathew Peter42 Symmetrical stretching Asymmetrical stretching Scissoring (Bending) Rocking Wagging Twisting
  • 43.
    Infrared Spectroscopy Additional Reading- https://www.youtube.com/watch?v=0S_bt3JI150 • Finger print region <1500 cm-1 • Functional group region > 1500 cm-1
  • 45.
    Dr Mathew Peter45 (a) Schematic illustration of Au electrode modification with GQDs, fGQDs & cTnI/fGQDs, (b) voltammogram of Au/GQDs, Au/GQDs-cTnI, Au/fGQDs and Au/fGQDs-cTnI, and (c) FTIR spectra of cTnI, and cTnI/fGQs. Functionalized Graphene Quantum Dot Interfaced Electrochemical Detection of Cardiac Troponin I: An Antibody Free Approach

Editor's Notes

  • #17 if only two rows of atoms are involved, the transition from constructive to destructive interference as θ   changes is gradual. However, if interference from many rows occurs, then the constructive interference peaks become very sharp with mostly destructive interference in between.