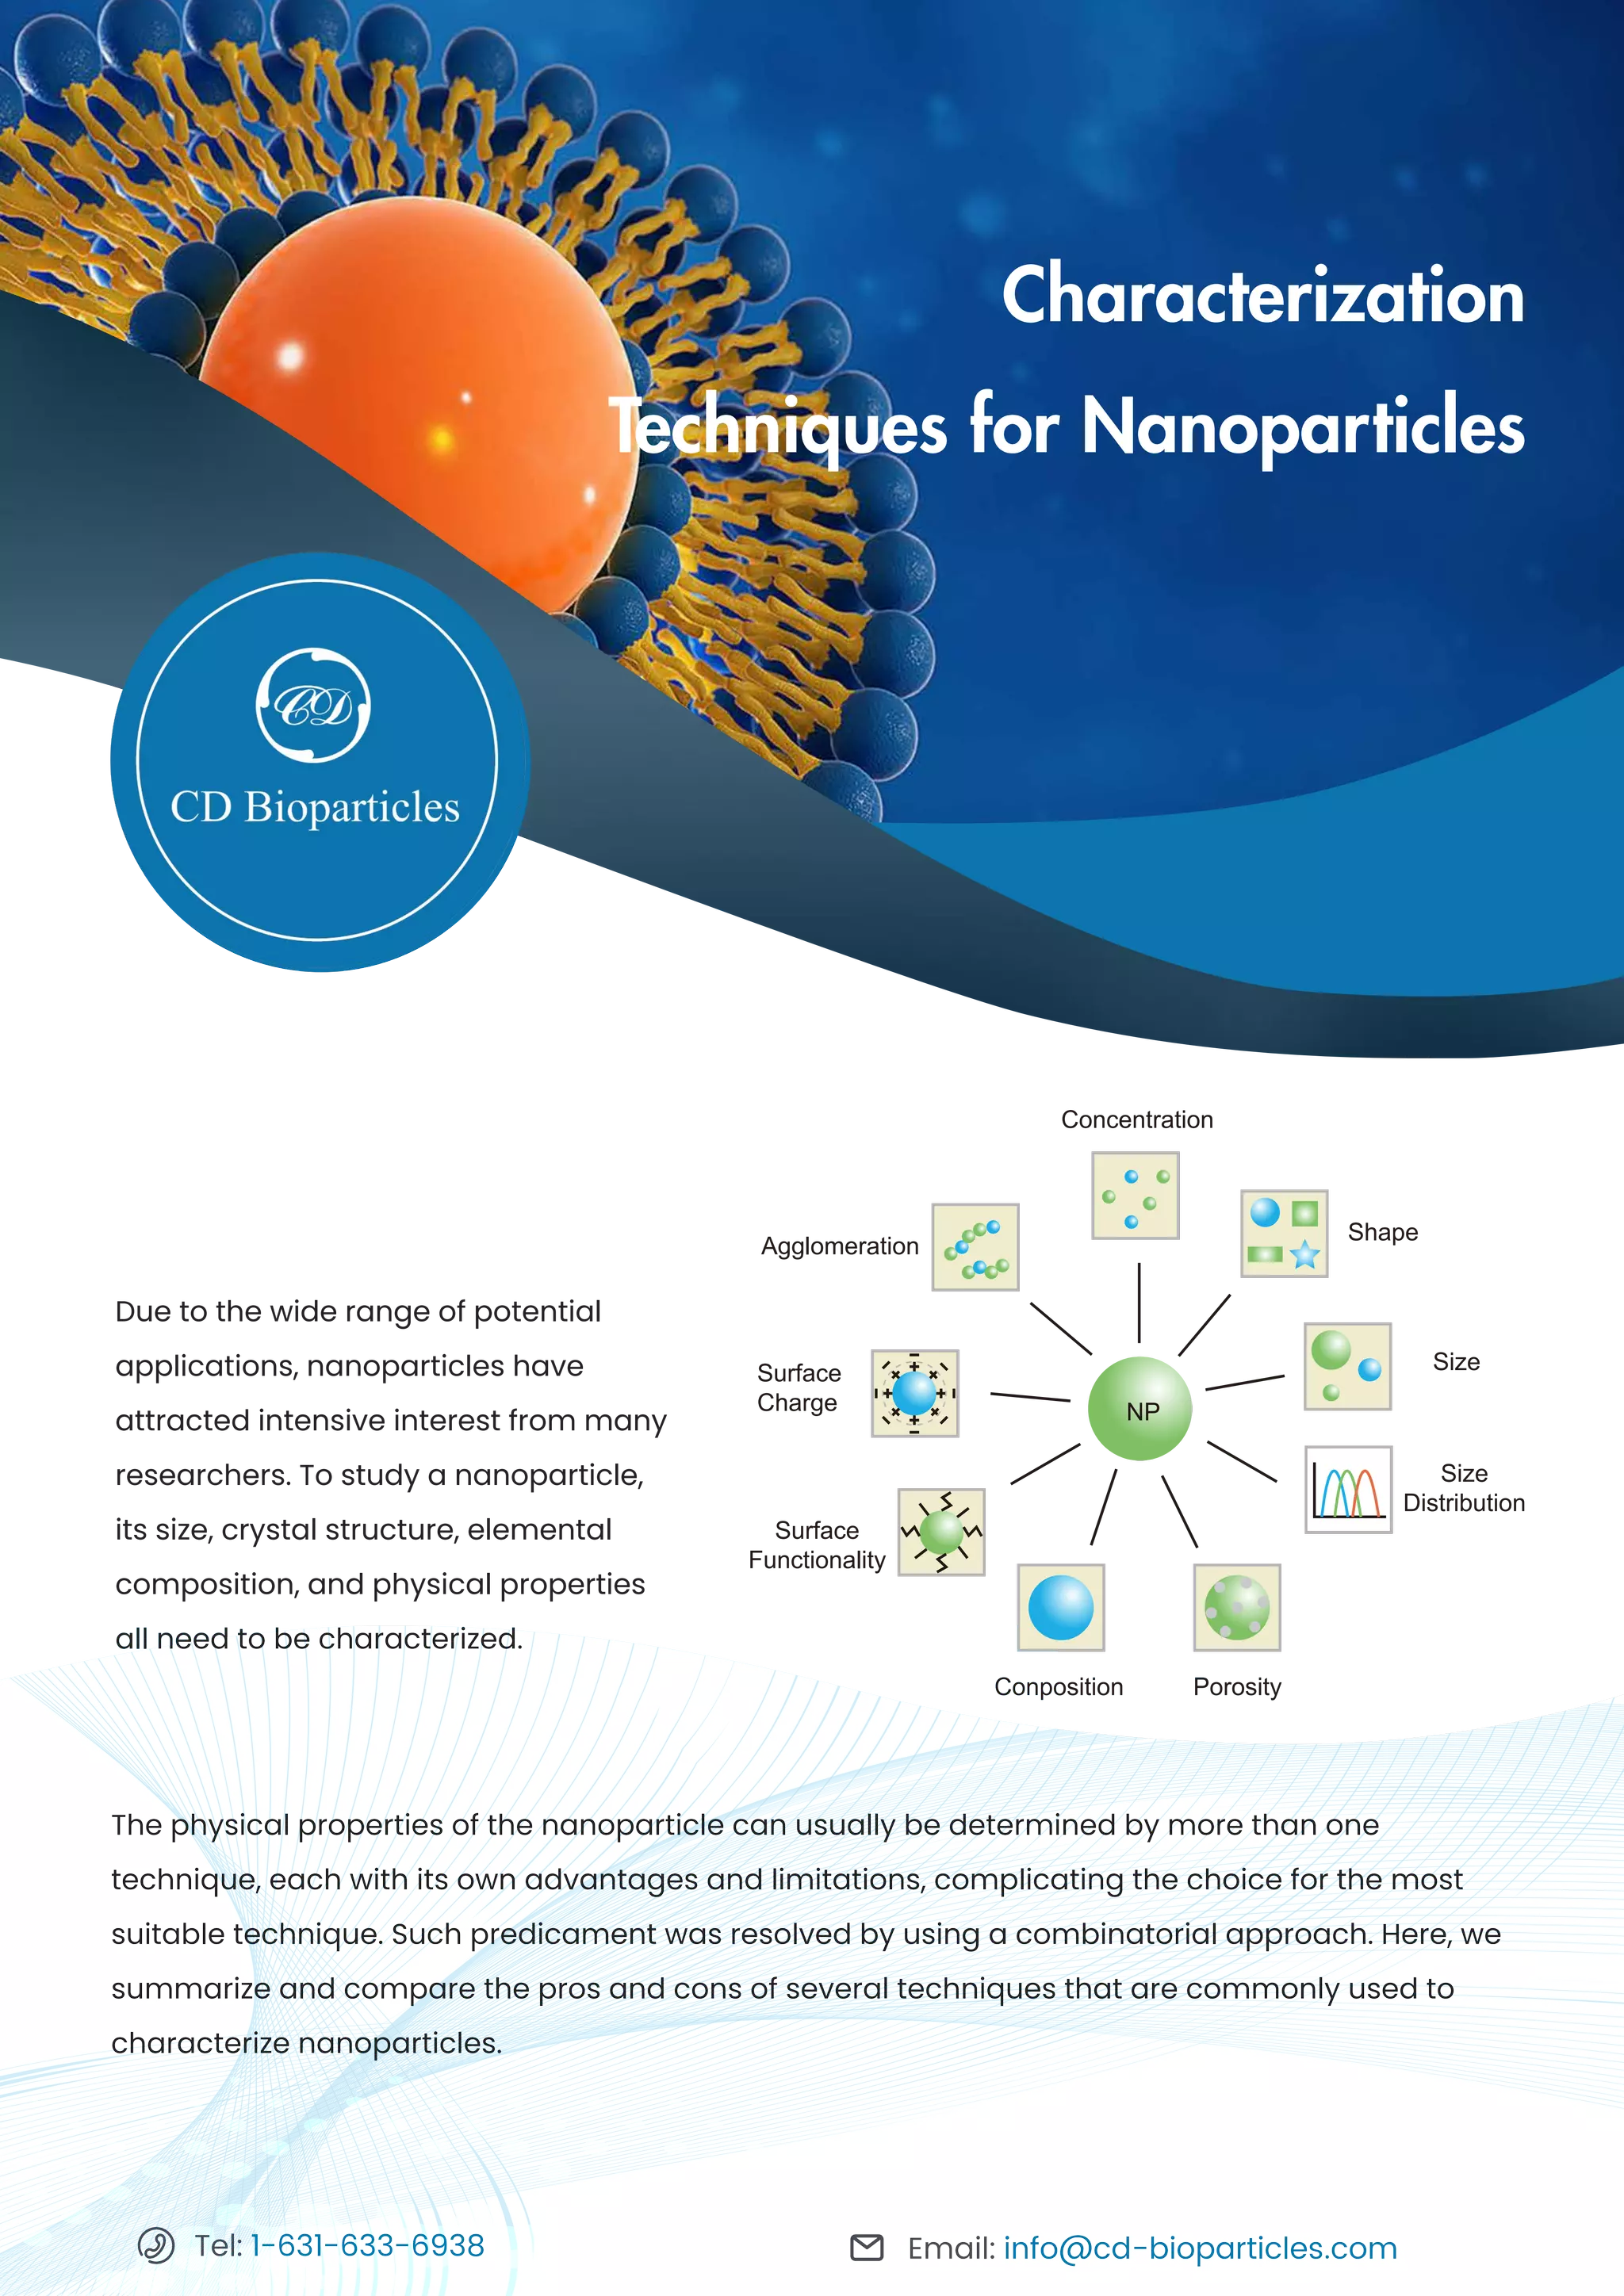
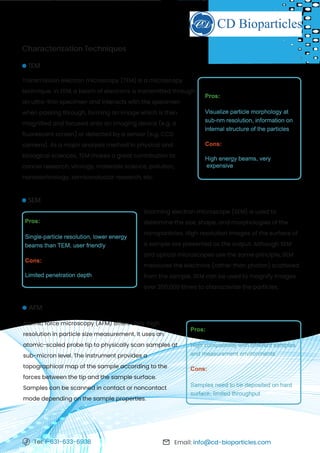
O. Voronkin, S. Lushchin. Laser Diffraction on Particles of a Damaged Surface...Oleksii Voronkin
O. Voronkin, S. Lushchin. Laser Diffraction on Particles of a Damaged Surface Layer of Piezoceramics // Journal of Nano- and Electronic Physics. – 2023. – Vol 15. – № 3. – Р. 03036-1 – 03036-7
O. Voronkin, S. Lushchin. Laser Diffraction on Particles of a Damaged Surface...Oleksii Voronkin
O. Voronkin, S. Lushchin. Laser Diffraction on Particles of a Damaged Surface Layer of Piezoceramics // Journal of Nano- and Electronic Physics. – 2023. – Vol 15. – № 3. – Р. 03036-1 – 03036-7
Abstract
Terahertz spectral analysis has been conducted on epitaxially grown semiconductor structures. Epitaxially grown semiconductors are important for microelectronic and optoelectronic devices and also for integrated circuits
fabricated using semiconductors. In this paper, we report results of terahertz time-domain spectroscopy of grown
SiGe layers on Ge buffer and separately a Ge buffer that was grown on a Si <001> wafer. In particular, evolution of
the time-domain spectra as a function of thickness of both samples was investigated by the terahertz pump-probe
technique. Representative spectra were analyzed to determine the respective layers’ spectral signatures. It was found that the spectroscopic analysis uniquely identified different layers by characteristic absorbance peaks. In addition, terahertz imaging was conducted in a non-destructive, non-contact mode for detecting lattice stacking fault and dislocations. Sub-surface imaging of grown SiGe layers on Ge buffer and that of the Ge buffer grown on a Si wafer reveals interesting lattice features in both samples. A comparison with TEM images of the samples exhibits that the terahertz image reproduces the dimensions found from TEM images within the experimental error limits. In particular, 3D images of both samples were generated by the terahertz reconstructive technique. The images were analyzed by graphical means to determine the respective layer thicknesses. Thus, this technique offers a versatile tool for both semiconductor research and in-line inspections.
State of the Art in the Characterization of Nano- and Atomic-Scale CatalystsDevika Laishram
Nanometer and subnanometer particles and films are becoming an essential and
integral part of new technologies and inventions in different areas. Some of the
most common areas include the microelectronic industry, magnetic recordings,
photovoltaic applications, and optical coatings. Because of the ultrasmall size at
atomic levels, the effect of quantum size becomes prominent, and the sensitivity
of size is defined even by a difference of a single atom. Additionally, the effect
is of utmost importance as the single-atom catalysts are far more advantageous
than conventional catalysts as they tend to anchor easily because of their low
coordination. Also, the presence of a single-atom catalyst in reactions creates
efficient charge transfer as it forms a strong interaction with the support.
Furthermore, catalysts in the subnanometer regime exhibit different electronic
states and adsorption capabilities compared to traditional catalysts. Therefore, to
fully appreciate the subnanometer catalysis reactions, it is essential to study the
means of characterizing the prepared subnano catalysts,
Proteomics Practical (NMR and Protein 3D softwareiqraakbar8
Nuclear magnetic resonance (NMR) is a physical phenomenon in which nuclei in a strong constant magnetic field are perturbed by a weak oscillating magnetic field (in the near field) and respond by producing an electromagnetic signal with a frequency characteristic of the magnetic field at the nucleus.
Particle Size Analysis by Laser Diffraction Method. AshviniTanpure
For Determination of Particle Size various method are used. here I mentioned the Laser Light scattering for determining the Particle Size. Mainly two type of laser scattering are used,
1. Static laser light scattering.
2. Dynamic laser light scattering.
detail about there principle we see in the slide .
.
.
.
If in any point you didn't understood ,you can contact with me.
hope it useful to you.
Thank You.
Richard's aventures in two entangled wonderlandsRichard Gill
Since the loophole-free Bell experiments of 2020 and the Nobel prizes in physics of 2022, critics of Bell's work have retreated to the fortress of super-determinism. Now, super-determinism is a derogatory word - it just means "determinism". Palmer, Hance and Hossenfelder argue that quantum mechanics and determinism are not incompatible, using a sophisticated mathematical construction based on a subtle thinning of allowed states and measurements in quantum mechanics, such that what is left appears to make Bell's argument fail, without altering the empirical predictions of quantum mechanics. I think however that it is a smoke screen, and the slogan "lost in math" comes to my mind. I will discuss some other recent disproofs of Bell's theorem using the language of causality based on causal graphs. Causal thinking is also central to law and justice. I will mention surprising connections to my work on serial killer nurse cases, in particular the Dutch case of Lucia de Berk and the current UK case of Lucy Letby.
Nutraceutical market, scope and growth: Herbal drug technologyLokesh Patil
As consumer awareness of health and wellness rises, the nutraceutical market—which includes goods like functional meals, drinks, and dietary supplements that provide health advantages beyond basic nutrition—is growing significantly. As healthcare expenses rise, the population ages, and people want natural and preventative health solutions more and more, this industry is increasing quickly. Further driving market expansion are product formulation innovations and the use of cutting-edge technology for customized nutrition. With its worldwide reach, the nutraceutical industry is expected to keep growing and provide significant chances for research and investment in a number of categories, including vitamins, minerals, probiotics, and herbal supplements.
This presentation explores a brief idea about the structural and functional attributes of nucleotides, the structure and function of genetic materials along with the impact of UV rays and pH upon them.
DERIVATION OF MODIFIED BERNOULLI EQUATION WITH VISCOUS EFFECTS AND TERMINAL V...Wasswaderrick3
In this book, we use conservation of energy techniques on a fluid element to derive the Modified Bernoulli equation of flow with viscous or friction effects. We derive the general equation of flow/ velocity and then from this we derive the Pouiselle flow equation, the transition flow equation and the turbulent flow equation. In the situations where there are no viscous effects , the equation reduces to the Bernoulli equation. From experimental results, we are able to include other terms in the Bernoulli equation. We also look at cases where pressure gradients exist. We use the Modified Bernoulli equation to derive equations of flow rate for pipes of different cross sectional areas connected together. We also extend our techniques of energy conservation to a sphere falling in a viscous medium under the effect of gravity. We demonstrate Stokes equation of terminal velocity and turbulent flow equation. We look at a way of calculating the time taken for a body to fall in a viscous medium. We also look at the general equation of terminal velocity.
Phenomics assisted breeding in crop improvementIshaGoswami9
As the population is increasing and will reach about 9 billion upto 2050. Also due to climate change, it is difficult to meet the food requirement of such a large population. Facing the challenges presented by resource shortages, climate
change, and increasing global population, crop yield and quality need to be improved in a sustainable way over the coming decades. Genetic improvement by breeding is the best way to increase crop productivity. With the rapid progression of functional
genomics, an increasing number of crop genomes have been sequenced and dozens of genes influencing key agronomic traits have been identified. However, current genome sequence information has not been adequately exploited for understanding
the complex characteristics of multiple gene, owing to a lack of crop phenotypic data. Efficient, automatic, and accurate technologies and platforms that can capture phenotypic data that can
be linked to genomics information for crop improvement at all growth stages have become as important as genotyping. Thus,
high-throughput phenotyping has become the major bottleneck restricting crop breeding. Plant phenomics has been defined as the high-throughput, accurate acquisition and analysis of multi-dimensional phenotypes
during crop growing stages at the organism level, including the cell, tissue, organ, individual plant, plot, and field levels. With the rapid development of novel sensors, imaging technology,
and analysis methods, numerous infrastructure platforms have been developed for phenotyping.
Observation of Io’s Resurfacing via Plume Deposition Using Ground-based Adapt...Sérgio Sacani
Since volcanic activity was first discovered on Io from Voyager images in 1979, changes
on Io’s surface have been monitored from both spacecraft and ground-based telescopes.
Here, we present the highest spatial resolution images of Io ever obtained from a groundbased telescope. These images, acquired by the SHARK-VIS instrument on the Large
Binocular Telescope, show evidence of a major resurfacing event on Io’s trailing hemisphere. When compared to the most recent spacecraft images, the SHARK-VIS images
show that a plume deposit from a powerful eruption at Pillan Patera has covered part
of the long-lived Pele plume deposit. Although this type of resurfacing event may be common on Io, few have been detected due to the rarity of spacecraft visits and the previously low spatial resolution available from Earth-based telescopes. The SHARK-VIS instrument ushers in a new era of high resolution imaging of Io’s surface using adaptive
optics at visible wavelengths.
Earliest Galaxies in the JADES Origins Field: Luminosity Function and Cosmic ...Sérgio Sacani
We characterize the earliest galaxy population in the JADES Origins Field (JOF), the deepest
imaging field observed with JWST. We make use of the ancillary Hubble optical images (5 filters
spanning 0.4−0.9µm) and novel JWST images with 14 filters spanning 0.8−5µm, including 7 mediumband filters, and reaching total exposure times of up to 46 hours per filter. We combine all our data
at > 2.3µm to construct an ultradeep image, reaching as deep as ≈ 31.4 AB mag in the stack and
30.3-31.0 AB mag (5σ, r = 0.1” circular aperture) in individual filters. We measure photometric
redshifts and use robust selection criteria to identify a sample of eight galaxy candidates at redshifts
z = 11.5 − 15. These objects show compact half-light radii of R1/2 ∼ 50 − 200pc, stellar masses of
M⋆ ∼ 107−108M⊙, and star-formation rates of SFR ∼ 0.1−1 M⊙ yr−1
. Our search finds no candidates
at 15 < z < 20, placing upper limits at these redshifts. We develop a forward modeling approach to
infer the properties of the evolving luminosity function without binning in redshift or luminosity that
marginalizes over the photometric redshift uncertainty of our candidate galaxies and incorporates the
impact of non-detections. We find a z = 12 luminosity function in good agreement with prior results,
and that the luminosity function normalization and UV luminosity density decline by a factor of ∼ 2.5
from z = 12 to z = 14. We discuss the possible implications of our results in the context of theoretical
models for evolution of the dark matter halo mass function.
Deep Behavioral Phenotyping in Systems Neuroscience for Functional Atlasing a...Ana Luísa Pinho
Functional Magnetic Resonance Imaging (fMRI) provides means to characterize brain activations in response to behavior. However, cognitive neuroscience has been limited to group-level effects referring to the performance of specific tasks. To obtain the functional profile of elementary cognitive mechanisms, the combination of brain responses to many tasks is required. Yet, to date, both structural atlases and parcellation-based activations do not fully account for cognitive function and still present several limitations. Further, they do not adapt overall to individual characteristics. In this talk, I will give an account of deep-behavioral phenotyping strategies, namely data-driven methods in large task-fMRI datasets, to optimize functional brain-data collection and improve inference of effects-of-interest related to mental processes. Key to this approach is the employment of fast multi-functional paradigms rich on features that can be well parametrized and, consequently, facilitate the creation of psycho-physiological constructs to be modelled with imaging data. Particular emphasis will be given to music stimuli when studying high-order cognitive mechanisms, due to their ecological nature and quality to enable complex behavior compounded by discrete entities. I will also discuss how deep-behavioral phenotyping and individualized models applied to neuroimaging data can better account for the subject-specific organization of domain-general cognitive systems in the human brain. Finally, the accumulation of functional brain signatures brings the possibility to clarify relationships among tasks and create a univocal link between brain systems and mental functions through: (1) the development of ontologies proposing an organization of cognitive processes; and (2) brain-network taxonomies describing functional specialization. To this end, tools to improve commensurability in cognitive science are necessary, such as public repositories, ontology-based platforms and automated meta-analysis tools. I will thus discuss some brain-atlasing resources currently under development, and their applicability in cognitive as well as clinical neuroscience.
Remote Sensing and Computational, Evolutionary, Supercomputing, and Intellige...University of Maribor
Slides from talk:
Aleš Zamuda: Remote Sensing and Computational, Evolutionary, Supercomputing, and Intelligent Systems.
11th International Conference on Electrical, Electronics and Computer Engineering (IcETRAN), Niš, 3-6 June 2024
Inter-Society Networking Panel GRSS/MTT-S/CIS Panel Session: Promoting Connection and Cooperation
https://www.etran.rs/2024/en/home-english/
1. Characterization
Techniques for Nanoparticles
Due to the wide range of potential
applications, nanoparticles have
attracted intensive interest from many
researchers. To study a nanoparticle,
its size, crystal structure, elemental
composition, and physical properties
all need to be characterized.
CD
Email: info@cd-bioparticles.com
Tel: 1-631-633-6938
Concentration
Shape
Size
Size
Distribution
Porosity
Conposition
Surface
Functionality
Surface
Charge
Agglomeration
NP
The physical properties of the nanoparticle can usually be determined by more than one
technique, each with its own advantages and limitations, complicating the choice for the most
suitable technique. Such predicament was resolved by using a combinatorial approach. Here, we
summarize and compare the pros and cons of several techniques that are commonly used to
characterize nanoparticles.
2. The size of an object is its spatial extent. For a
spherical object, its size can be easily described.
But to fully present the actual extension of a
non-spherical object, several parameters need to
be defined at the same time. Size of a
macroscopic object (>1 mm) can be obtained by
measuring the distance between different ends.
However, for a nanoscale object, the concept of its
size can convey different meanings according to
the technique used to measure it, including 1) its
overall physical dimensions defined by the atomic
structure; 2) an effective size of the particle in a
certain matrix according to its
diffusion/sedimentation behavior, possibly
including adsorption of matrix constituents to the
nanoparticle surface, agglomeration or
aggregation of the particles in the matrix; 3) an
effective size of the nanoparticle, weighted by its
mass/electron distribution.
What to Measure?
Email: info@cd-bioparticles.com
Tel: 1-631-633-6938
Size
Generally, nanoparticles are assumed to
be spherical. While in fact, nanoparticles
are in various geometric forms and
irregular shapes, such as nanorods,
star-shape, or cage-shape. Particle
morphology can largely affect a
nanoparticle’s properties, including its
surface-binding capability, cellular uptake
and release, and optical and plasmonic
effects. High-resolution microscopy
techniques can be applied to characterize
the nanoparticle morphology.
Shape
Porosity is usually defined as the ratio of
pore volume to the total volume of a
particle, and the porous structure of the
nanoparticle greatly expands the range of
applications. The pores on the surface of the
particles drastically increase the
surface-to-volume ratio, which could
exceed that of non-porous particles of
equal dimensions by several orders of
magnitude. Moreover, porous structures
contribute to the inner pore functionalization
for controlled host-guest interactions, and
outer functionalization for targeting
purposes and drug release at the intended
target site.
Porosity
Zeta potential (ζ) refers to the electric potential
difference between the stationary layer of charges
surrounding the particles and the solution
potential. It can be used to describe the surface
charge and colloidal stability of nanoparticles.
Generally, if the measured absolute value of zeta
potential is over 15 mV, it can be considered
colloidally stable. The Zeta potential depends not
only on the particle itself, but also on the state of
the environment, such as pH, ionic strength, and
the type of ions in the suspension.
Surface charge
3. Characterization Techniques
Email: info@cd-bioparticles.com
Tel: 1-631-633-6938
Transmission electron microscopy (TEM) is a microscopy
technique. In TEM, a beam of electrons is transmitted through
an ultra-thin specimen and interacts with the specimen
when passing through, forming an image which is then
magnified and focused onto an imaging device (e.g. a
fluorescent screen) or detected by a sensor (e.g. CCD
camera). As a major analysis method in physical and
biological sciences, TEM makes a great contribution to
cancer research, virology, materials science, pollution,
nanotechnology, semiconductor research, etc.
Scanning electron microscope (SEM) is used to
determine the size, shape, and morphologies of the
nanoparticles. High resolution images of the surface of
a sample are presented as the output. Although SEM
and optical microscopes use the same principle, SEM
measures the electrons (rather than photon) scattered
from the sample. SEM can be used to magnify images
over 200,000 times to characterize the particles.
TEM
Pros:
Visualize particle morphology at
sub-nm resolution, information on
internal structure of the particles
Cons:
High energy beams, very
expensive
SEM
Pros:
Single-particle resolution, lower energy
beams than TEM, user friendly
Cons:
Limited penetration depth
Atomic force microscopy (AFM) offers ultra-high
resolution in particle size measurement. It uses an
atomic-scaled probe tip to physically scan samples at
sub-micron level. The instrument provides a
topographical map of the sample according to the
forces between the tip and the sample surface.
Samples can be scanned in contact or noncontact
mode depending on the sample properties.
AFM
Pros:
High compatibility with different samples
and measurement environments
Cons:
Samples need to be deposited on hard
surface, limited throughput
4. Email: info@cd-bioparticles.com
Tel: 1-631-633-6938
X-ray diffraction (XRD) is a conventional technique to
determine the crystallographic structure and
morphology, of which the intensity is increased or
decreased with the amount of constituent. XRD can be
used to establish the metallic nature of particles and
provide information on translational symmetry size and
shape of the unit cell from peak positions as well as the
information on electron density inside the unit cell.
XRD
Pros:
Rapid, provides information on crystal
structure
Cons:
No information on particle size
Small-angle X-ray scattering (SAXS) is a
small-angle scattering technique that quantifies
the nanoscale density differences in a sample. This
method can determine nanoparticle size
distributions, size and shape of macromolecules,
pore sizes, characteristic distances of partially
ordered materials, etc.
SAXS
Pros:
High sensitivity, compatible for both dry
particles and in suspension
Cons:
Previous knowledge of particle morphology is
required for fitting the data
X-ray absorption spectroscopy (XAS) has been
widely used to determine the local geometric and
electronic structure of the matter. This measurement
is usually conducted at synchrotron radiation
facilities with intense and tunable X-ray beams.
Samples can be in gas, liquid, or solid phases.
XAS
Pros:
Highly sensitive even in very low concentrations
Cons:
Not a routine or readily available technique
The gas adsorption is an analysis method based
on the gas absorption characteristic on solid
surfaces, which is usually used to measure the
specific surface area and pore size distribution
of materials for the size range between
millimeters to nanometers.
Gas adsorption
Pros:
Compatible with polydisperse and aggregated
samples
Cons:
Requires sample degassing, no information on
particle morphology
5. Email: info@cd-bioparticles.com 5
Tel: 1-631-633-6938
Static light scattering (SLS) measures the absolute
molecular weight, utilizing the principle that builds on
the relationship between the intensity of light
scattered by a molecule and its molecular weight
and size. In other words, larger molecules scatter
higher intensity of light, that is in proportion to the
molecule’s molecular weight, than smaller molecules
from a given light source.
SLS
Pros:
Molecular weight and radius of gyration of
particles in solution
Cons:
Highly biased toward larger particles in
suspension
Mass spectrometry (MS) is an analysis method for
measuring the mass-to-charge ratio (m/z) of one or
more molecules in a sample. These measurements can
also be used to calculate the exact molecular weight of
the sample components. Moreover, for unknown
compounds, they can be identified by mass
spectrometers via molecular weight determination; for
known compounds, they can be quantified as well as
used to determine the structure and chemical properties.
MS
Pros:
Information on elemental composition
Cons:
Sample ionization (might affect particle
stability)
Dynamic light scattering (DLS) is used to
determine the size distribution of small particles
in suspension or polymers in solution. In the
scope of DLS, temporal fluctuations are usually
analyzed by means of the intensity or photon
auto-correlation function (also known as photon
correlation spectroscopy or quasi-elastic light
scattering).
DLS
Pros:
Rapid, provides information on nanoparticle
behavior in solution
Cons:
Highly biased toward larger particles in
suspension, no information on particle shape
6. Email: info@cd-bioparticles.com
Tel: 1-631-633-6938
Fluorescence correlation spectroscopy (FCS) is to
analyze the correlation of temporal fluctuations of the
fluorescence intensity. This technique records temporal
changes in the fluorescence emission intensity caused
by single fluorophores passing the detection volume,
by which the average number of fluorescent particles
in the detection volume and their average diffusion
time through the volume can be obtained.
Concentration, size, and shape of the particle or
viscosity of the environment can then be determined.
FCS
Pros:
Selectivity provided by the fluorescence
detection
Cons:
Need of fluorescent labels (if sample is not
fluorescent)
5
Electrophoretic Light Scattering (ELS) determines
the electrophoretic mobility of particles in
dispersion or molecules in solution. This mobility is
usually converted to Zeta potential so that
materials under different experimental conditions
can be compared.
ELS
Pros:
Rapid, typically combined with DLS
Cons:
Indirect estimation of zeta potential from
electrophoretic mobility, ensemble-based
NTA
Nanoparticle tracking analysis (NTA) is used to
visualize and analyze particles in liquid by relating the
rate of Brownian motion to particle size. The rate of
movement is only associated with the viscosity and
temperature of the liquid rather than the particle
density or refractive index. This method can determine
the size distribution of small particles with a diameter
of about 10-1000 nm in liquid suspension.
Pros:
Single-particle resolution, suitable for highly
polydisperse samples
Cons:
Requires sample dilution and highly
scattering particles
7. Email: info@cd-bioparticles.com
Tel: 1-631-633-6938
Tunable resistive pulse sensing (TRPS) is a technique
that allows high-throughput single-particle
measurements as colloids and/or biomolecular
analytes driven through a size-tunable nanopore, one at
a time. As a single-particle analyzer, it adapts the
principle of resistive pulse sensing for quantitative size
measurements, which monitors current flow through an
aperture. Combined with the use of tunable nanopore
technology, TRPS allows the passage of ionic current
and particles to be regulated by adjusting the pore size.
TRPS
Pros:
Tunable detection range, single-particle
resolution, provides information on surface
charge
Cons:
Requires (highly) conductive solutions,
requires careful calibration
5
Analytical ultracentrifugation (AUC) can be used
to characterize materials such as polymers,
biopolymers, polyelectrolytes, nanoparticles,
dispersions, and other colloidal systems. This
technique can determine the molar mass, size,
density of the particles, and interaction
parameters such as virial coefficients and
association constants.
AUC
Pros:
High-sensitivity, compatible with multimodal
population
Cons:
High-cost equipment, highly trained users
The principle of field-flow fractionation (FFF) is
based on the dual effects of flow behavior and
field distribution in a thin andopen channel. This
method sorts and isolates nanoparticles by size
or conduct size/spectroscopic characterization
by uncorrelated detection methods.
FFF
Pros:
Highly tunable (different accumulation forces can
be used), provides monodisperse sample fractions
Cons:
Sample recovery and choice of experimental
parameters can be challenging
8. 5
Tel: 1-631-633-6938
Fax: 1-631-938-8221
Email: info@cd-bioparticles.com
Address: 45-1 Ramsey Road, Shirley, NY 11967, USA
For more information,
view our website: www.cd-bioparticles.com
5
Creative Diagnostics offers a comprehensive list of nanoparticles with precise characterization.
Please visit our website for more information.
SEC
Size-exclusion chromatography (SEC) is a
chromatographic method. Molecules,
usually large molecules or macromolecular
complexes in a solution can be separated
by the differences of their size or molecular
weight via SEC.
Pros:
Provides highly monodisperse sample fractions,
compatible with industrial settings
Cons:
Absolute size quantification might be challenging
due to particle-solid phase interaction
References:
Heera, P., & Shanmugam, S. (2015). Nanoparticle characterization and application: an overview. Int.
J. Curr. Microbiol. App. Sci, 4(8), 379-386.
Modena, M. M., Rühle, B., Burg, T. P., & Wuttke, S. (2019). Nanoparticle Characterization: What to
Measure?. Advanced Materials, 1901556.
Jiao, X., Tanner, E. E., Sokolov, S. V., Palgrave, R. G., Young, N. P., & Compton, R. G. (2017). Understanding
nanoparticle porosity via nanoimpacts and XPS: electro-oxidation of platinum nanoparticle
aggregates. Physical Chemistry Chemical Physics, 19(21), 13547-13552.
Mourdikoudis, S., Pallares, R. M., & Thanh, N. T. (2018). Characterization techniques for nanoparticles:
Comparison and complementarity upon studying nanoparticle properties. Nanoscale, 10(27),
12871-12934.
Pal, S. L., Jana, U., Manna, P. K., Mohanta, G. P., & Manavalan, R. (2011). Nanoparticle: An overview of
preparation and characterization. Journal of applied pharmaceutical science, 1(6), 228-234.
1.
2.
3.
4.
5.