Download to read offline

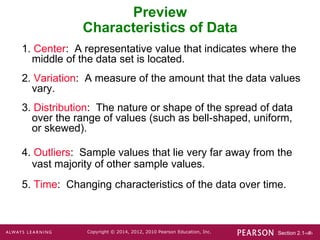
This document contains copyright information and outlines for chapters 2 and section 2.1 of a statistics textbook. It discusses key characteristics of data such as center, variation, distribution, outliers, and time. The section preview lists these characteristics and how they relate to analyzing data.


