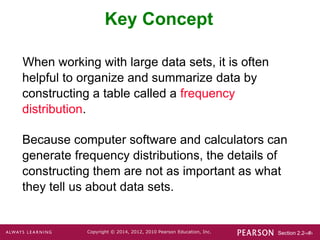
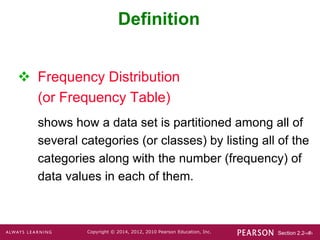
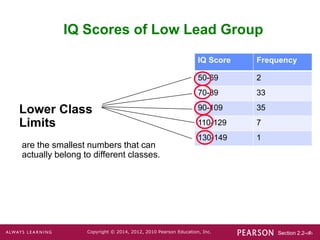
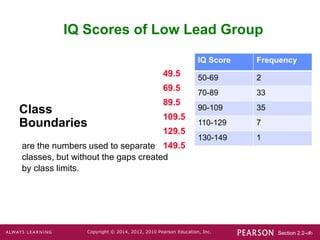
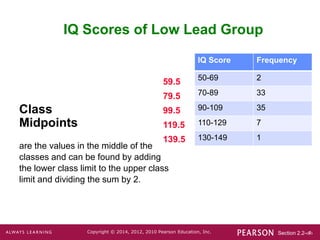
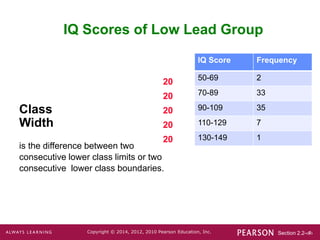
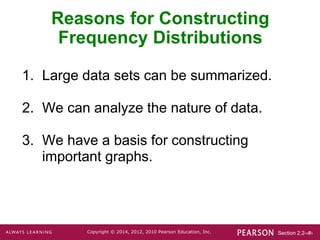
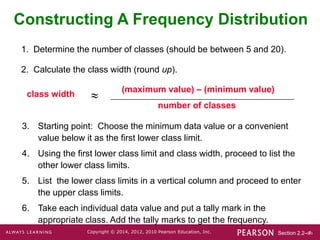
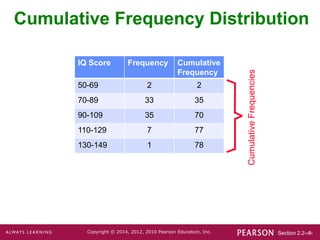
1. Frequency distributions organize and summarize large data sets by partitioning data into categories and listing the frequency of data values in each category.
2. They allow us to analyze the nature of data and provide a basis for constructing important graphs.
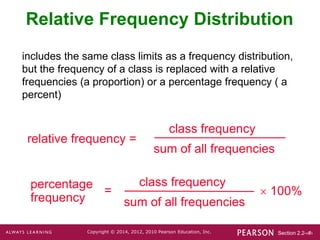
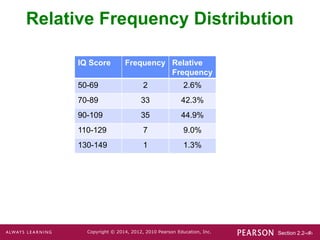
3. Elements of a frequency distribution include class limits, frequencies, relative frequencies, and cumulative frequencies.