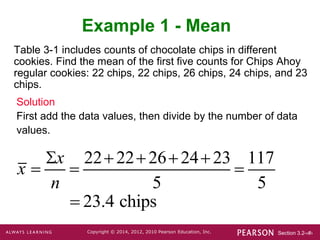
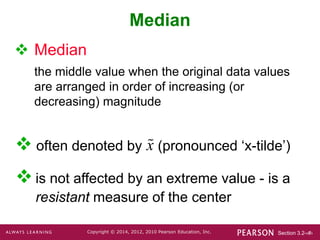
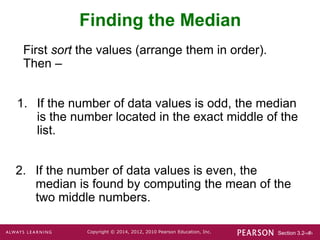
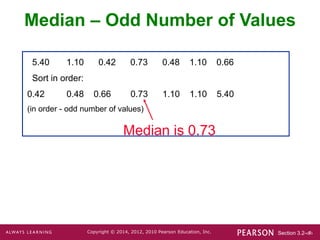
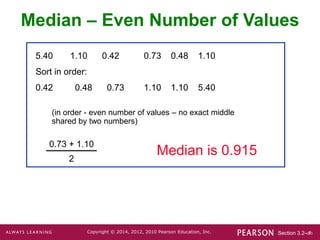
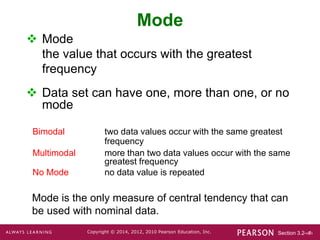
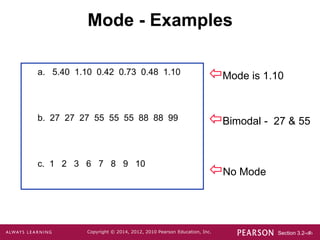
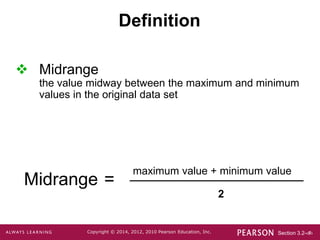
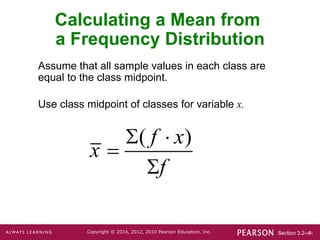
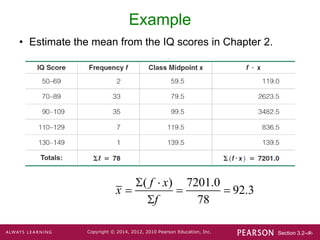
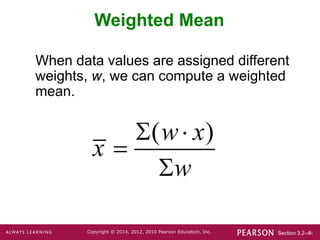
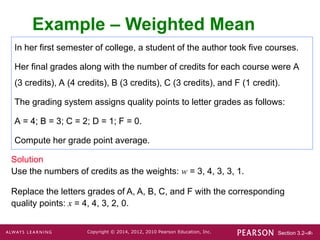
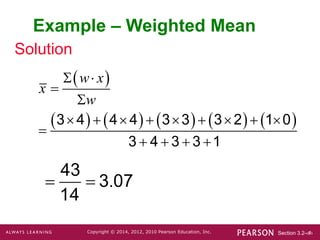
Section 3.2-‹#›
Copyright © 2014, 2012, 2010 Pearson Education, Inc.
Lecture Slides
Elementary Statistics
Twelfth Edition
and the Triola Statistics Series
by Mario F. Triola
Section 3.2-‹#›
Copyright © 2014, 2012, 2010 Pearson Education, Inc.
Chapter 3
Statistics for Describing,
Exploring, and Comparing Data
3-1 Review and Preview
3-2 Measures of Center
3-3 Measures of Variation
3-4 Measures of Relative Standing and
Boxplots
Section 3.2-‹#›
Copyright © 2014, 2012, 2010 Pearson Education, Inc.
Key Concept
Characteristics of center of a data set.
Measures of center, including mean and median,
as tools for analyzing data.
Not only determine the value of each measure of
center, but also interpret those values.
Section 3.2-‹#›
Copyright © 2014, 2012, 2010 Pearson Education, Inc.
Basics Concepts of Measures
of Center
 Measure of Center
the value at the center or
middle of a data set
Part 1
Section 3.2-‹#›
Copyright © 2014, 2012, 2010 Pearson Education, Inc.
Arithmetic Mean
 Arithmetic Mean (Mean)
the measure of center obtained by
adding the values and dividing the total
by the number of values
What most people call an average.
Section 3.2-‹#›
Copyright © 2014, 2012, 2010 Pearson Education, Inc.
Notation
denotes the sum of a set of values.
is the variable usually used to represent the individual
data values.
represents the number of data values in a sample.
represents the number of data values in a population.

x
n
N
Section 3.2-‹#›
Copyright © 2014, 2012, 2010 Pearson Education, Inc.
x

x
N



x
x
n


Notation
is pronounced ‘mu’ and denotes the mean of all values in a population
is pronounced ‘x-bar’ and denotes the mean of a set of sample values
Section 3.2-‹#›
Copyright © 2014, 2012, 2010 Pearson Education, Inc.
 Advantages
 Sample means drawn from the same population tend to
vary less than other measures of center
 Takes every data value into account
Mean
 Disadvantage
 Is sensitive to every data value, one extreme value can
affect it dramatically; is not a resistant measure of center
Section 3.2-‹#›
Copyright © 2014, 2012, 2010 Pearson Education, Inc.
Table 3-1 includes counts of chocolate chips in different
cookies. Find the mean of the first five counts for Chips Ahoy
regular cookies: 22 chips, 22 chips, 26 chips, 24 chips, and 23
chips.
Example 1 - Mean
Solution
First add the data values, then divide by the number of data
values.
x 
x
n

2222262423
5

117
5
 23.4 chips
Section 3.2-‹#›
Copyright © 2014, 2012, 2010 Pearson Education, Inc.
 often denoted by (pronounced ‘x-tilde’)
Median
 Median
the middle value when the original data values
are arranged in order of increasing (or
decreasing) magnitude
 is not affected by an extreme value - is a
resistant measure of the center
x
Section 3.2-‹#›
Copyright © 2014, 2012, 2010 Pearson Education, Inc.
Finding the Median
1. If the number of data values is odd, the median
is the number located in the exact middle of the
list.
2. If the number of data values is even, the
median is found by computing the mean of the
two middle numbers.
First sort the values (arrange them in order).
Then –
Section 3.2-‹#›
Copyright © 2014, 2012, 2010 Pearson Education, Inc.
5.40 1.10 0.42 0.73 0.48 1.10 0.66
Sort in order:
0.42 0.48 0.66 0.73 1.10 1.10 5.40
(in order - odd number of values)
Median is 0.73
Median – Odd Number of Values
Section 3.2-‹#›
Copyright © 2014, 2012, 2010 Pearson Education, Inc.
5.40 1.10 0.42 0.73 0.48 1.10
Sort in order:
0.42 0.48 0.73 1.10 1.10 5.40
0.73 + 1.10
2
(in order - even number of values – no exact middle
shared by two numbers)
Median is 0.915
Median – Even Number of Values
Section 3.2-‹#›
Copyright © 2014, 2012, 2010 Pearson Education, Inc.
Mode
 Mode
the value that occurs with the greatest
frequency
 Data set can have one, more than one, or no
mode
Mode is the only measure of central tendency that can
be used with nominal data.
Bimodal two data values occur with the same greatest
frequency
Multimodal more than two data values occur with the same
greatest frequency
No Mode no data value is repeated
Section 3.2-‹#›
Copyright © 2014, 2012, 2010 Pearson Education, Inc.
a. 5.40 1.10 0.42 0.73 0.48 1.10
b. 27 27 27 55 55 55 88 88 99
c. 1 2 3 6 7 8 9 10
Mode - Examples
Mode is 1.10
No Mode
Bimodal - 27 & 55
Section 3.2-‹#›
Copyright © 2014, 2012, 2010 Pearson Education, Inc.
 Midrange
the value midway between the maximum and minimum
values in the original data set
Definition
Midrange =
maximum value + minimum value
2
Section 3.2-‹#›
Copyright © 2014, 2012, 2010 Pearson Education, Inc.
 Sensitive to extremes
because it uses only the maximum and
minimum values, it is rarely used
Midrange
 Redeeming Features
(1) very easy to compute
(2) reinforces that there are several ways to
define the center
(3) avoid confusion with median by defining
the midrange along with the median
Section 3.2-‹#›
Copyright © 2014, 2012, 2010 Pearson Education, Inc.
Carry one more decimal place than is present
in the original set of values
Round-off Rule for
Measures of Center
Section 3.2-‹#›
Copyright © 2014, 2012, 2010 Pearson Education, Inc.
Think about the method used to collect the
sample data.
Critical Thinking
Think about whether the results are
reasonable.
Section 3.2-‹#›
Copyright © 2014, 2012, 2010 Pearson Education, Inc.
Example
Identify the reason why the mean and median would
not be meaningful statistics.
a. Rank (by sales) of selected statistics textbooks:
1, 4, 3, 2, 15
b. Numbers on the jerseys of the starting offense for
the New Orleans Saints when they last won the
Super Bowl: 12, 74, 77, 76, 73, 78, 88, 19, 9, 23,
25
Section 3.2-‹#›
Copyright © 2014, 2012, 2010 Pearson Education, Inc.
Beyond the Basics of
Measures of Center
Part 2
Section 3.2-‹#›
Copyright © 2014, 2012, 2010 Pearson Education, Inc.
Assume that all sample values in each class are
equal to the class midpoint.
Use class midpoint of classes for variable x.
Calculating a Mean from
a Frequency Distribution
( )
f x
x
f
 


Section 3.2-‹#›
Copyright © 2014, 2012, 2010 Pearson Education, Inc.
Example
• Estimate the mean from the IQ scores in Chapter 2.
( ) 7201.0
92.3
78
f x
x
f
 
  

Section 3.2-‹#›
Copyright © 2014, 2012, 2010 Pearson Education, Inc.
Weighted Mean
When data values are assigned different
weights, w, we can compute a weighted
mean.
( )
w x
x
w
 


Section 3.2-‹#›
Copyright © 2014, 2012, 2010 Pearson Education, Inc.
In her first semester of college, a student of the author took five courses.
Her final grades along with the number of credits for each course were A
(3 credits), A (4 credits), B (3 credits), C (3 credits), and F (1 credit).
The grading system assigns quality points to letter grades as follows:
A = 4; B = 3; C = 2; D = 1; F = 0.
Compute her grade point average.
Example – Weighted Mean
Solution
Use the numbers of credits as the weights: w = 3, 4, 3, 3, 1.
Replace the letters grades of A, A, B, C, and F with the corresponding
quality points: x = 4, 4, 3, 2, 0.
Section 3.2-‹#›
Copyright © 2014, 2012, 2010 Pearson Education, Inc.
Solution
Example – Weighted Mean
 
         
3 4 4 4 3 3 3 2 1 0
3 4 3 3 1
 


        

   
w x
x
w
.
43
3 07
14
 

Chapter 3 Section 2.ppt

  • 1.
    Section 3.2-‹#› Copyright ©2014, 2012, 2010 Pearson Education, Inc. Lecture Slides Elementary Statistics Twelfth Edition and the Triola Statistics Series by Mario F. Triola
  • 2.
    Section 3.2-‹#› Copyright ©2014, 2012, 2010 Pearson Education, Inc. Chapter 3 Statistics for Describing, Exploring, and Comparing Data 3-1 Review and Preview 3-2 Measures of Center 3-3 Measures of Variation 3-4 Measures of Relative Standing and Boxplots
  • 3.
    Section 3.2-‹#› Copyright ©2014, 2012, 2010 Pearson Education, Inc. Key Concept Characteristics of center of a data set. Measures of center, including mean and median, as tools for analyzing data. Not only determine the value of each measure of center, but also interpret those values.
  • 4.
    Section 3.2-‹#› Copyright ©2014, 2012, 2010 Pearson Education, Inc. Basics Concepts of Measures of Center  Measure of Center the value at the center or middle of a data set Part 1
  • 5.
    Section 3.2-‹#› Copyright ©2014, 2012, 2010 Pearson Education, Inc. Arithmetic Mean  Arithmetic Mean (Mean) the measure of center obtained by adding the values and dividing the total by the number of values What most people call an average.
  • 6.
    Section 3.2-‹#› Copyright ©2014, 2012, 2010 Pearson Education, Inc. Notation denotes the sum of a set of values. is the variable usually used to represent the individual data values. represents the number of data values in a sample. represents the number of data values in a population.  x n N
  • 7.
    Section 3.2-‹#› Copyright ©2014, 2012, 2010 Pearson Education, Inc. x  x N    x x n   Notation is pronounced ‘mu’ and denotes the mean of all values in a population is pronounced ‘x-bar’ and denotes the mean of a set of sample values
  • 8.
    Section 3.2-‹#› Copyright ©2014, 2012, 2010 Pearson Education, Inc.  Advantages  Sample means drawn from the same population tend to vary less than other measures of center  Takes every data value into account Mean  Disadvantage  Is sensitive to every data value, one extreme value can affect it dramatically; is not a resistant measure of center
  • 9.
    Section 3.2-‹#› Copyright ©2014, 2012, 2010 Pearson Education, Inc. Table 3-1 includes counts of chocolate chips in different cookies. Find the mean of the first five counts for Chips Ahoy regular cookies: 22 chips, 22 chips, 26 chips, 24 chips, and 23 chips. Example 1 - Mean Solution First add the data values, then divide by the number of data values. x  x n  2222262423 5  117 5  23.4 chips
  • 10.
    Section 3.2-‹#› Copyright ©2014, 2012, 2010 Pearson Education, Inc.  often denoted by (pronounced ‘x-tilde’) Median  Median the middle value when the original data values are arranged in order of increasing (or decreasing) magnitude  is not affected by an extreme value - is a resistant measure of the center x
  • 11.
    Section 3.2-‹#› Copyright ©2014, 2012, 2010 Pearson Education, Inc. Finding the Median 1. If the number of data values is odd, the median is the number located in the exact middle of the list. 2. If the number of data values is even, the median is found by computing the mean of the two middle numbers. First sort the values (arrange them in order). Then –
  • 12.
    Section 3.2-‹#› Copyright ©2014, 2012, 2010 Pearson Education, Inc. 5.40 1.10 0.42 0.73 0.48 1.10 0.66 Sort in order: 0.42 0.48 0.66 0.73 1.10 1.10 5.40 (in order - odd number of values) Median is 0.73 Median – Odd Number of Values
  • 13.
    Section 3.2-‹#› Copyright ©2014, 2012, 2010 Pearson Education, Inc. 5.40 1.10 0.42 0.73 0.48 1.10 Sort in order: 0.42 0.48 0.73 1.10 1.10 5.40 0.73 + 1.10 2 (in order - even number of values – no exact middle shared by two numbers) Median is 0.915 Median – Even Number of Values
  • 14.
    Section 3.2-‹#› Copyright ©2014, 2012, 2010 Pearson Education, Inc. Mode  Mode the value that occurs with the greatest frequency  Data set can have one, more than one, or no mode Mode is the only measure of central tendency that can be used with nominal data. Bimodal two data values occur with the same greatest frequency Multimodal more than two data values occur with the same greatest frequency No Mode no data value is repeated
  • 15.
    Section 3.2-‹#› Copyright ©2014, 2012, 2010 Pearson Education, Inc. a. 5.40 1.10 0.42 0.73 0.48 1.10 b. 27 27 27 55 55 55 88 88 99 c. 1 2 3 6 7 8 9 10 Mode - Examples Mode is 1.10 No Mode Bimodal - 27 & 55
  • 16.
    Section 3.2-‹#› Copyright ©2014, 2012, 2010 Pearson Education, Inc.  Midrange the value midway between the maximum and minimum values in the original data set Definition Midrange = maximum value + minimum value 2
  • 17.
    Section 3.2-‹#› Copyright ©2014, 2012, 2010 Pearson Education, Inc.  Sensitive to extremes because it uses only the maximum and minimum values, it is rarely used Midrange  Redeeming Features (1) very easy to compute (2) reinforces that there are several ways to define the center (3) avoid confusion with median by defining the midrange along with the median
  • 18.
    Section 3.2-‹#› Copyright ©2014, 2012, 2010 Pearson Education, Inc. Carry one more decimal place than is present in the original set of values Round-off Rule for Measures of Center
  • 19.
    Section 3.2-‹#› Copyright ©2014, 2012, 2010 Pearson Education, Inc. Think about the method used to collect the sample data. Critical Thinking Think about whether the results are reasonable.
  • 20.
    Section 3.2-‹#› Copyright ©2014, 2012, 2010 Pearson Education, Inc. Example Identify the reason why the mean and median would not be meaningful statistics. a. Rank (by sales) of selected statistics textbooks: 1, 4, 3, 2, 15 b. Numbers on the jerseys of the starting offense for the New Orleans Saints when they last won the Super Bowl: 12, 74, 77, 76, 73, 78, 88, 19, 9, 23, 25
  • 21.
    Section 3.2-‹#› Copyright ©2014, 2012, 2010 Pearson Education, Inc. Beyond the Basics of Measures of Center Part 2
  • 22.
    Section 3.2-‹#› Copyright ©2014, 2012, 2010 Pearson Education, Inc. Assume that all sample values in each class are equal to the class midpoint. Use class midpoint of classes for variable x. Calculating a Mean from a Frequency Distribution ( ) f x x f    
  • 23.
    Section 3.2-‹#› Copyright ©2014, 2012, 2010 Pearson Education, Inc. Example • Estimate the mean from the IQ scores in Chapter 2. ( ) 7201.0 92.3 78 f x x f      
  • 24.
    Section 3.2-‹#› Copyright ©2014, 2012, 2010 Pearson Education, Inc. Weighted Mean When data values are assigned different weights, w, we can compute a weighted mean. ( ) w x x w    
  • 25.
    Section 3.2-‹#› Copyright ©2014, 2012, 2010 Pearson Education, Inc. In her first semester of college, a student of the author took five courses. Her final grades along with the number of credits for each course were A (3 credits), A (4 credits), B (3 credits), C (3 credits), and F (1 credit). The grading system assigns quality points to letter grades as follows: A = 4; B = 3; C = 2; D = 1; F = 0. Compute her grade point average. Example – Weighted Mean Solution Use the numbers of credits as the weights: w = 3, 4, 3, 3, 1. Replace the letters grades of A, A, B, C, and F with the corresponding quality points: x = 4, 4, 3, 2, 0.
  • 26.
    Section 3.2-‹#› Copyright ©2014, 2012, 2010 Pearson Education, Inc. Solution Example – Weighted Mean             3 4 4 4 3 3 3 2 1 0 3 4 3 3 1                   w x x w . 43 3 07 14  