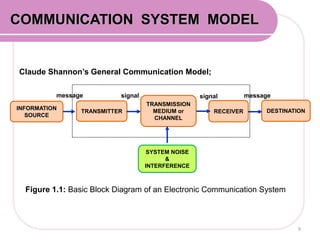
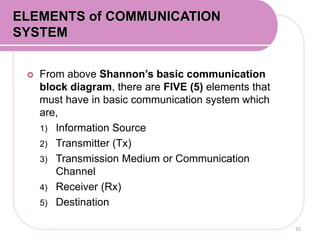
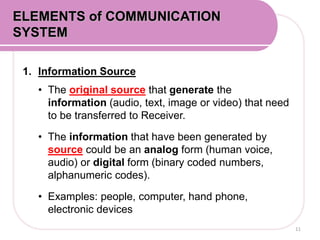
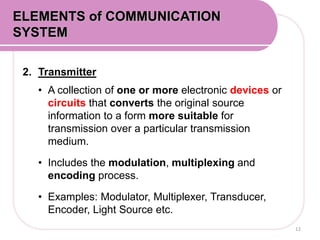
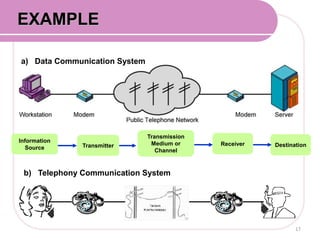
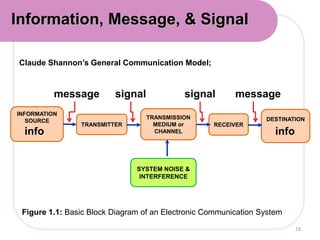
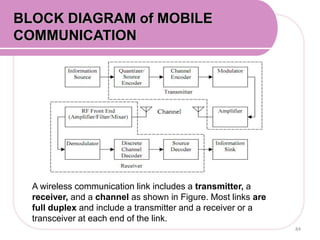
This document outlines the learning outcomes and content for a course on communication system fundamentals. The key topics covered include the basic elements of a communication system, noise and interference, signal-to-noise ratios, and modulation techniques. Specifically, it defines the five basic elements of any communication system as the information source, transmitter, transmission medium, receiver, and destination. It also explains the different types of noise including internal and external noise, and how signal-to-noise ratios are calculated.

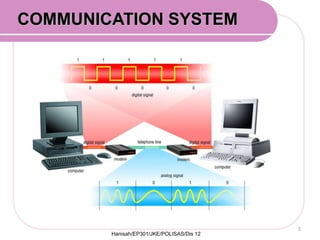
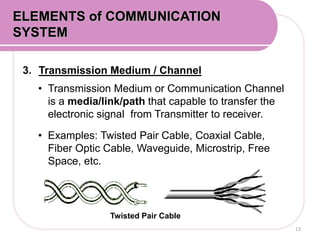
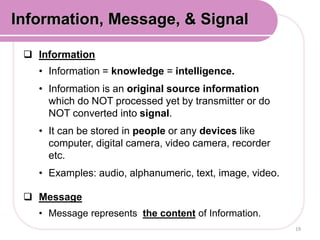
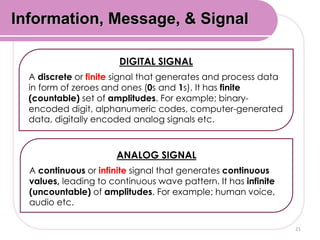
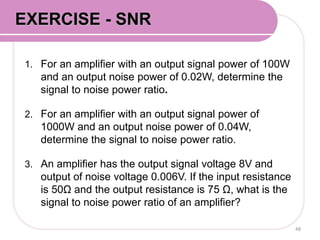
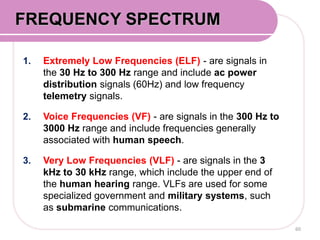
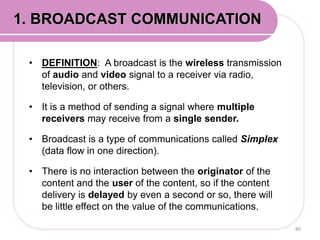
![For an amplifier with an output signal power of 10W and
an output noise power of 0.01W, determine the signal to
noise power ratio. [answ: 30dB]
Solution:
46
EXAMPLE 1:](https://image.slidesharecdn.com/chapter1dep3273-150521043905-lva1-app6892/85/Chapter-1-dep3273-46-320.jpg)
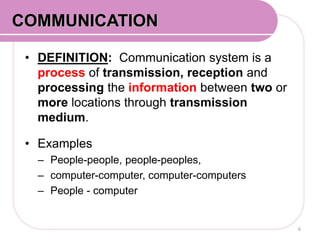
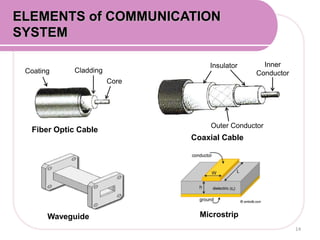
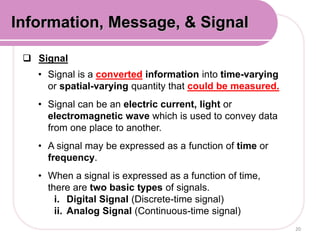
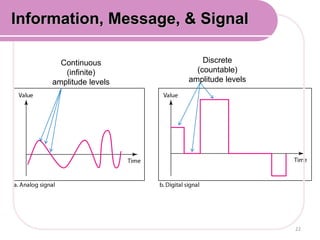
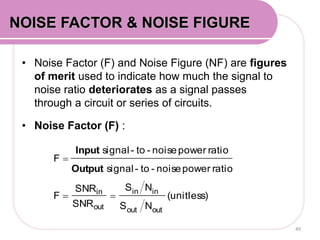
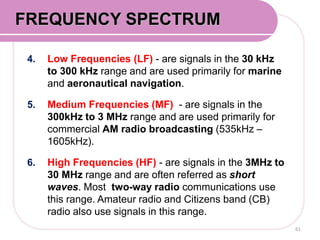
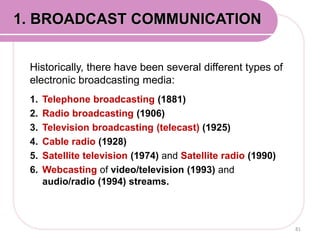
![For an amplifier with an output signal voltage of 4V, and
output noise voltage of 0.005V and an input and output
resistance of 50Ω, determine the signal-to-noise power
ratio. [answ: 58.06 dB]
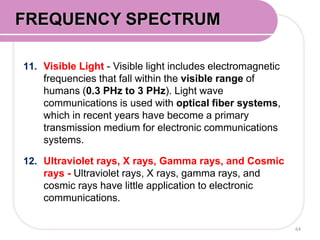
Solution:
47
EXAMPLE 2:](https://image.slidesharecdn.com/chapter1dep3273-150521043905-lva1-app6892/85/Chapter-1-dep3273-47-320.jpg)
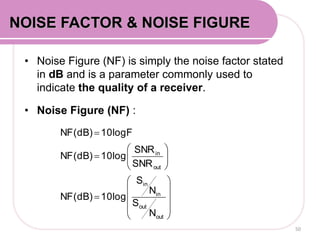
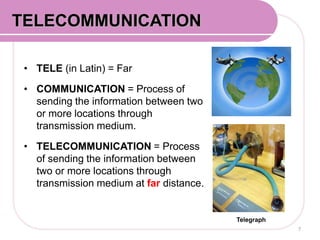
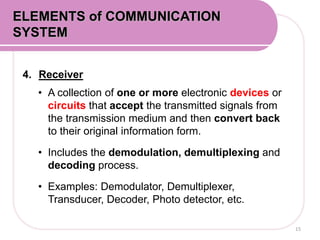
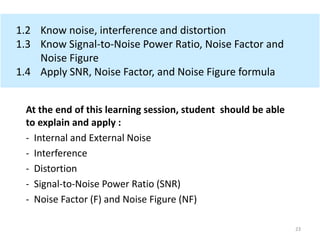
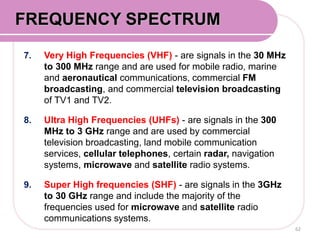
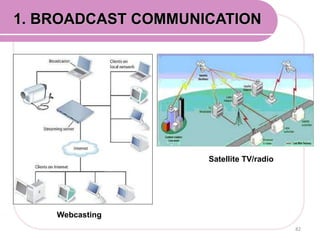
![Given the input signal to noise power ration of a non-
linear amplifier is 100,000 and its output signal to noise
power ratio is 25,000. Determine its Noise Figure.
[answ: 6.02 dB]
Solution:
54
EXAMPLE 2:](https://image.slidesharecdn.com/chapter1dep3273-150521043905-lva1-app6892/85/Chapter-1-dep3273-54-320.jpg)


![[Deck] What's New in Spark-Iceberg Integration via DSV2.pptx](https://cdn.slidesharecdn.com/ss_thumbnails/deckwhatsnewinspark-icebergintegrationviadsv2-260210005337-25955b12-thumbnail.jpg?width=640&height=640&fit=bounds)


