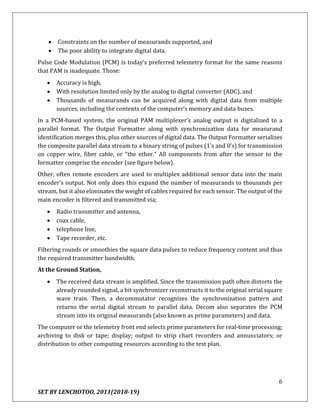
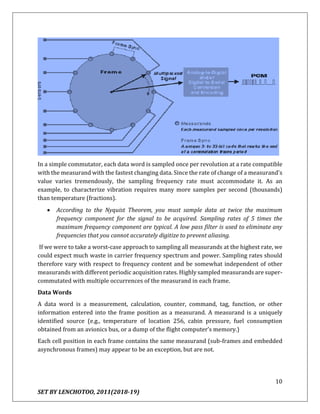
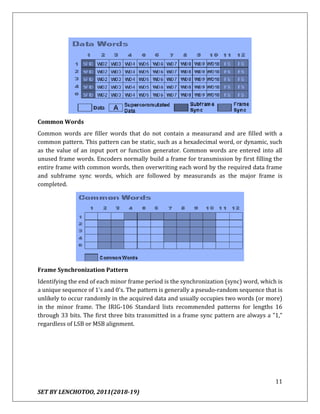
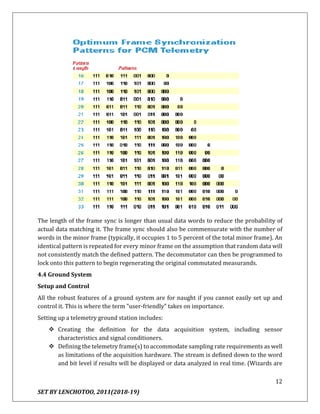
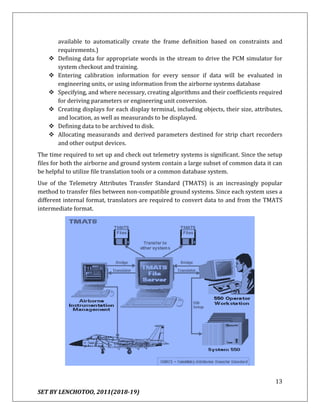
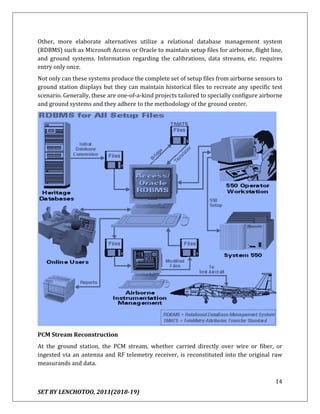
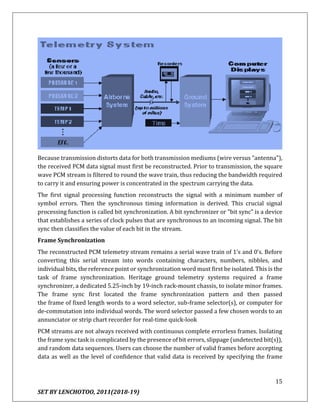
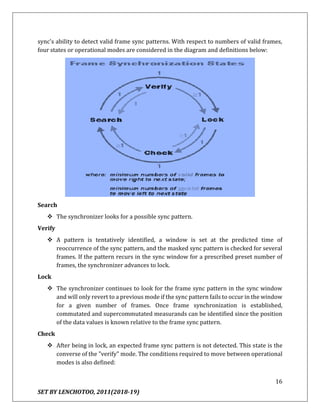
Telemetry is the process of measuring physical variables remotely and transmitting the data to another location for analysis and recording. The document discusses different types of telemetry including wire and wireless systems. It provides details on the components of a basic telemetry system such as transducers, conditioning circuits, modulators/encoders, transmitters, receivers, and demodulators. Wireless telemetry is commonly used for applications where the measurement area is not accessible, as it allows transmission over longer distances and at higher speeds compared to wire systems. Real-time telemetry is important for applications like aircraft testing where data is monitored during maneuvers from a safe ground station.
This document provides an overview of satellite communication link design. It discusses basic transmission theory including the link equation and factors that affect received power such as EIRP, path loss, and antenna gains. It also covers system noise temperature and the G/T ratio. The document outlines considerations for designing downlinks and uplinks. It describes how to calculate overall C/N ratio when multiple C/N ratios are present in the link. Finally, it lists the typical steps involved in designing a satellite communication link for a specified C/N requirement.
Mobile radio propagation models are derived using empirical and analytical methods to account for all known and unknown propagation factors. Signal strength must be strong enough for quality but not too strong to cause interference. Fading can disrupt signals and cause errors. Path loss models predict received signal level as a function of distance and are used to estimate signal-to-noise ratio. Path loss includes propagation, absorption, diffraction, and other losses. Large-scale models describe mean path loss over hundreds of meters while small-scale models characterize rapid fluctuations over small distances.
Satellite Communication Notes Unit (1 to 3).pdfGopalakrishnaU
This document provides lecture notes on satellite communications. It begins with a brief history of satellite systems and the realization of the concept from an idea to launching the first artificial satellite Sputnik-1 by the Soviet Union in 1957. It describes the basic concepts of satellite communications including the space segment consisting of the satellite and ground control station. It also describes the ground segment consisting of fixed, transportable and mobile earth terminals. It discusses the evolution from early passive satellites that simply reflected signals to later active satellites that could amplify and transmit signals.
Physical channels carry information over the air interface between the mobile station and base transceiver station. Logical channels map user data and signaling information onto physical channels. There are two main types of logical channels - traffic channels which carry call data, and control channels which communicate service information. Control channels include broadcast channels which transmit cell-wide information, common channels used for paging and access procedures, and dedicated channels for signaling during calls or when not on a call. Logical channels are mapped onto physical channels to effectively transmit information wirelessly between network components in a GSM system.
This document discusses various wireless propagation channels including free space propagation, reflection, scattering, and diffraction. It covers reflection propagation mechanisms such as reflection from dielectrics and conductors. Reflection coefficients and Snell's law are explained. Models for reflection, including the two-ray ground reflection model, are provided. Diffraction models like knife-edge diffraction and multiple knife-edge diffraction using methods like Bollington's method are summarized. Scattering models including Kirchoff's theory and perturbation theory are covered. Common fading models for mobile radio like Rayleigh, Rician, and Doppler shift models are described. Finally, different types of wireless channels including time-selective, frequency-selective, general, and WSSUS channels are classified
Telemetry is the process of measuring a physical quantity at a remote location and transmitting the data to a central station. This document discusses different types of telemetry systems based on transmission medium (wire, radio, optical fiber), modulation method (DC, AC, pulse), input signal (analog, digital), and number of channels (single, multi). It also describes specific systems including pneumatic, electrical, hydraulic, and pulse telemetry. Common frequency ranges used for telemetry applications are identified.
Telemetry involves measuring values at a remote location and transmitting the data to another location. It involves three steps - measuring a value, converting it to a signal, transmitting the signal, and reconverting it back to the original data. Factors like accuracy, whether the data is analog or digital, error detection/correction, and bandwidth influence telemetry system design. There are two main types - landline systems which use wires/cables over short distances, and radio frequency systems which use radio links from 1km to beyond 50km. Landline systems transmit current or voltage and have simple circuitry but limited range. Radio frequency systems transmit via radio links and are used for long range applications like spacecraft. Modulation schemes include amplitude modulation for
1. Kepler's laws of planetary motion describe the motion of planets and satellites in orbit. The orbital period is determined by the semimajor axis of the elliptical orbit.
2. A geostationary orbit is circular, at an altitude that matches the orbital period to Earth's sidereal day, and in the equatorial plane. A geosynchronous orbit has the correct period but may have eccentricity or inclination.
3. Orbital elements like eccentricity, semimajor axis, inclination and nodes define the characteristics of Earth-orbiting satellites. Perturbations from factors like the Sun and Moon cause the orbital elements and position to change over time.
The document summarizes the key functions of the telemetry, tracking and command (TT&C) subsystem of a satellite. It discusses how TT&C provides vital communication between the satellite and ground stations by (1) monitoring the satellite's status and measurements through telemetry, (2) sending commands from the ground to control satellite functions, and (3) tracking the satellite's location through antenna positioning and Doppler effect measurements. The TT&C subsystem receives commands from and provides data to the satellite's command and data handling system and performs autonomous operations like antenna pointing and fault recovery.
This document discusses microwave communication and factors involved in microwave link design. It describes microwave communication as utilizing radio frequencies between 2-60 GHz for communication. Key factors in microwave link design include line-of-sight considerations, loss and attenuation calculations, fading predictions, and ensuring sufficient fade margin. Proper microwave link design is an iterative process that considers propagation losses, interference analysis, and ensuring quality and availability requirements are met.
The document discusses the telemetry, tracking, command and monitoring (TTC&M) system for satellites. The TTC&M system provides essential communication between the spacecraft and ground stations. It includes subsystems for telemetry, tracking, command, and monitoring. Telemetry transmits sensor data from the satellite. Tracking determines the satellite's position and orbit. Command controls satellite functions. Monitoring collects and analyzes sensor data to check satellite health. The TTC&M system enables ground stations to observe and control the satellite.
This document discusses mobile radio propagation and propagation models. It begins by introducing how radio channels are random and time-varying. It then covers the free space propagation model and how received power decreases with distance. Reflection, diffraction, and scattering are described as the main propagation mechanisms. The two-ray ground reflection model is presented to model propagation over large distances. Diffraction is explained using the knife-edge diffraction model. Fresnel zones and diffraction gain are also defined.
This document discusses telemetry, which is the automated collection and transmission of sensor data from remote or inaccessible sources to accessible data collection points. It describes several methods of data transmission including hydraulic, pneumatic, and electrical/electronic. It then discusses the basic components of a telemetry system including sensors, transmitters, receivers, and end devices. It provides examples of landline and radio frequency telemetry systems and describes modulation techniques used to transmit the sensor data wirelessly. Finally, it lists several applications of telemetry systems in fields like meteorology, oil and gas, space science, and more.
This document discusses several multiple access techniques used in satellite communications, including Frequency Division Multiple Access (FDMA), Time Division Multiple Access (TDMA), Demand Access Multiple Access (DAMA), and Code Division Multiple Access (CDMA). FDMA divides the available frequency band into non-overlapping channels. TDMA allows multiple earth stations to share a transponder by taking turns transmitting bursts of signals. DAMA allocates satellite channels to users on demand. CDMA encodes signals so that a receiving station can recover information from an individual transmitter using the correct code.
This document discusses various diversity techniques used in wireless communications to combat fading. It describes types of diversity including time, frequency, multiuser, and space diversity. It also outlines combining techniques such as selection combining, maximal ratio combining and equal gain combining that are used to improve the signal by combining signals from multiple diversity branches. The document concludes by discussing multiple input multiple output (MIMO) systems and orthogonal frequency division multiple access (OFDMA) schemes that exploit diversity and multiuser diversity.
Loss of strength, A periodic reduction in the received strength of a radio transmission.
This is about the phenomenon of loss of signal in telecommunications.Fading refers to the
time variation of the received signal power caused by changes in the transmission medium or path.
Satellite communication uses satellites as relay stations to transmit radio and television signals between Earth stations. There are over 750 communication satellites currently in orbit. They provide wide area coverage, transmission regardless of distance, and a transmission delay of about 0.3 seconds. Common types are fixed satellites for point-to-point communication, broadcast satellites for television/radio, and mobile satellites for satellite phones. Satellites can be in low, medium or geostationary orbits depending on their purpose and coverage needs. Frequency bands like C-band, Ku-band and Ka-band are used depending on the satellite type and application.
This document discusses satellite link design and carrier-to-noise ratio calculations. It outlines the objectives of meeting a minimum C/N ratio for a time period and carrying maximum traffic at minimum cost. The link design procedure is described in 8 steps, including determining frequency band, communication parameters, S/N ratio, earth station parameters, uplink and downlink C/N ratios using link budgets. Formulas are provided for calculating carrier-to-noise ratio and the effects of uplink, downlink, transponder gain, and interference are analyzed.
Satellite Link Design:
EIRP, Transmission Losses, Free-space transmission, System noise temperature and G/T ratio, Noise figure, Design of downlinks, Design of uplink, Design of specified C/N: combining C/N and C/I values in satellite links, Overall C/No, Link design procedure.
An antenna converts electric energy to radio waves and vice versa. It consists of a transmitter and receiver. There are different types of antennas including Yagi-Uda antennas, helix antennas, parabolic antennas, loop antennas, and horn antennas. Each antenna type has distinct characteristics like directionality, frequency range, and applications. For example, Yagi-Uda antennas have high gain and directivity for frequencies from 300MHz to 3GHz, while helix antennas are omni-directional for VHF and UHF bands.
This document presents the link budget calculations for communications with the VORSat satellite. It discusses various transmission losses that could impact the satellite link, including free space losses due to signal propagation, atmospheric losses from effects in the ionosphere and troposphere, and other impairments like pointing errors. It provides equations to calculate the equivalent isotropically radiated power, free space loss, effective antenna aperture, and received power. Tables list the major types of losses and polarization losses for different antenna polarizations. The document then calculates values for the link budget including equivalent isotropically radiated power, propagation loss, and received power-to-noise density ratio to characterize the VORSat satellite communications link.
Frequency Division Multiple Access (FDMA) is a channel access method where the available bandwidth is divided into multiple non-overlapping frequency bands and each user is assigned a specific frequency band. Each user can transmit or receive independently in its assigned frequency band without interference from other users. FDMA requires expensive bandpass filters for each frequency band and has strict linearity requirements for the transmission medium. The number of channels in an FDMA system is calculated by dividing the total available bandwidth minus the guard bands by the bandwidth of each individual channel.
This document discusses various types of orbital perturbations. It describes perturbation as a deviation from the normal or regular state of a moving object's path due to outside influences. The types of orbital perturbations discussed include those caused by third bodies, non-gravitational forces, and non-spherical masses. Specific forces mentioned that cause perturbations are atmospheric drag, solar radiation, outgassing, heating, and tidal friction. These perturbations can change elements of an orbit like the orientation, size, shape, and orbital plane. The effects of atmospheric drag, tidal friction, mutual gravitational attraction, and radiation pressure on satellites are summarized.
The document discusses satellite communications, including the basic components and orbits of communication satellites, how they are used to transmit signals, and some of their applications such as television, radio, and mobile phones. Key orbits discussed include LEO, MEO, and GEO orbits, and the advantages and disadvantages of each for communication purposes. The document also covers frequency allocation and some of the challenges of using satellites for communication.
Ultra-wideband (UWB) antennas must transmit very short pulse signals accurately and efficiently. The document discusses various types of UWB antennas including traveling-wave antennas like horn antennas, frequency-independent antennas whose radiation patterns do not change with frequency, self-complementary antennas with constant input impedance regardless of frequency or shape, multiple resonance antennas made of multiple narrowband elements, and electrically small antennas. Key antenna characterization parameters in time and frequency domains are also presented.
This document discusses telemetry, which is the remote measurement and transmission of data from its source. It involves converting measured values to signals, transmitting those signals over a channel, and reconverting the signals at the receiving end. There are two main types of telemetry systems: landline systems which can transmit over short distances like wires, and radio frequency systems which can transmit over longer distances using radio links. The document provides examples and diagrams of voltage and current landline telemetry systems, as well as discussing modulation techniques like amplitude, frequency, and pulse modulation used in radio frequency systems.
This document discusses different types of small scale fading in wireless communication based on time delay spread and Doppler spread. There are four main types of fading: flat fading, frequency selective fading, fast fading, and slow fading. Flat fading occurs when the bandwidth of the signal is less than the bandwidth of the channel and the delay spread is less than the symbol period. Frequency selective fading occurs when the bandwidth of the signal is greater than the bandwidth of the channel and the delay spread is greater than the symbol period. Fast fading occurs when there is a high Doppler spread and the coherence time is less than the symbol period. Slow fading occurs when there is a low Doppler spread and the coherence time is greater than the symbol period.
This document discusses the design of terrestrial microwave links. It begins with an introduction to microwave links and their basic components - transmitters, towers, antennas, and receivers. Antennas must have line-of-sight between sites. The document then covers topics like frequency standards, polarization, antenna types, link budgets, and operating frequencies. It provides block diagrams of transmitter and receiver base stations. Key components like mixers, filters, amplifiers and their functions are described. Signal spreading in W-CDMA systems is also explained. Technical characteristics of microwave point-to-point links are outlined.
The aim of this paper is to determine the viability of Indoor Optical Wireless Communication System. This paper introduces Visible Light Communication along with its merits, demerits and applications. Then the main characteristics of VLC system are described, around which the project is designed. Multiple Input-Multiple Output (MIMO) technique is used in the project in order to enhance the data rate of transmission. Instead of using a system of only one LED and one APD, which transmits only one bit at a time, a system of 4 LEDs and 4 APDs is introduced, which increases the data rates by 300% from the previous case. We observe the signal, noise, SNR, BER etc. across the room dimension. Finally, in the last chapter we summarize our results on the basis of MATLAB simulations and propose some modifications to this model that can be implemented in future.
The modern-day power grid aims at providing reliable and quality power, which requires careful monitoring of the power grid against catastrophic faults.
Therefore one promising way is to provide the system a wide protection and control named as “Wide Area Measurement and Control System” /PMU is required.
Channel Estimation Techniques in MIMO-OFDM LTE SystemsCauses and Effects of C...IJERA Editor
There is an increasing demand for high data transmission rates with the evolution of the very large scale integration (VLSI) technology. The multiple input multiple output-orthogonal frequency division multiplexing (MIMO-OFDM) systems are used to fulfill these requirements because of their unique properties such as high spectral efficiency, high data rate and resistance towards multipath propagation. MIMO-OFDM systems are finding their applications in the modern wireless communication systems like IEEE 802.11n, 4G and LTE. They also offer reliable communication with the increased coverage area. The bottleneck to the MIMO-OFDM systems is the estimation of the channel state information (CSI). This can be estimated with the help of any one of the Training Based, Semiblind and Blind Channel estimation algorithms. This paper presents various channel estimation algorithms, optimization techniques and their effective utilization in MIMO-OFDM for modern wireless LTE systems.
Smart Antenna Report for third year Electronics and Communication Students .
Smart Antenna is a really nice topic to discover and present for third year students of electronics and communication engineering branch. So this Report covers it all .
An overview of adaptive antenna technologies for wireless communication marwaeng
This document provides an overview of adaptive antenna technologies for wireless communications. It discusses how smart antenna systems can enhance performance by manipulating antenna patterns in the spatial domain to reduce interference and increase capacity. The key benefits are reduced fading, increased power efficiency, and higher capacity. The document reviews smart antenna architectures, direction of arrival estimation techniques, spatial filtering methods like beamforming, and applications such as spatial division multiple access. It also discusses challenges in implementation and opportunities for future research.
Team D1Team D Modulation ApplicationsMay1, 2015.docxmattinsonjanel
Team D 1
Team D Modulation Applications
May1, 2015
Aslam Modak
NTC/362
Modulation Applications
There are several variances between analog and digital transmission technologies and it is crucial to comprehend how conversions between the two technologies occur. An analog signal is describe as being constantly variable along amplitudes and frequencies. On the other hand, digital transmissions is very different from its analog transmissions. One difference is the signal is considerable simpler. Rather than being constantly a variable wave form, it is a series of separate pulses that represent one and zeros. As for example, each computer utilizes a coding scheme that outlines what arrangement of ones and zeros create all characters in a character set, which includes upper and lower case letters, special characters, and keyboard control functions (Goleniewski, 2015). Furthermore, there are many technologies covert the two signals on both directions, meaning analog-to-digital and digital-to-analog. This is the case of a two converters DAC and ADC technologies. An ADC is the device that coverts or transforms a continuous physical quantity (voltage) to a digital number that presents the quantity’s amplitude. ADCs covers digital data into an analog signal such as a current or voltage. These converters are found on most electronic devices that plug to the electric outlet. They are microchips integrated on the circuit board of the electronic device.
There are several types of modulation applications. These applications are amplitude, frequency, phase and QAM modulation. They all serve different but important purposes. Along with these purposes there are also advantages and disadvantages.
Amplitude modulation (AM) is used in a variety of applications. Although use of the modulation is not relied upon currently as it was used in the past, you can still find it in its basic form. When an AM modulated signal is created, the amplitude of the signal is varied in line with the variations in intensity of the sound wave. AM is the most straightforward way of modulating a signal. Some of the advantages are, it is simple to implement, an AM signal is efficient in terms of its power usage, and it can be demodulated using a circuit consisting of a very few components. Disadvantages are AM signals are prone to high levels of noise because most noise is amplitude based and AM detectors are sensitive to it.
Frequency Modulation (FM) is used in a wide variety or radio communication applications from broadcasting, two way radio communications links, and mobile radio communications. It possesses many advantages over AM. For example, it is resilient to noise. FM that has been utilized by the broadcasting industry is the reduction in noise. FM Does not require linear amplifiers in the transmitter. Disadvantages are it requires more complicated demodulator. Some other modes have higher data spectral efficiency.
Phase Modulation (PM) is a form of modulati ...
Performance analysis of round trip time in narrowband rf networks for remote ...ijcsit
Networks for remote wireless communications using narrow band radios modem &Routers ((RipEX unit)
,as a means of transmission to communicate between the loins broadcast sites TV/FM.
RTT delay measurement is influenced by different parameters of Narrowband RF Networks.
We illustrate, in this paper, how RTT varies (in remote wireless practical communications application)
versus distance, modulation, baud rates, number of hops and throughput, between source and destination.
Also, we will see how the Forward Error Correction (FEC) affect, in the same time, the RTT according the
factors cited above.
Ijeee 20-23-target parameter estimation for pulsed doppler radar applicationsKumar Goud
Target Parameter Estimation for Pulsed Doppler Radar Applications
Pratibha Jha1 S.Swetha2 D.Kavitha3
M.Tech Scholar (ECE), Dept of ECE Senior Assistant Professor & Associate Professor, Dept of ECE
Aurora’s Scientific Technological &
Research Academy Aurora’s Scientific Technological &
Research Academy, JNTUH Aurora’s Scientific Technological &
Research Academy, JNTUH
Bandlaguda, Hyderabad, TS, India Bandlaguda, Hyderabad, TS, India Bandlaguda, Hyderabad, TS, India
pratibhajha1001@yahoo.co.in swetha.sirisin@gmail.com kavitadevireddy@gmail.com
Abstract- Conventional monostatic single-input single-output (SISO) radar transmits an electro-magnetic (EM) wave from the transmitter. The properties of this wave are altered while reflecting from the surfaces of the targets towards the receiver. The altered properties of the wave enable estimation of unknown target parameters like range, Doppler, and attenuation. However, such systems offer limited degrees of freedom. Multiple-input and multiple-output (MIMO) radar systems use arrays of transmitting and receiving antennas like phased array radars but while a phased array transmits highly correlated signals which form a beam, MIMO antennas transmit signals from a diverse set and independence between the signals is exploited
Keywords: radar, OTA, MIMO, FHSS, DSSS, MISO
COMPARISON OF BER AND NUMBER OF ERRORS WITH DIFFERENT MODULATION TECHNIQUES I...Sukhvinder Singh Malik
This paper provides analysis of BER and Number of Errors for MIMO-OFDM wireless communication system by using different modulation techniques. Wireless designers constantly seek to improve the spectrum efficiency/capacity, coverage of wireless networks, and link reliability. So the performances of the wireless communication systems can be enhanced by using multiple transmit and receive antennas, which is generally referred to as the MIMO technique. Here analysis will be carried out for an OFDM wireless communication system using different modulation techniques and considering the effect and the wireless channel like AWGN, fading. Performance results will be evaluated numerically and graphically using the plots of BER versus SNR and plots of number of errors versus SNR.
1 . introduction to communication systemabhijitjnec
This document provides an introduction to communication systems. It discusses the basic components and elements of a communication system including the input, transmitter, channel, receiver and output. It also covers various modulation techniques used to transmit signals over different types of channels. Finally, it discusses different types of signal propagation including ground waves, sky waves and space waves and how radio frequency spectrum is allocated internationally.
International Journal of Computational Engineering Research(IJCER) is an intentional online Journal in English monthly publishing journal. This Journal publish original research work that contributes significantly to further the scientific knowledge in engineering and Technology
A robust doa–based smart antenna processor for gsm base stationsmarwaeng
This document summarizes a robust smart antenna processor for GSM base stations that uses direction-of-arrival (DOA) estimation. It estimates DOAs in the uplink using multiple algorithms, including unitary ESPRIT and Capon's beamformer. It then tracks DOAs separately for uplink and downlink to form antenna patterns that suppress interference. By adapting weights within each GSM frame, it provides up to a 35dB improvement in signal-to-noise-and-interference ratio and outperforms conventional beamformers that place sharp nulls.
International Journal of Engineering Research and Applications (IJERA) is an open access online peer reviewed international journal that publishes research and review articles in the fields of Computer Science, Neural Networks, Electrical Engineering, Software Engineering, Information Technology, Mechanical Engineering, Chemical Engineering, Plastic Engineering, Food Technology, Textile Engineering, Nano Technology & science, Power Electronics, Electronics & Communication Engineering, Computational mathematics, Image processing, Civil Engineering, Structural Engineering, Environmental Engineering, VLSI Testing & Low Power VLSI Design etc.
This document discusses using spectrum analyzers for signal monitoring systems. Spectrum analyzers can form the foundation of many signal monitoring systems as they can measure frequency and amplitude of signals. Basic components of a signal monitoring system include a spectrum analyzer receiver, antenna, transmission lines, and optionally a preamplifier. The document focuses on using Agilent's PSA series spectrum analyzers, which are well-suited for signal monitoring due to their broad frequency coverage and measurement functions. Key factors for the antenna include gain, bandwidth, polarization, and impedance match. Signal monitoring can be used for frequency management, signal surveillance, and law enforcement applications.
Telemetry and data acquisition systems allow measurement data to be transmitted over long distances. There are two main types - analog and digital systems. Analog systems transmit continuous signals, while digital systems convert signals to discrete numeric values. Key components include sensors, signal conditioners, multiplexers, analog-to-digital converters, and recorders. Telemetry is used in applications like environmental monitoring, spacecraft, and medical devices to transmit sensor measurements from remote locations.
Prediction of wireless communication systems in the context of modeling 2-3-4IAEME Publication
This document discusses modeling and predicting the performance of wireless communication systems using multiple antennas.
It begins by introducing MIMO (multiple-input multiple-output) wireless systems and their advantages over single antenna systems. These include increased range, reduced interference, and improved capacity.
The document then analyzes MIMO system performance over flat fading channels with different fading statistics and levels of channel state information. It also discusses measurement results validating the Rayleigh fading assumption and the impact of mutual antenna coupling.
Finally, it covers stochastic channel models for MIMO systems, extending existing SISO models to the MIMO case. It models the correlation between antenna elements using general correlation models and covariance matrices.
Complete report on DATA ACQUISITION SCHEME IN WIRELESS SENSOR NETWORKRutvik Pensionwar
With the development in data acquisition system, information-collection plays an increasingly important role in the field of Wireless Technology. There has been tremendous increase in the use of sensors in each and every field. In order to get fast response from these sensors the delay should be reduced. Also the congestion in the network should be tackled to increase the efficiency. Wireless Sensor Networks (WSNs) consist of many tiny wireless sensors which operate in an environment in order to collect data. In a typical WSN, data is gathered from environment by sensor nodes and then transmitted to a base station. All these operations are executed by sensor nodes with keeping in mind the limitation of power. Reliable communication, power efficiency, network congestion issues are among major concerns. So in our project our main focus is to avoid the packet loss by increasing the network efficiency and handling the congestion in the network by proper buffer management. Finally visualization of processed data is done at the base station and the future enhancement could be to directly send the sensed data to cloud storage.
Differential equation fault location algorithm with harmonic effects in power...TELKOMNIKA JOURNAL
About 80% of faults in the power system distribution are earth faults. Studies to find effective methods to identify and locate faults in distribution networks are still relevant, in addition to the presence of harmonic signals that distort waves and create deviations in the power system that can cause many problems to the protection relay. This study focuses on a single line-to-ground (SLG) fault location algorithm in a power system distribution network based on fundamental frequency measured using the differential equation method. The developed algorithm considers the presence of harmonics components in the simulation network. In this study, several filters were tested to obtain the lowest fault location error to reduce the effect of harmonic components on the developed fault location algorithm. The network model is simulated using the alternate transients program (ATP)Draw simulation program. Several fault scenarios have been implemented during the simulation, such as fault resistance, fault distance, and fault inception angle. The final results show that the proposed algorithm can estimate the fault distance successfully with an acceptable fault location error. Based on the simulation results, the differential equation continuous wavelet technique (CWT) filter-based algorithm produced an accurate fault location result with a mean average error (MAE) of less than 5%.
This document provides information about the Instrumentation Engineering course offered at Madda Walabu University. The course is a compulsory 4th year course for students studying for a BSc in Electrical Engineering. It carries 5 ECTS credits and involves 2 hours of lectures and 3 hours of tutorials per week. The course aims to discuss algorithm analysis methods and data storage/analysis computation. Topics covered include basic instrumentation principles, sensor technology, telemetry applications, and intelligent instruments. Student assessment will be based 50% on continuous assessment through quizzes, tests and projects, and 50% on a final exam. The course policies emphasize academic integrity and require 75% class attendance.
Chap 5 introduction to intelligent instrumentsLenchoDuguma
Intelligent instruments are measurement devices that incorporate digital signal processing to enhance measurement performance. They go by various names like intelligent instrument, intelligent sensor, smart sensor, and smart transmitter. Intelligent devices process sensor outputs to correct errors and improve accuracy. They perform functions like compensating for environmental disturbances, signal damping, switchable ranges/units, linearization, self-diagnosis, and remote control. Smart sensors have local processing that enables independent operation without a central controller, providing benefits like improved accuracy, stability, and reduced maintenance needs. Smart transmitters have additional functionality like output processing and environmental compensation using secondary sensors. They provide advantages such as improved accuracy, automatic error correction, stability, reduced maintenance needs, and self-diagn
Standards define measurement units and allow for comparison of measurements. Standards organizations establish standards through consensus. International standards are defined at the international level, while primary standards are maintained at the national level in national laboratories. Secondary standards are used in industry labs to calibrate working standards, which are used daily to calibrate instruments. Standards organizations exist at the international, regional, and national levels. The largest international standards organizations are ISO, IEC, and ITU. National standards bodies represent their countries within international standards organizations. Quality assurance ensures a high quality of products and services by confirming that quality requirements are met through planning, fulfilling, and monitoring activities.
The document defines basic instrumentation and describes the key functional elements of instruments, including primary sensors, variable conversion elements, and signal processing elements. It discusses different types of instruments such as active vs passive, null-type vs deflection-type, analogue vs digital, indicating vs signal output instruments, and smart vs non-smart instruments. The document also covers static instrument characteristics like accuracy, precision, repeatability, and reproducibility. Choosing the appropriate instrument depends on factors like required measurement accuracy and environmental conditions.
Chapter 3 mathematical modeling of dynamic systemLenchoDuguma
The document discusses mathematical modeling of dynamic systems, including obtaining differential equations to represent system dynamics, different representations like transfer functions and impulse response functions, using block diagrams to visualize system components and signal flows, modeling various physical systems like mechanical, electrical, and thermal systems, and representing systems using signal flow graphs. It provides examples of obtaining transfer functions for different system types and using block diagram reduction techniques to find overall transfer functions.
The document provides an overview of the Laplace transform:
1. It introduces the Laplace transform and describes how it is used to transform functions from the time domain to the complex s-domain. This allows solving circuit problems involving initial conditions using algebraic equations rather than differential equations.
2. Key properties and theorems of the Laplace transform are described, including its use in solving linear time-invariant differential equations by taking the Laplace transform of both sides of the equation.
3. The inverse Laplace transform is explained as a way to transform signals back from the s-domain to the time domain. Common Laplace transform pairs and the Laplace transforms of basic circuit elements are also summarized.
Chapter 1 introduction to control systemLenchoDuguma
This chapter introduces control systems and covers the following topics:
1. It defines open-loop and closed-loop control systems, with open-loop systems having no feedback and closed-loop systems using feedback to reduce errors between the output and desired input.
2. It discusses the history of control systems from the 18th century to present day, including developments in areas like stability analysis, frequency response methods, and state-space methods.
3. It compares classical and modern control theory, noting that modern control theory can handle more complex multi-input, multi-output systems through time-domain analysis of differential equations.
This document provides information about the course "Introduction to Control Engineering" offered at Madda Walabu University. The course is worth 5 ECTS credits and consists of 2 hours of lectures and 3 hours of tutorials per week. The course aims to help students develop skills in modeling, analyzing, and designing linear dynamic control systems using tools like the Laplace transform, block diagrams, root locus analysis, and frequency response methods. The course outline covers topics such as closed-loop control systems, mathematical modeling, time and frequency domain analysis, stability criteria, and controller design techniques including lead-lag compensation. Student performance will be evaluated through assignments, quizzes, tests, and a final exam.
Literature Review Basics and Understanding Reference Management.pptxDr Ramhari Poudyal
Three-day training on academic research focuses on analytical tools at United Technical College, supported by the University Grant Commission, Nepal. 24-26 May 2024
Low power architecture of logic gates using adiabatic techniquesnooriasukmaningtyas
The growing significance of portable systems to limit power consumption in ultra-large-scale-integration chips of very high density, has recently led to rapid and inventive progresses in low-power design. The most effective technique is adiabatic logic circuit design in energy-efficient hardware. This paper presents two adiabatic approaches for the design of low power circuits, modified positive feedback adiabatic logic (modified PFAL) and the other is direct current diode based positive feedback adiabatic logic (DC-DB PFAL). Logic gates are the preliminary components in any digital circuit design. By improving the performance of basic gates, one can improvise the whole system performance. In this paper proposed circuit design of the low power architecture of OR/NOR, AND/NAND, and XOR/XNOR gates are presented using the said approaches and their results are analyzed for powerdissipation, delay, power-delay-product and rise time and compared with the other adiabatic techniques along with the conventional complementary metal oxide semiconductor (CMOS) designs reported in the literature. It has been found that the designs with DC-DB PFAL technique outperform with the percentage improvement of 65% for NOR gate and 7% for NAND gate and 34% for XNOR gate over the modified PFAL techniques at 10 MHz respectively.
6th International Conference on Machine Learning & Applications (CMLA 2024)ClaraZara1
6th International Conference on Machine Learning & Applications (CMLA 2024) will provide an excellent international forum for sharing knowledge and results in theory, methodology and applications of on Machine Learning & Applications.
A review on techniques and modelling methodologies used for checking electrom...nooriasukmaningtyas
The proper function of the integrated circuit (IC) in an inhibiting electromagnetic environment has always been a serious concern throughout the decades of revolution in the world of electronics, from disjunct devices to today’s integrated circuit technology, where billions of transistors are combined on a single chip. The automotive industry and smart vehicles in particular, are confronting design issues such as being prone to electromagnetic interference (EMI). Electronic control devices calculate incorrect outputs because of EMI and sensors give misleading values which can prove fatal in case of automotives. In this paper, the authors have non exhaustively tried to review research work concerned with the investigation of EMI in ICs and prediction of this EMI using various modelling methodologies and measurement setups.
Harnessing WebAssembly for Real-time Stateless Streaming PipelinesChristina Lin
Traditionally, dealing with real-time data pipelines has involved significant overhead, even for straightforward tasks like data transformation or masking. However, in this talk, we’ll venture into the dynamic realm of WebAssembly (WASM) and discover how it can revolutionize the creation of stateless streaming pipelines within a Kafka (Redpanda) broker. These pipelines are adept at managing low-latency, high-data-volume scenarios.
International Conference on NLP, Artificial Intelligence, Machine Learning an...gerogepatton
International Conference on NLP, Artificial Intelligence, Machine Learning and Applications (NLAIM 2024) offers a premier global platform for exchanging insights and findings in the theory, methodology, and applications of NLP, Artificial Intelligence, Machine Learning, and their applications. The conference seeks substantial contributions across all key domains of NLP, Artificial Intelligence, Machine Learning, and their practical applications, aiming to foster both theoretical advancements and real-world implementations. With a focus on facilitating collaboration between researchers and practitioners from academia and industry, the conference serves as a nexus for sharing the latest developments in the field.
Electric vehicle and photovoltaic advanced roles in enhancing the financial p...IJECEIAES
Climate change's impact on the planet forced the United Nations and governments to promote green energies and electric transportation. The deployments of photovoltaic (PV) and electric vehicle (EV) systems gained stronger momentum due to their numerous advantages over fossil fuel types. The advantages go beyond sustainability to reach financial support and stability. The work in this paper introduces the hybrid system between PV and EV to support industrial and commercial plants. This paper covers the theoretical framework of the proposed hybrid system including the required equation to complete the cost analysis when PV and EV are present. In addition, the proposed design diagram which sets the priorities and requirements of the system is presented. The proposed approach allows setup to advance their power stability, especially during power outages. The presented information supports researchers and plant owners to complete the necessary analysis while promoting the deployment of clean energy. The result of a case study that represents a dairy milk farmer supports the theoretical works and highlights its advanced benefits to existing plants. The short return on investment of the proposed approach supports the paper's novelty approach for the sustainable electrical system. In addition, the proposed system allows for an isolated power setup without the need for a transmission line which enhances the safety of the electrical network
Embedded machine learning-based road conditions and driving behavior monitoringIJECEIAES
Car accident rates have increased in recent years, resulting in losses in human lives, properties, and other financial costs. An embedded machine learning-based system is developed to address this critical issue. The system can monitor road conditions, detect driving patterns, and identify aggressive driving behaviors. The system is based on neural networks trained on a comprehensive dataset of driving events, driving styles, and road conditions. The system effectively detects potential risks and helps mitigate the frequency and impact of accidents. The primary goal is to ensure the safety of drivers and vehicles. Collecting data involved gathering information on three key road events: normal street and normal drive, speed bumps, circular yellow speed bumps, and three aggressive driving actions: sudden start, sudden stop, and sudden entry. The gathered data is processed and analyzed using a machine learning system designed for limited power and memory devices. The developed system resulted in 91.9% accuracy, 93.6% precision, and 92% recall. The achieved inference time on an Arduino Nano 33 BLE Sense with a 32-bit CPU running at 64 MHz is 34 ms and requires 2.6 kB peak RAM and 139.9 kB program flash memory, making it suitable for resource-constrained embedded systems.
1. 1
SET BY LENCHOTOO, 2011(2018-19)
CHAPTER IV
TELEMETERY APPLICATIONS
4.1 What is Telemetry?
The term telemetry is derived from the two Greek terms: “tele” and “metron”, which mean
“remote” or “far off” and “measure”, respectively. Accordingly, telemetry is the measurement
of remote (or far-off) physical variables or quantities. A physical variable or quantity under
measurement is called measurand.
Telemetry is the science of gathering information at some remote location and transmitting
the data to a convenient location to be examined and recorded. Telemetry can be done by
different methods:
optical,
mechanical,
hydraulic,
Electric, etc.
The mechanical methods, either pneumatic or hydraulic have acceptable results for short
distances and are used in environments that have a high level of electromagnetic
interference and in those situations where, for security reasons, it is not possible to use
electrical signals, for example, in explosive environments. More recently, use of optical fiber
systems allows the measurement of broad bandwidth and high immunity to noise and
interference.
Other proposed telemetry systems are based on ultrasound, capacitive or magnetic coupling,
and infrared radiation, although these methods are not routinely used. The discussion in this
chapter will be limited to the most-used systems: telemetry based on electric signals.
The main advantage of electric over mechanical methods is that:
Electrically based telemetry does not have practical limits regarding the distance
between the measurement and the analysis areas, and can be easily adapted and
upgraded in already existing infrastructures.
Electric telemetry methods are further divided depending on the transmission channel that
they use as wire telemetry and wireless (or radio) telemetry.
Wire telemetry is technologically the simplest solution. The limitations of wire
telemetry are the low bandwidth and low transmission speed that it can support.
However, it is used when the transmission wires can use the already existing
infrastructure, as, for example, in most electric power lines that are also used as wire
telemetry carriers.
2. 2
SET BY LENCHOTOO, 2011(2018-19)
Wireless telemetry is more complex than wire telemetry, as it requires a final radio
frequency (RF) stage. Despite its complexity, it is widely used because it can transmit
information over longer distances; thus, it is used in those applications in which the
measurement area is not normally accessible. It can also transmit at higher speeds
and have enough capacity to transmit several channels of information if necessary.
Telemetry using radio waves or wireless offers several distinct advantages over other
transmission methods. Some of these advantages are:
No transmission lines to be cut or broken.
Faster response time
Lower cost compared to leased lines
Ease of use in remote areas where it’s not practical or possible to use wire or
coaxial cables
Easy relocation
Functional over a wide range of operating conditions
Figure 4.1: Block diagram for a telemetry system. Telemetry using wires can be performed in
either base-band or by sending a modulated signal, while wireless telemetry uses an RF carrier
and an antenna.
It consists of (not all the blocks will be always present)
1. transducers to convert physical variables to be measured into electric signals that
can be easily processed;
2. conditioning circuits to amplify the low-level signal from the transducer, limit its
bandwidth, and adapt impedance levels;
3. 3
SET BY LENCHOTOO, 2011(2018-19)
3. signal-processing circuit that sometimes can be integrated in the previous circuits;
4. subcarrier oscillator whose signal will be modulated by the output of the different
transducers once processed and adapted;
5. codifier circuit, which can be a digital encoder, an analog modulator, or a digital
modulator, that adapts the signal to the characteristics of the transmission channel,
which is a wire or an antenna;
6. radio transmitter, in wireless telemetry, modulated by the composite signal;
7. impedance line adapter, in case of wire transmission, to adapt the characteristic
impedance of the line to the output impedance of the circuits connected to the
adapter; and
8. a transmitting antenna, for wireless communication,
The receiver end consists of similar modules. For wireless telemetry, these modules are:
1. a receiving antenna designed for maximum efficiency in the RF band used;
2. a radio receiver with a demodulation scheme compatible with the modulation
scheme; and
3. Demodulation circuits for each of the transmitted channels.
For wireless telemetry, the antenna and the radio receiver are replaced by a generic front
end to amplify the signal and adapt the line impedance to the input impedance of the circuits
that follow.
The transmission in telemetry systems, in particular wireless ones, is done by sending a
signal whose analog variations in amplitude or frequency are a known function of the
variations of the signals from the transducers. More recently, digital telemetry systems send
data digitally as a finite set of symbols, each one representing one of the possible finite values
of the composite signals at the time that it was sampled.
The effective communication distance in a wireless system is limited by:
The power radiated by the transmitting antenna,
The sensitivity for the receiver and
The bandwidth of the RF signal.
As the bandwidth increases, the contribution of noise to the total signal also increases, and
consequently more transmitted power is needed to maintain the same signal-to-noise ratio
(SNR).
This is one of the principal limitations of wireless telemetry systems. In some applications,
the transmission to the receiver is done on base band, after the conditioning circuits. The
advantage of base-band telemetry systems is their simplicity, although because of the base-
band transmission, they are normally limited to only one channel at low speeds.
4. 4
SET BY LENCHOTOO, 2011(2018-19)
4.2 Telemetry Systems Overview
Telemetry is defined as the sensing and measuring of information at some remote location
and then transmitting that information to a central or host location. There, it can be
monitored and used to control a process at the remote site. Various mediums of transmitting
data from one site to another have been used. Data radio provides a wireless method for
transmitting the information. Telemetry using radio waves or wireless offers several distinct
advantages over other transmission.
Or
Telemetry is the process by which an object’s characteristics are measured (such as velocity
of an aircraft), and the results transmitted to a distant station where they are displayed,
recorded, and analyzed.
The transmission media may be:
Air and space for satellite applications, or
Copper wire and fiber cable for static ground environments like power generating
plants.
In today's telemetry applications, which support large numbers of measurands, it is too costly
and impractical to use separate transmission channels for each measured quantity. The
telemetry process involves grouping measurements (such as pressure, speed, and temperature)
into a format that can be transmitted as a single data stream. Once received, the data stream
is separated into the original measurement’s components for analysis.
Telemetry lets you stay in a safe (or convenient) location while monitoring what's taking
place in an unsafe (or inconvenient) location.
Aircraft development, for example, is a major application for telemetry systems. During
initial flight testing, an aircraft performs a variety of test maneuvers. The critical flight data
from a maneuver is transmitted to flight test engineers at a ground station where results are
viewed in real time or analyzed within seconds of the maneuver. Real-time monitoring
5. 5
SET BY LENCHOTOO, 2011(2018-19)
allows the "safety officer" to make instant decisions on whether to proceed with or terminate
a test. With real-time analysis, the flight test engineer can request a maneuver be repeated,
the next maneuver be performed, or test plan alternatives be substituted. Real-time data is
also captured to storage media, such as disk and tape, for later analysis and archiving.
A telemetry system is often viewed as two components,
The Airborne System and
The Ground System. In actuality, either or both may be in the air or on the ground.
Data acquisition begins when sensors (transducers) measure the amount of a physical
attribute and transform the measurement to an engineering unit value. Some sensors
produce a voltage directly (thermocouples for temperature or piezoelectric strain gages
for acceleration), while others require excitation (resistive strain gages, potentiometers
for rotation, etc.).
Sensors attached to signal conditioners provide power for the sensors to operate or
modify signals for compatibility with the next stage of acquisition. Since maintaining a
separate path for each source is cumbersome and costly, a multiplexer (known as a
commutator) is employed. It serially measures each of the analog voltages and outputs
a single stream of pulses, each with a voltage relative to the respective measured
channel. The rigorous merging of data into a single stream is called Time Division
Multiplexing or TDM.
The scheme where the pulse height of the TDM stream is proportional to the measured value
is called Pulse Amplitude Modulation (PAM). A unique set of synchronization pulses is added
to identify the original measurands and their value. PAM has many limitations:
Including accuracy,
6. 6
SET BY LENCHOTOO, 2011(2018-19)
Constraints on the number of measurands supported, and
The poor ability to integrate digital data.
Pulse Code Modulation (PCM) is today’s preferred telemetry format for the same reasons
that PAM is inadequate. Those:
Accuracy is high,
With resolution limited only by the analog to digital converter (ADC), and
Thousands of measurands can be acquired along with digital data from multiple
sources, including the contents of the computer’s memory and data buses.
In a PCM-based system, the original PAM multiplexer’s analog output is digitalized to a
parallel format. The Output Formatter along with synchronization data for measurand
identification merges this, plus other sources of digital data. The Output Formatter serializes
the composite parallel data stream to a binary string of pulses (1’s and 0’s) for transmission
on copper wire, fiber cable, or "the ether." All components from after the sensor to the
formatter comprise the encoder (see figure below}.
Other, often remote encoders are used to multiplex additional sensor data into the main
encoder’s output. Not only does this expand the number of measurands to thousands per
stream, but it also eliminates the weight of cables required for each sensor. The output of the
main encoder is filtered and transmitted via;
Radio transmitter and antenna,
coax cable,
telephone line,
Tape recorder, etc.
Filtering rounds or smoothies the square data pulses to reduce frequency content and thus
the required transmitter bandwidth.
At the Ground Station,
The received data stream is amplified. Since the transmission path often distorts the
already rounded signal, a bit synchronizer reconstructs it to the original serial square
wave train. Then, a decommutator recognizes the synchronization pattern and
returns the serial digital stream to parallel data. Decom also separates the PCM
stream into its original measurands (also known as prime parameters) and data.
The computer or the telemetry front end selects prime parameters for real-time processing;
archiving to disk or tape; display; output to strip chart recorders and annunciators; or
distribution to other computing resources according to the test plan.
7. 7
SET BY LENCHOTOO, 2011(2018-19)
4.3 Airborne Systems
Data Acquisition
A wide variety of sensors (also known as transducers) are used to measure and acquire a
physical property’s value. It is up to the instrumentation engineer to select the device to meet
the environmental, response, accuracy, size, and cost specifications for the application.
Signal conditioners serve as the interface of the data acquisition system from the
transducers. Many transducers require:
Ac or dc power (e.g., thermistors, strain gages, and linear variable differential
transformers-LVDTs)
Others generate signals (tachometers, thermocouples, and piezoelectric strain gages).
They provide excitation power), network calibration, signal amplification, and filtering.
In airborne data acquisition, sensor output characteristics must be
Transformed,
filtered, or
Modified for compatibility with the next stage of the system.
The absolute relationship between the output and the actual property value of the
measurand may vary with time, altitude, pressure, temperature, etc. Therefore, signal
conditioners also incorporate calibration features to assist in defining the relationships.
A system under test may be subjected to known physical characteristics and the output
measured to ascertain and verify the relationship between the sensor and its output.
For example, when on the ground, an airplane’s flaps may be moved at known angles,
while measurements are taken on sensor or airborne system output. The plot of angle
vs. output will be used by the ground system for real-time data display in engineering
units.
8. 8
SET BY LENCHOTOO, 2011(2018-19)
Multiplexer
Whatever the quantities monitored at the data source (whether electrical or physical), the
cost to transmit each quantity through a separate channel would be prohibitive. Think of:
The equipment and cables or
Frequency spectrum required to monitor and
Transmit several hundred or thousands of measurands!
One way to conserve resources is to share time or frequency spectrum with techniques such
as Time-Division Multiplexing (TDM) and Frequency Multiplexing (FM), respectively.
If more than one physical variables need to be telemetered simultaneously from the same
location, then one of the following multiplexing techniques is used:
Time-division multiplexing (TDM),
frequency-division multiplexing (FDM), and
Wavelength-division multiplexing (WDM).
Today, the most popular form of telemetry multiplexing (originally called commutation, as
in an electric motor’s commutator) is TDM.
Modulation
Modulation is the process whereby some characteristic of one wave is varied in accordance with
some characteristic of another wave. The basic types of modulation are: Angular modulation
(including the special cases of phase and frequency modulation) and amplitude modulation.
In missile radars, it is common practice to amplitude modulate the transmitted RF
carrier wave of tracking and guidance transmitters by using a pulsed wave for
modulating, and to frequency modulate the transmitted RF carrier wave of illuminator
transmitters by using a sine wave.
Or in other words Modulation is the technique where the value of each sample (i.e., the
modulating signal) systematically changes the characteristics of a carrier signal (e.g.,
amplitude (height) or frequency (timing)).
The resulting modulated wave "carries" the data. Conversely, removing the carrier signal
results in the return of the original measurement. The TDM stream produced by the basic
multiplexer scheme is accomplished via Pulse Code Modulation or PAM.
Three other modulation forms are also used:
Pulse Duration Modulation (PDM),
Pulse Position Modulation (PPM), and
Pulse Amplitude Modulation (PAM).
9. 9
SET BY LENCHOTOO, 2011(2018-19)
The resulting waveforms from these modulation techniques for a simple analog data signal
are shown below.
The PAM data stream signal is transmitted from
the multiplexer in a uniformly spaced sequence
of constant-width pulses. The intensity of each
pulse is modulated by amplitude. This is similar
to AM radio broadcast, except the carrier is a
pulse rather than a sine wave.
Since amplitudes are degraded by noise, the
multiplexed data stream is usually converted to
a constant amplitude pulse modulation scheme.
PDM carries the information in the pulse width,
which varies directly to the amplitude of the
signal.
PPM results if the PDM waveform is
differentiated, then rectified. The distance between the two pulses represents the sampled
amplitude of the sine wave, with the first pulse as the zero time reference.
Average system power for PPM is much lower than that required for PDM, but at the expense
of greater bandwidth.
Both PDM and PPM use constant-amplitude pulses, but are still analog representations of an
analog signal. In a PCM system, each pulse is encoded into its binary equivalent before
transmission. During PCM encoding, the serial output stream is conditioned for the
communication link.
In many cases, PCM data is not only transmitted, but also stored. When considering recording
or transmitting requirements, you must establish the patterns used to represent logical one and
zero values.
Commutation
a complete scan by the multiplexer (one revolution of the commutator) produces a frame of
the stream of words containing the value of each measurand. Every scan produces the same
sequence of words. Only the value of a measurand is captured, not its address (name). If only
the measurand’s data is captured, there is no way to distinguish the owner of one value from
the next. Thus, a unique word called the frame sync is added at the end of each frame to serve
as a reference for the process of de-commutating the stream’s data (i.e., extracting it into
individual measurand values).
10. 10
SET BY LENCHOTOO, 2011(2018-19)
In a simple commutator, each data word is sampled once per revolution at a rate compatible
with the measurand with the fastest changing data. Since the rate of change of a measurand's
value varies tremendously, the sampling frequency rate must accommodate it. As an
example, to characterize vibration requires many more samples per second (thousands)
than temperature (fractions).
According to the Nyquist Theorem, you must sample data at twice the maximum
frequency component for the signal to be acquired. Sampling rates of 5 times the
maximum frequency component are typical. A low pass filter is used to eliminate any
frequencies that you cannot accurately digitize to prevent aliasing.
If we were to take a worst-case approach to sampling all measurands at the highest rate, we
could expect much waste in carrier frequency spectrum and power. Sampling rates should
therefore vary with respect to frequency content and be somewhat independent of other
measurands with different periodic acquisition rates. Highly sampled measurands are super-
commutated with multiple occurrences of the measurand in each frame.
Data Words
A data word is a measurement, calculation, counter, command, tag, function, or other
information entered into the frame position as a measurand. A measurand is a uniquely
identified source (e.g., temperature of location 256, cabin pressure, fuel consumption
obtained from an avionics bus, or a dump of the flight computer’s memory.)
Each cell position in each frame contains the same measurand (sub-frames and embedded
asynchronous frames) may appear to be an exception, but are not.
11. 11
SET BY LENCHOTOO, 2011(2018-19)
Common Words
Common words are filler words that do not contain a measurand and are filled with a
common pattern. This pattern can be static, such as a hexadecimal word, or dynamic, such
as the value of an input port or function generator. Common words are entered into all
unused frame words. Encoders normally build a frame for transmission by first filling the
entire frame with common words, then overwriting each word by the required data frame
and subframe sync words, which are followed by measurands as the major frame is
completed.
Frame Synchronization Pattern
Identifying the end of each minor frame period is the synchronization (sync) word, which is
a unique sequence of 1's and 0's. The pattern is generally a pseudo-random sequence that is
unlikely to occur randomly in the acquired data and usually occupies two words (or more)
in the minor frame. The IRIG-106 Standard lists recommended patterns for lengths 16
through 33 bits. The first three bits transmitted in a frame sync pattern are always a "1,"
regardless of LSB or MSB alignment.
12. 12
SET BY LENCHOTOO, 2011(2018-19)
The length of the frame sync is longer than usual data words to reduce the probability of
actual data matching it. The frame sync should also be commensurate with the number of
words in the minor frame (typically, it occupies 1 to 5 percent of the total minor frame). An
identical pattern is repeated for every minor frame on the assumption that random data will
not consistently match the defined pattern. The decommutator can then be programmed to
lock onto this pattern to begin regenerating the original commutated measurands.
4.4 Ground System
Setup and Control
All the robust features of a ground system are for naught if you cannot easily set up and
control it. This is where the term "user-friendly" takes on importance.
Setting up a telemetry ground station includes:
Creating the definition for the data acquisition system, including sensor
characteristics and signal conditioners.
Defining the telemetry frame(s) to accommodate sampling rate requirements as well
as limitations of the acquisition hardware. The stream is defined down to the word
and bit level if results will be displayed or data analyzed in real time. (Wizards are
13. 13
SET BY LENCHOTOO, 2011(2018-19)
available to automatically create the frame definition based on constraints and
requirements.)
Defining data for appropriate words in the stream to drive the PCM simulator for
system checkout and training.
Entering calibration information for every sensor if data will be evaluated in
engineering units, or using information from the airborne systems database
Specifying, and where necessary, creating algorithms and their coefficients required
for deriving parameters or engineering unit conversion.
Creating displays for each display terminal, including objects, their size, attributes,
and location, as well as measurands to be displayed.
Defining data to be archived to disk.
Allocating measurands and derived parameters destined for strip chart recorders
and other output devices.
The time required to set up and check out telemetry systems is significant. Since the setup
files for both the airborne and ground system contain a large subset of common data it can
be helpful to utilize file translation tools or a common database system.
Use of the Telemetry Attributes Transfer Standard (TMATS) is an increasingly popular
method to transfer files between non-compatible ground systems. Since each system uses a
different internal format, translators are required to convert data to and from the TMATS
intermediate format.
14. 14
SET BY LENCHOTOO, 2011(2018-19)
Other, more elaborate alternatives utilize a relational database management system
(RDBMS) such as Microsoft Access or Oracle to maintain setup files for airborne, flight line,
and ground systems. Information regarding the calibrations, data streams, etc. requires
entry only once.
Not only can these systems produce the complete set of setup files from airborne sensors to
ground station displays but they can maintain historical files to recreate any specific test
scenario. Generally, these are one-of-a-kind projects tailored to specially configure airborne
and ground systems and they adhere to the methodology of the ground center.
PCM Stream Reconstruction
At the ground station, the PCM stream, whether carried directly over wire or fiber, or
ingested via an antenna and RF telemetry receiver, is reconstituted into the original raw
measurands and data.
15. 15
SET BY LENCHOTOO, 2011(2018-19)
Because transmission distorts data for both transmission mediums (wire versus "antenna"),
the received PCM data signal must first be reconstructed. Prior to transmission, the square
wave PCM stream is filtered to round the wave train, thus reducing the bandwidth required
to carry it and ensuring power is concentrated in the spectrum carrying the data.
The first signal processing function reconstructs the signal with a minimum number of
symbol errors. Then the synchronous timing information is derived. This crucial signal
processing function is called bit synchronization. A bit synchronizer or "bit sync" is a device
that establishes a series of clock pulses that are synchronous to an incoming signal. The bit
sync then classifies the value of each bit in the stream.
Frame Synchronization
The reconstructed PCM telemetry stream remains a serial wave train of 1’s and 0’s. Before
converting this serial stream into words containing characters, numbers, nibbles, and
individual bits, the reference point or synchronization word must first be isolated. This is the
task of frame synchronization. Heritage ground telemetry systems required a frame
synchronizer, a dedicated 5.25-inch by 19-inch rack-mount chassis, to isolate minor frames.
The frame sync first located the frame synchronization pattern and then passed
the frame of fixed length words to a word selector, sub-frame selector(s), or computer for
de-commutation into individual words. The word selector passed a few chosen words to an
annunciator or strip chart recorder for real-time quick-look
PCM streams are not always received with continuous complete errorless frames. Isolating
the frame sync task is complicated by the presence of bit errors, slippage (undetected bit(s)),
and random data sequences. Users can choose the number of valid frames before accepting
data as well as the level of confidence that valid data is received by specifying the frame
16. 16
SET BY LENCHOTOO, 2011(2018-19)
sync's ability to detect valid frame sync patterns. With respect to numbers of valid frames,
four states or operational modes are considered in the diagram and definitions below:
Search
The synchronizer looks for a possible sync pattern.
Verify
A pattern is tentatively identified, a window is set at the predicted time of
reoccurrence of the sync pattern, and the masked sync pattern is checked for several
frames. If the pattern recurs in the sync window for a prescribed preset number of
frames, the synchronizer advances to lock.
Lock
The synchronizer continues to look for the frame sync pattern in the sync window
and will only revert to a previous mode if the sync pattern fails to occur in the window
for a given number of frames. Once frame synchronization is established,
commutated and supercommutated measurands can be identified since the position
of the data values is known relative to the frame sync pattern.
Check
After being in lock, an expected frame sync pattern is not detected. This state is the
converse of the "verify" mode. The conditions required to move between operational
modes is also defined:
17. 17
SET BY LENCHOTOO, 2011(2018-19)
Lock to Search
Number of consecutive invalid frame synchronization patterns that must be detected
in the data stream before the decom goes into search mode. For example, if the
constraint is set to 3, decom will go into search if it detects three consecutive invalid
frame synchronization patterns in the data stream.
When it detects the first invalid frame synchronization pattern, it advances from lock
to verify mode. It remains in verify mode when it detects the second invalid frame
synchronization pattern.
If the third frame synchronization pattern is invalid, it advances to search; otherwise,
it will return to lock. If the constraint is set to 1, decom will bypass the verify mode
and go right into lock upon the identification of one frame sync pattern.
Search to Lock
Number of consecutive valid frame synchronization patterns that must be detected
in the data stream before the decom advances from search to lock. For example, if you
enter 3, decom will not advance from search to lock until it detects three consecutive
valid frame synchronization patterns in the data stream. When it detects the first
valid frame synchronization pattern, it advances from search to check mode. It
remains in check mode when it detects the second valid frame synchronization
pattern.
If the third frame synchronization pattern is valid, it advances from check to lock.
Otherwise, it will return to search. A 100% match of the actual to programmed
pattern may not always be attainable. Thus, decoms have several programmable
options to allow advancement to the next state.
Sync Pattern Bit Errors
Calculates the number of correct bits in the synchronization pattern for a valid
pattern. For example, if the synchronization pattern is 32 bits long and the Sync
Pattern Bit Errors is set to 4, then decom will look for 28 good bits in a pattern.
Bit Aperture
Allows or disallows bit slips in the frame synchronization pattern. Four example, 1
allows the frame synchronization pattern to be "early" or "late" by one bit time and
still be valid for a lock state. Similar techniques can be used to detect subframe sync
words. While sync words test the overall integrity of one location, a Cyclic
Redundancy Check (CRC) word may be included in the frame to check the integrity of
an entire frame (although this is not included in the IRIG-106 specification).
18. 18
SET BY LENCHOTOO, 2011(2018-19)
De-commutation
After frame synchronization, individual measurands are identified according to the frame
location. Hardware architectures differ in how they equate and maintain the data/definition
relationship.
For example, a unique tag may be appended to each raw measurand or data word in what
may be called a data flow architecture. This tag remains with the data word unless it is
changed; i.e., EU converted, processed, or its bits manipulated. Another scheme rearranges
measurands into a new format that is more appropriate for data manipulation, such as
sorting the frame into arrays where each array is one or more instances of a single
measurand. Another scheme maintains a current value table (CVT), including all or only
those measurands of interest.
The decommutator also identifies and extracts embedded asynchronous data stream (EADS)
words. Words for each EADS are re-serialized and sent to separate hardware decommutators
along with clocks, or if data rates permit, to a general-purpose embedded processor or
workstation as contiguous bytes for software decommutation algorithms. All words in the
same EADS stream have an identical tag or name.
Thus, a major frame may have multiple EADS streams, each destined for an independent
decommutator. Analogous to sub-subframes, an EADS stream may itself have EADS
stream(s).
Other features often found in hardware decommutators include the ability to support;
Words of different lengths,
multiple CRC and parity checking types, and
Selectable data alignment (MSB/LSB) on a per word basis.
Applications such as monitoring multiple stage rockets or testing multiple systems on one
aircraft require changing the set of measurands being monitored. That means the contents
of the entire frame will change significantly, if not completely. You could use a single large
frame covering all measurands. However, the spectrum required to transmit this larger
number of words is too large. Instead, formats are changed as each stage is jettisoned or test
points fluctuate. The change occurs on the value of a specific measurand.
A multi-format decom will switch to a new format either on the next word or next frame
without loss of data. To achieve such a rapid response, the decommutator contains all the
possible frame definitions in memory.
The IRIG-106 Standard specifies a maximum of 16 formats. Only a few formats are typically
used in aircraft flight test and rocket launches. Still, over a hundred formats may be used by
a few satellites to accommodate relatively low data rates and multiple modes of operation.
Fortunately, data rates are slow and could be accommodated by software decommutation.
19. 19
SET BY LENCHOTOO, 2011(2018-19)
The advent of faster general-purpose front-end processors and computers offers a way to
provide real-time software decommutation, but at slower data rates than a dedicated
hardware decom. Software decommutation offers the advantage of handling the most
complex formats and memory required to support instant switching between hundreds of
frame formats.
Today’s ground station management software includes a graphical user interface (GUI)
to define telemetry stream decommutation content as in the database. Instant feedback
occurs when data entry errors are detected (e.g., audible and visual feedback if the
words entered for a minor frame contain more bits than what is defined for the frame).
To aid in data entry, tools automatically create dummy measurand names, or for a
supercommutated frame, create multiple instances of measurands automatically based
on frequency, etc.
Flight test programs often deploy multiple airborne and ground systems. Each system
has unique data structures to define commutation and decommutation frame layout
plus the governing attributes of the data acquisition devices or the ground displays.
Each system may use independent databases. And each requires that redundant data be
entered in a unique format.
Personnel at large ground stations generally develop their own capability to convert
one database format to another. The alternative is manual reentry and testing of each
database. Limiting a test program to a single hardware suite is not always possible,
which can be quite cumbersome as programs may last many years, precluding use of
newer technology. Similar hurdles exist if unique test resources are only available at
distant test facilities, each with different equipment (e.g., major differences in operating
climates, threat simulators, munition test areas, etc).
To eliminate the tedious task of database re-entry, ground station manufacturers have
developed their own set of translators to support their equipment. A few have built this
capability around a general-purpose relational database (RDBMS) such as Oracle or
Microsoft Access. Recently, IRIG-106 included the definition of the Telemetry Attributes
Transfer Standard (TMATS), an intermediate common format that each ground and airborne
system can use for data transfer. Today, a superset of the TMATS specification is required to
encompass all the attributes of the airborne and ground systems.
Simulation and Encoding
A data acquisition system or analog instrumentation recorder may not always be available
at the telemetry station to produce PCM data streams for system checkout and operator
training. Therefore, it is highly desirable to simulate identical PCM data streams produced
by the acquisition subsystem.
Simulators vary in performance; some produce a simple static frame at fixed rates, while
others create the most complex frames and data rates to match the decommutator’s
20. 20
SET BY LENCHOTOO, 2011(2018-19)
capabilities. Describing the frame format for setup may not be required since the telemetry
system can produce it from the decommutator’s setup definition. The simulator produces
major and minor frames, including super-commutated, sub-, and sub-sub frames; and
multiple embedded asynchronous data streams.
The PCM output signal is available in any of the standard IRIG codes and levels. Simulators
and encoders also provide MSB or LSB word orientation, programmable synchronization
words, and support for format switching. Measurands can be simulated statically either as
user defined constants and wave shapes via a CVT or as multiple function generators
(square, sine, ramp, triangular) at different data rates and amplitudes. While the data
changes, it is not considered dynamic.
Dynamic simulation uses real-time data from external sources and measurand simulators as
products of data bus, vehicle, or satellite constellation models. These dynamically simulated
streams are desirable for training and system test. A dynamic simulator is, in effect, a PCM
encoder.
You can produce a new PCM stream by extracting words from incoming PCM stream(s) or
external data sources for applications such as commanding or forwarding data to another
site. An example of the former is to control the operation of a satellite, while the latter is for
an airborne-based ground station to forward key measurands to the ground station during
flight tests (see figure below).
The airborne ground station not only selects all instances of individual parameters, but may
compress them (e.g., averages values or combines multiple measurands, as in processed
parameters).
21. 21
SET BY LENCHOTOO, 2011(2018-19)
Real-Time Processing
The result of decommutation is the reconstruction of sensor measurements, packed bus data,
or computer words. To be more meaningful and easily comprehended, measurements are
viewed in user-friendly formats like engineering units (miles per hour, degrees centigrade,
or psi), not as raw counts from a transducer.
Real-time processing requires that data be converted/manipulated in real time to satisfy the
immediate need to evaluate data and make decisions regarding safety, test continuation,
controlling a satellite’s movement, etc. To L-3 Telemetry-West, real-time processing means
producing all the results from an algorithm before the next set of measurands arrive. The
alternative is non-determinism and loss of data until processing resources are available.
While buffering data for a very short period may be acceptable, loss of data is not. Adding
more or faster resources may not produce desired results. In cases like this, you need a high-
performance deterministic system that supports linear processing growth, where doubling
the number of processors doubles processing resources.
In addition to EU conversion, real-time processors serve other functions, including the
following:
Alarm Checking-Real-time processors continuously check values against norms to
ensure out-o f limits and caution boundaries are not exceeded or to predict problems
due to trending over time.
Bit Manipulation-Telemetry frames are not always orderly with one measurand per
word. When resources are at a premium, instrumentation engineers will combine
unused bits from several word locations to form an additional measurand. It is up to
the real-time processor to assemble the new measurand and inject the result into the
stream for further processing.
Derived Parameters - A single meaningful attribute (e.g., air speed as a much
number) may be the result or derivation of multiple measurands (temperature,
altitude, velocity) inhabiting multiple data streams.
Data Compression - Often, data is sampled too frequently, producing too much data.
This data is "compressed" using sampling or averaging algorithms.