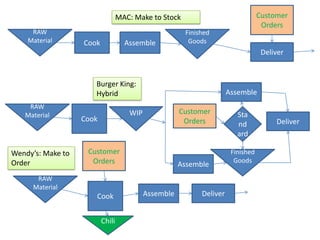
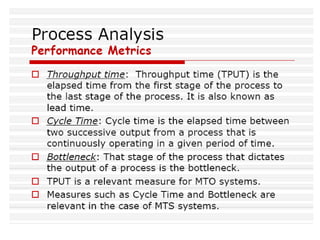
1. Lead time - The time from when a customer places an order to when it is delivered. Reducing lead time is important in make-to-order.
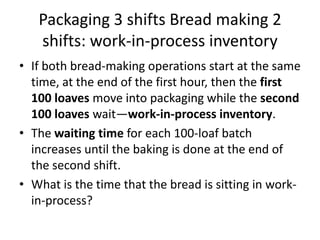
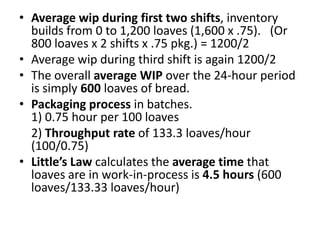
2. Work in progress (WIP) - The amount of unfinished orders at each stage of production. Lower WIP allows for more flexibility.
3. On-time delivery - The percentage of orders delivered by the promised date. Higher on-time rates increase customer satisfaction.
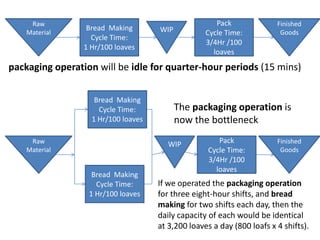
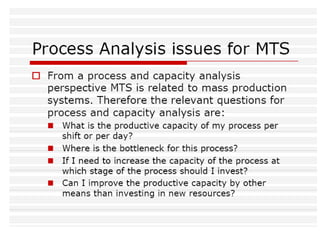
4. Process bottlenecks - Any steps that slow the overall flow of orders through production. Eliminating bottlenecks can speed up lead times.
5.
Lecture notes for An Introduction to Operations Management (taught by Prof. Christian Terwiesch / University of Pennsylvania / online course at www.coursera.org).
Scheduling
Routing
Prioritizing
Dispatching
What is Scheduling ?
Forward Scheduling
Backward Scheduling
Finite LOADING
infinite loading
Schedule Gantt Chart
Line balancing
GOAL AND OBJECTIVE
LINE BALANCING PROCEDURE
Strategies and Costs
as early as possible
as last as possible
Aggregate planning is an operational activity that does an aggregate plan for the production process, in advance of 6 to 18 months, to give an idea to management as to what quantity of materials and other resources are to be procured and when, so that the total cost of operations of the organization is kept to the minimum over that period.
Overview on the Toyota production system principles, techniques and theories.
The presentation include:
-Lean Manufacturing Principles
-Productivity Measurement, Analysis and Improvement
-Effect & Elimination of the Manufacturing 7-Wastes
-Lean Improvement Techniques
-Lean Management for Making Improvement & Gaining Sustainability
This presentation explains about the Operations Management concept Reorder point, different cases with examples, fixed order interval model, single period model etc.
Product layout in Food Industry and Line BalancingAbhishek Thakur
The product or line layout is the basic type of layout commonly used by the food industry. Line balancing is done to analyze the net output of our production line and processing time at various steps.
Communications Mining Series - Zero to Hero - Session 1DianaGray10
This session provides introduction to UiPath Communication Mining, importance and platform overview. You will acquire a good understand of the phases in Communication Mining as we go over the platform with you. Topics covered:
• Communication Mining Overview
• Why is it important?
• How can it help today’s business and the benefits
• Phases in Communication Mining
• Demo on Platform overview
• Q/A
Pushing the limits of ePRTC: 100ns holdover for 100 daysAdtran
At WSTS 2024, Alon Stern explored the topic of parametric holdover and explained how recent research findings can be implemented in real-world PNT networks to achieve 100 nanoseconds of accuracy for up to 100 days.
A tale of scale & speed: How the US Navy is enabling software delivery from l...sonjaschweigert1
Rapid and secure feature delivery is a goal across every application team and every branch of the DoD. The Navy’s DevSecOps platform, Party Barge, has achieved:
- Reduction in onboarding time from 5 weeks to 1 day
- Improved developer experience and productivity through actionable findings and reduction of false positives
- Maintenance of superior security standards and inherent policy enforcement with Authorization to Operate (ATO)
Development teams can ship efficiently and ensure applications are cyber ready for Navy Authorizing Officials (AOs). In this webinar, Sigma Defense and Anchore will give attendees a look behind the scenes and demo secure pipeline automation and security artifacts that speed up application ATO and time to production.
We will cover:
- How to remove silos in DevSecOps
- How to build efficient development pipeline roles and component templates
- How to deliver security artifacts that matter for ATO’s (SBOMs, vulnerability reports, and policy evidence)
- How to streamline operations with automated policy checks on container images
Essentials of Automations: The Art of Triggers and Actions in FMESafe Software
In this second installment of our Essentials of Automations webinar series, we’ll explore the landscape of triggers and actions, guiding you through the nuances of authoring and adapting workspaces for seamless automations. Gain an understanding of the full spectrum of triggers and actions available in FME, empowering you to enhance your workspaces for efficient automation.
We’ll kick things off by showcasing the most commonly used event-based triggers, introducing you to various automation workflows like manual triggers, schedules, directory watchers, and more. Plus, see how these elements play out in real scenarios.
Whether you’re tweaking your current setup or building from the ground up, this session will arm you with the tools and insights needed to transform your FME usage into a powerhouse of productivity. Join us to discover effective strategies that simplify complex processes, enhancing your productivity and transforming your data management practices with FME. Let’s turn complexity into clarity and make your workspaces work wonders!
Enchancing adoption of Open Source Libraries. A case study on Albumentations.AIVladimir Iglovikov, Ph.D.
Presented by Vladimir Iglovikov:
- https://www.linkedin.com/in/iglovikov/
- https://x.com/viglovikov
- https://www.instagram.com/ternaus/
This presentation delves into the journey of Albumentations.ai, a highly successful open-source library for data augmentation.
Created out of a necessity for superior performance in Kaggle competitions, Albumentations has grown to become a widely used tool among data scientists and machine learning practitioners.
This case study covers various aspects, including:
People: The contributors and community that have supported Albumentations.
Metrics: The success indicators such as downloads, daily active users, GitHub stars, and financial contributions.
Challenges: The hurdles in monetizing open-source projects and measuring user engagement.
Development Practices: Best practices for creating, maintaining, and scaling open-source libraries, including code hygiene, CI/CD, and fast iteration.
Community Building: Strategies for making adoption easy, iterating quickly, and fostering a vibrant, engaged community.
Marketing: Both online and offline marketing tactics, focusing on real, impactful interactions and collaborations.
Mental Health: Maintaining balance and not feeling pressured by user demands.
Key insights include the importance of automation, making the adoption process seamless, and leveraging offline interactions for marketing. The presentation also emphasizes the need for continuous small improvements and building a friendly, inclusive community that contributes to the project's growth.
Vladimir Iglovikov brings his extensive experience as a Kaggle Grandmaster, ex-Staff ML Engineer at Lyft, sharing valuable lessons and practical advice for anyone looking to enhance the adoption of their open-source projects.
Explore more about Albumentations and join the community at:
GitHub: https://github.com/albumentations-team/albumentations
Website: https://albumentations.ai/
LinkedIn: https://www.linkedin.com/company/100504475
Twitter: https://x.com/albumentations
Maruthi Prithivirajan, Head of ASEAN & IN Solution Architecture, Neo4j
Get an inside look at the latest Neo4j innovations that enable relationship-driven intelligence at scale. Learn more about the newest cloud integrations and product enhancements that make Neo4j an essential choice for developers building apps with interconnected data and generative AI.
Sudheer Mechineni, Head of Application Frameworks, Standard Chartered Bank
Discover how Standard Chartered Bank harnessed the power of Neo4j to transform complex data access challenges into a dynamic, scalable graph database solution. This keynote will cover their journey from initial adoption to deploying a fully automated, enterprise-grade causal cluster, highlighting key strategies for modelling organisational changes and ensuring robust disaster recovery. Learn how these innovations have not only enhanced Standard Chartered Bank’s data infrastructure but also positioned them as pioneers in the banking sector’s adoption of graph technology.
Threats to mobile devices are more prevalent and increasing in scope and complexity. Users of mobile devices desire to take full advantage of the features
available on those devices, but many of the features provide convenience and capability but sacrifice security. This best practices guide outlines steps the users can take to better protect personal devices and information.
Encryption in Microsoft 365 - ExpertsLive Netherlands 2024Albert Hoitingh
In this session I delve into the encryption technology used in Microsoft 365 and Microsoft Purview. Including the concepts of Customer Key and Double Key Encryption.
GraphSummit Singapore | The Art of the Possible with Graph - Q2 2024Neo4j
Neha Bajwa, Vice President of Product Marketing, Neo4j
Join us as we explore breakthrough innovations enabled by interconnected data and AI. Discover firsthand how organizations use relationships in data to uncover contextual insights and solve our most pressing challenges – from optimizing supply chains, detecting fraud, and improving customer experiences to accelerating drug discoveries.
Securing your Kubernetes cluster_ a step-by-step guide to success !KatiaHIMEUR1
Today, after several years of existence, an extremely active community and an ultra-dynamic ecosystem, Kubernetes has established itself as the de facto standard in container orchestration. Thanks to a wide range of managed services, it has never been so easy to set up a ready-to-use Kubernetes cluster.
However, this ease of use means that the subject of security in Kubernetes is often left for later, or even neglected. This exposes companies to significant risks.
In this talk, I'll show you step-by-step how to secure your Kubernetes cluster for greater peace of mind and reliability.
GridMate - End to end testing is a critical piece to ensure quality and avoid...ThomasParaiso2
End to end testing is a critical piece to ensure quality and avoid regressions. In this session, we share our journey building an E2E testing pipeline for GridMate components (LWC and Aura) using Cypress, JSForce, FakerJS…
Goodbye Windows 11: Make Way for Nitrux Linux 3.5.0!SOFTTECHHUB
As the digital landscape continually evolves, operating systems play a critical role in shaping user experiences and productivity. The launch of Nitrux Linux 3.5.0 marks a significant milestone, offering a robust alternative to traditional systems such as Windows 11. This article delves into the essence of Nitrux Linux 3.5.0, exploring its unique features, advantages, and how it stands as a compelling choice for both casual users and tech enthusiasts.
Unlocking Productivity: Leveraging the Potential of Copilot in Microsoft 365, a presentation by Christoforos Vlachos, Senior Solutions Manager – Modern Workplace, Uni Systems
Generative AI Deep Dive: Advancing from Proof of Concept to ProductionAggregage
Join Maher Hanafi, VP of Engineering at Betterworks, in this new session where he'll share a practical framework to transform Gen AI prototypes into impactful products! He'll delve into the complexities of data collection and management, model selection and optimization, and ensuring security, scalability, and responsible use.
6. Cycle time is the time taken by the longest activity (here it is 7 min).
Throughput time is 46 min.
7. Assignment-2 Q2
Cycle Time and Deciding on stages
0.1 min. 1.0 min. A Simple Precedence
a Diagram
b
c d e
0.7 min. 0.5 min. 0.2 min.
Arrange tasks shown in the above Figure into three workstations.
Use a cycle time of 1.0 minute
Assign tasks in order of the most number of followers
8. Raw Pack Finished
Bread Making WIP
Material Cycle Time: Goods
Cycle Time:
3/4Hr /100
1 Hr/100 loaves
loaves
packaging operation will be idle for quarter-hour periods (15 mins)
Bread Making
Cycle Time: The packaging operation is
1 Hr/100 loaves now the bottleneck
Raw WIP Pack Finished
Material Cycle Time: Goods
3/4Hr /100
loaves
Bread Making
Cycle Time: If we operated the packaging operation
1 Hr/100 loaves for three eight-hour shifts, and bread
making for two shifts each day, then the
daily capacity of each would be identical
at 3,200 loaves a day (800 loafs x 4 shifts).
9. Packaging 3 shifts Bread making 2
shifts: work-in-process inventory
• If both bread-making operations start at the same
time, at the end of the first hour, then the first
100 loaves move into packaging while the second
100 loaves wait—work-in-process inventory.
• The waiting time for each 100-loaf batch
increases until the baking is done at the end of
the second shift.
• What is the time that the bread is sitting in work-
in-process?
10. • Average wip during first two shifts, inventory
builds from 0 to 1,200 loaves (1,600 x .75). (Or
800 loaves x 2 shifts x .75 pkg.) = 1200/2
• Average wip during third shift is again 1200/2
• The overall average WIP over the 24-hour period
is simply 600 loaves of bread.
• Packaging process in batches.
1) 0.75 hour per 100 loaves
2) Throughput rate of 133.3 loaves/hour
(100/0.75)
• Little’s Law calculates the average time that
loaves are in work-in-process is 4.5 hours (600
loaves/133.33 loaves/hour)
11. Our Restaurant
• Assume that we have designed our buffet so customers
take an average of 30 minutes to get their food and eat.
• Assume the restaurant has 40 tables. Each table can
accommodate four people.
• The Cycle Time for the restaurant, when operating at
capacity, is 0.75 minute (30 minutes/table ÷ 40 tables).
• The restaurant could handle 80 customer parties per hour
(60 minutes ÷ 0.75 minute/party) is the capacity or
customer parties per hour.
• Assume that our customers eat in groups (or customer
parties) of two or three to a table.
• How many customers can the restaurant serve if the
average customer party is 2.5?
• During lunch time, Customers arrive as per the schedule
given.
12. Solution
• If the average customer party is 2.5 individuals,
then the average seat utilization is 62.5 percent
(2.5 seats/party ÷ 4 seats per table) when the
restaurant is operating at capacity.
• The Cycle Time for the restaurant, when
operating at capacity, is 0.75 minute (30
minutes/table ÷ 40 tables).
• The restaurant could handle 80 customer parties
per hour (60 minutes ÷ 0.75 minute/party) is the
capacity or customer parties per hour.
• 20 tables empty during each 15-minute interval
13. During Period End of Period
IN Out To Serve Tables Wait Wait Time
11:30-11:45 15 0
11:45-12:00 35 0
12:00-12:15 30 15
12:15-12:30 15 20
12:30-12:45 10 20
12:45-1:00 5 20
1:00-1:15 0
1:15-1:30 0
Total Served
Formula Data
The first 15 tables empty after 30 mins.
After that the restaurant can serve 20 tables every 15 minuets.
14. During Period End of Period
IN Out To Serve Tables Wait
11:30-11:45 15 0 15 15 0
11:45-12:00 35 0 50 40 10
12:00-12:15 30 15 65 40 25
12:15-12:30 15 20 60 40 20
12:30-12:45 10 20
12:45-1:00 5 20
1:00-1:15 0
1:15-1:30 0
Total Served
Formula Data
. 12:00, we will have to keep 10 parties waiting: 15+35-40
At
Between 12:00 – 12:15, we have another 30 parties coming in and 15
leaving. So we will have 15+35+30-40 -15 = 25 waiting
12:15-12:30 we have 15 parties coming in and 20 leaving, so we will have
15+35+30+15-40-15-20 = 20 waiting
15. During Period End of Period
IN Out To Serve Tables Wait
11:30-11:45 15 0 15 15 0
11:45-12:00 35 0 50 40 10
12:00-12:15 30 15 65 40 25
12:15-12:30 15 20 60 40 20
12:30-12:45 10 20 50 40 10
12:45-1:00 5 20 35 35 0
1:00-1:15 0 20 15 15 0
1:15-1:30 0 15 0 0 0
Total Served 110
20 per 15 Table+IN- IF((To serve<40),To To serve-
Formula Data mins OUT serve,40) Table
.
16. During Period End of Period
IN Out To Serve Tables Wait Wait Time
11:30-11:45 15 0 15 15 0 0
11:45-12:00 35 0 50 40 10 7.5
12:00-12:15 30 15 65 40 25 18.75
12:15-12:30 15 20 60 40 20 15
12:30-12:45 10 20 50 40 10 7.5
12:45-1:00 5 20 35 35 0 0
1:00-1:15 0 20 15 15 0 0
1:15-1:30 0 15 0 0 0 0
Total Served 110
20 per 15 Table+IN- IF((To serve<40),To To serve-
Formula Data mins OUT serve,40) Table Wait*15/20
Expected wait time = customers waiting x 0.75 minute
Double up parties at the tables, thus getting a higher seat
utilization. Might be the easiest solution to the problem. If 25
out of the 40 tables were doubled up, our problem would be
solved… (40+20)*2.5 > 40*4.. So?
17. Transit Bus Operation
• Logistics refers to the movement of things
such as materials, people, or finished goods.
• A single bus takes exactly two hours to
traverse the route during peak traffic.
• Wait time for the customer: Maximum is 2
Minimum is 0, Average would be one hour.
• Bus capacity: seating 50 Standing 30
18. No of
customers Av Time
8-9 AM 2,000 45
9-10 AM 4000 30
10-11 AM 6000 30
11-12 noon 5000 30
12-1 PM 4000 30
1-2 PM 3500 30
2-3 PM 3000 45
3-4 PM 3000 45
4-5 PM 3000 45
5-6 PM 4000 45
6-7 PM 3000 45
7-8 PM 1500 45
How do we estimate number of passengers
carried by a bus per trip? Per hour?
19. No of Passenger Min No of Max No of
customers Av Time Hours Buses Buses
8-9 AM 2,000 45 1500 18.75 30
9-10 AM 4000 30 2000 25 40
10-11 AM 6000 30 3000 37.5 60
11-12 noon 5000 30 2500 31.25 50
12-1 PM 4000 30 2000 25 40
1-2 PM 3500 30 1750 21.875 35
2-3 PM 3000 45 2250 28.125 45
3-4 PM 3000 45 2250 28.125 45
4-5 PM 3000 45 2250 28.125 45
5-6 PM 4000 45 3000 37.5 60
6-7 PM 3000 45 2250 28.125 45
7-8 PM 1500 45 1125 14.0625 22.5
20. Process Throughput Time Reduction
• Perform activities in parallel
• Change the sequence of activities
• Reduce interruptions
21. Productivity and Efficiency
• Productivity is output to input. It may be total
factor productivity or partial factor
productivity.
– The ratio is generally taken in monitory terms.
• Efficiency is the ratio of actual output of a
process relative to some standard or best level
of output.
23. Little’s Law
• Little’s Law—states a mathematical relationship
between throughput rate, throughput time, and the
amount of work-in-process inventory.
• Little’s Law estimates the time that an item will spend
in work-in-process inventory, which can be useful for
calculating the total throughput time for a process.
• Little’s Law = Throughput time = Work-in-process
Throughput rate
• (Throughput rate is the output rate that the process is
expected to produce over a period of time.)
24. Example
• if the assembly line has six stations with one unit of work-
in-process at each station, and the throughput rate is 2
units per minute (60 seconds/30 seconds per unit),
• then the throughput time is three minutes (6 units/2 units
per minute).
• This formula holds for any process that is operating at a
steady rate.
• Steady rate—means that work is entering and exiting the
system at the same rate over the time period being
analyzed.
• For example, our assembly line has 120 units entering and
120 units exiting the process each hour. Not 150 units
entering the system each hour but only 120 units exiting.
25.
26. The McDonaldization of Society (1993)
George Ritzer
• Efficiency – the optimal method for accomplishing a task.
In this context, Ritzer has a very specific meaning of
"efficiency". Here, the optimal method equates to the
fastest method to get from point A to point B.
• Calculability – objective should be quantifiable (e.g., sales)
rather than subjective (e.g., taste). McDonaldization
developed the notion that quantity equals quality, and that
a large amount of product delivered to the customer in a
short amount of time is the same as a high quality product.
• Predictability – standardized and uniform services. “Their
tasks are highly repetitive, highly routine, and predictable”.
• Control – standardized and uniform employees,
replacement of human by non-human technologies.
27. MAC: Make to Stock Customer
Orders
RAW Finished
Material Cook Assemble Goods
Deliver
Burger King:
Hybrid Assemble
RAW
Material WIP Customer Sta
Cook Orders Deliver
nd
ard
Wendy’s: Make to Customer Finished
Order Orders Goods
Assemble
RAW
Material
Cook Assemble Deliver
Chili
28.
29.
30. Make to Order
Process Analysis Issues and Metrics?
• ????
• Assignment