Download as PPSX, PPTX

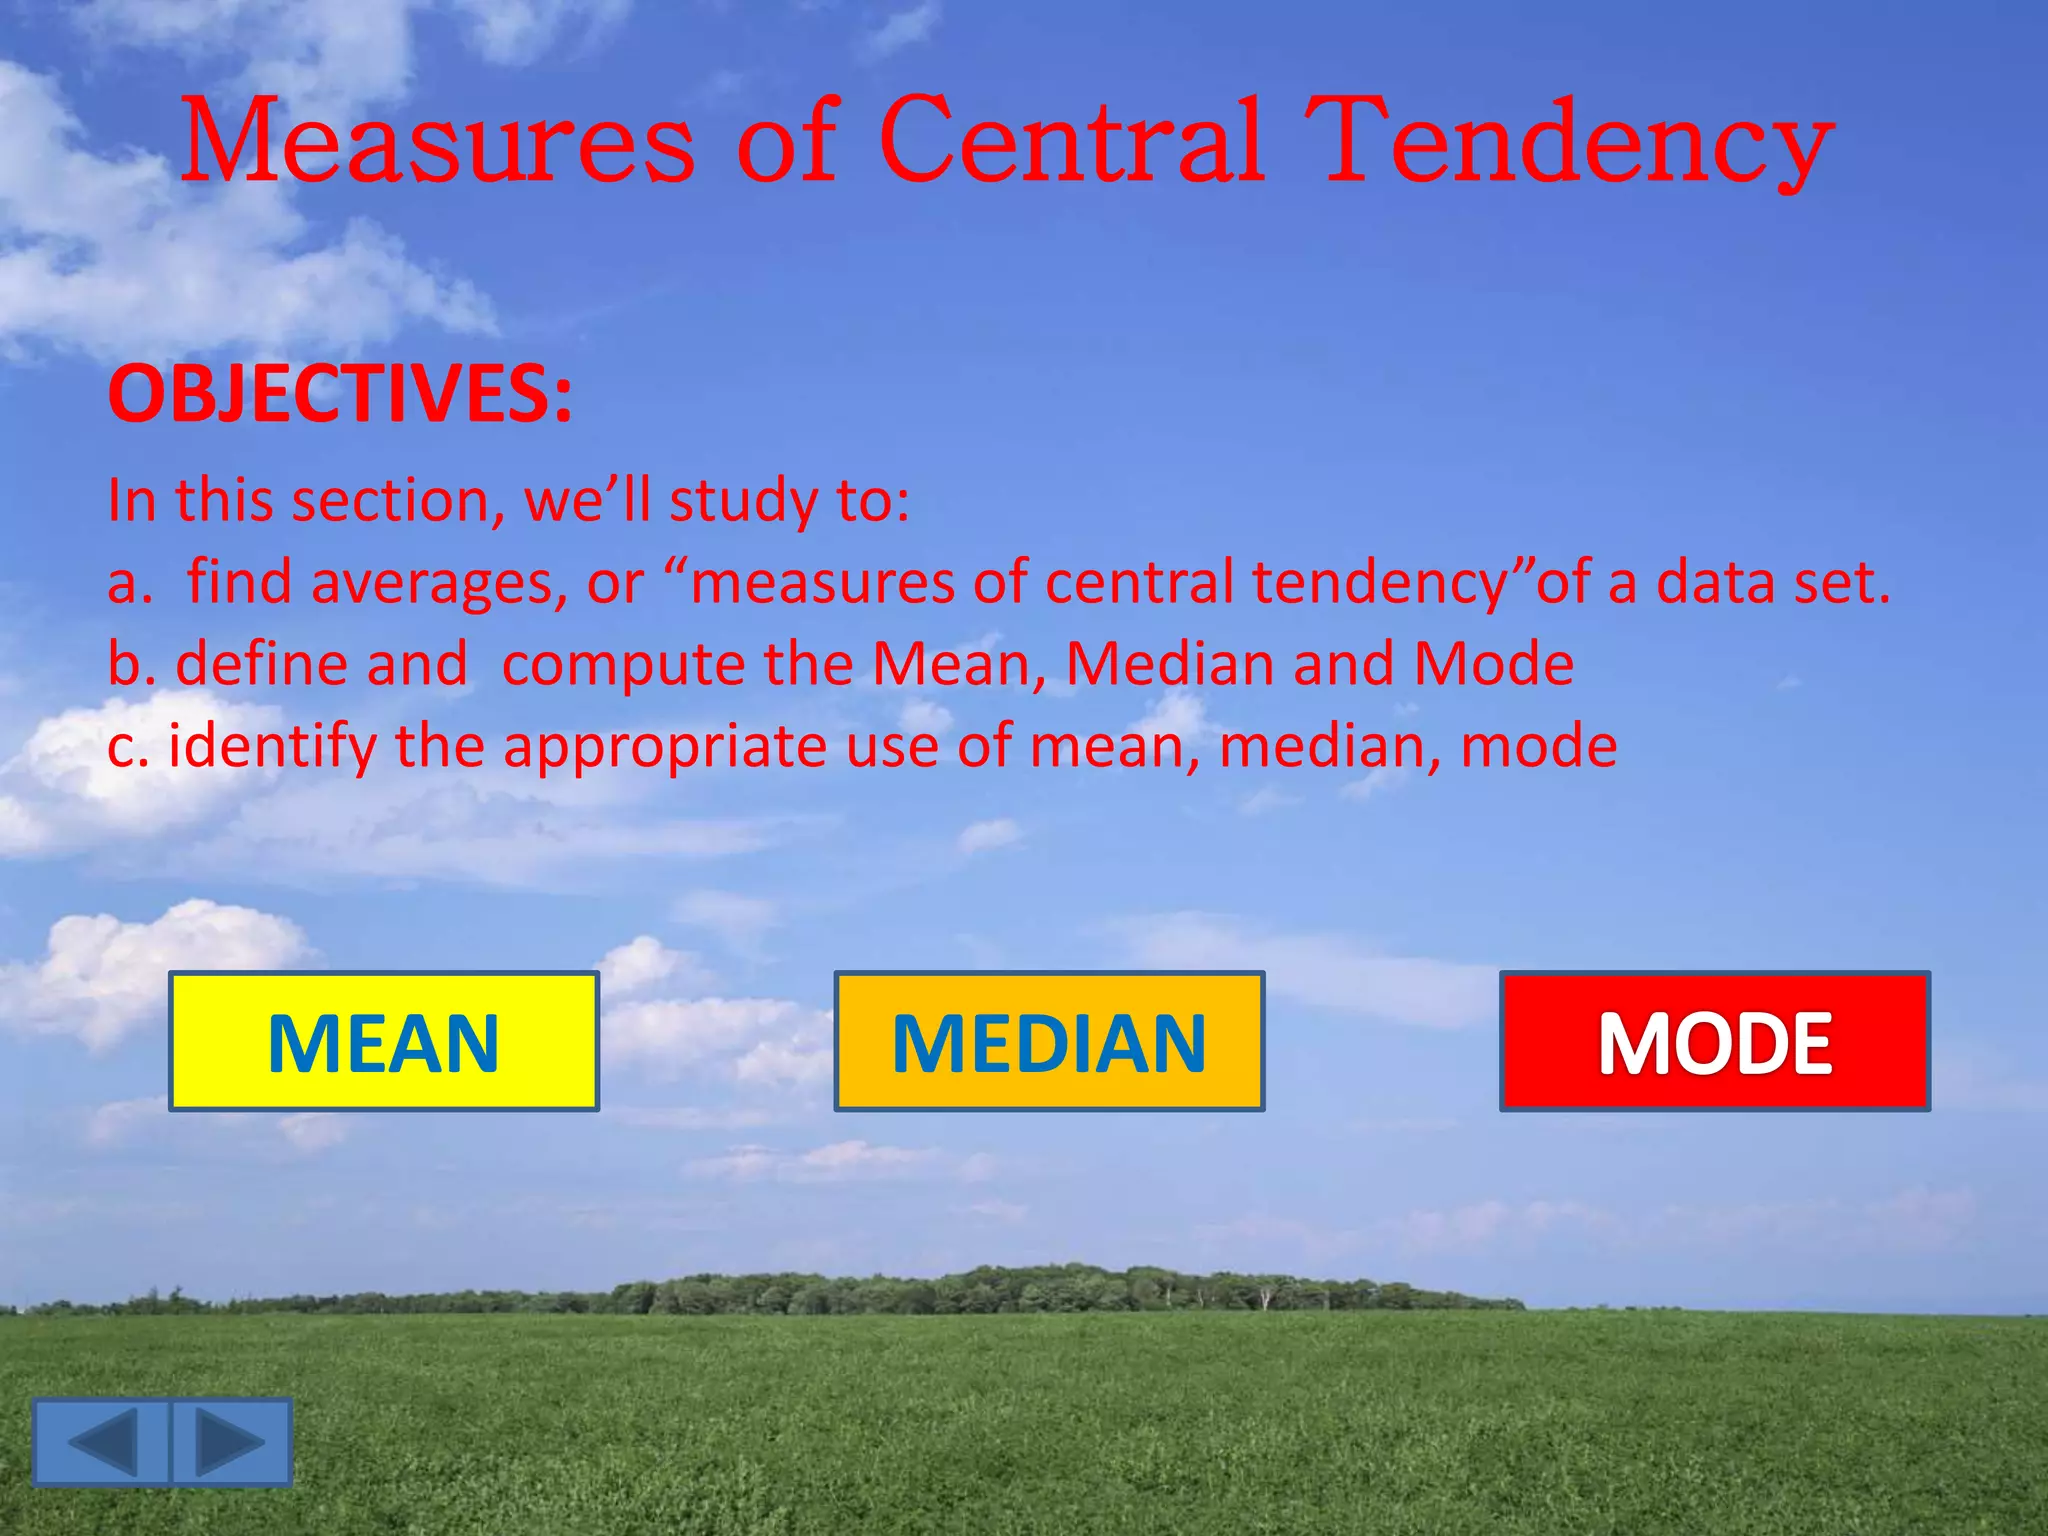
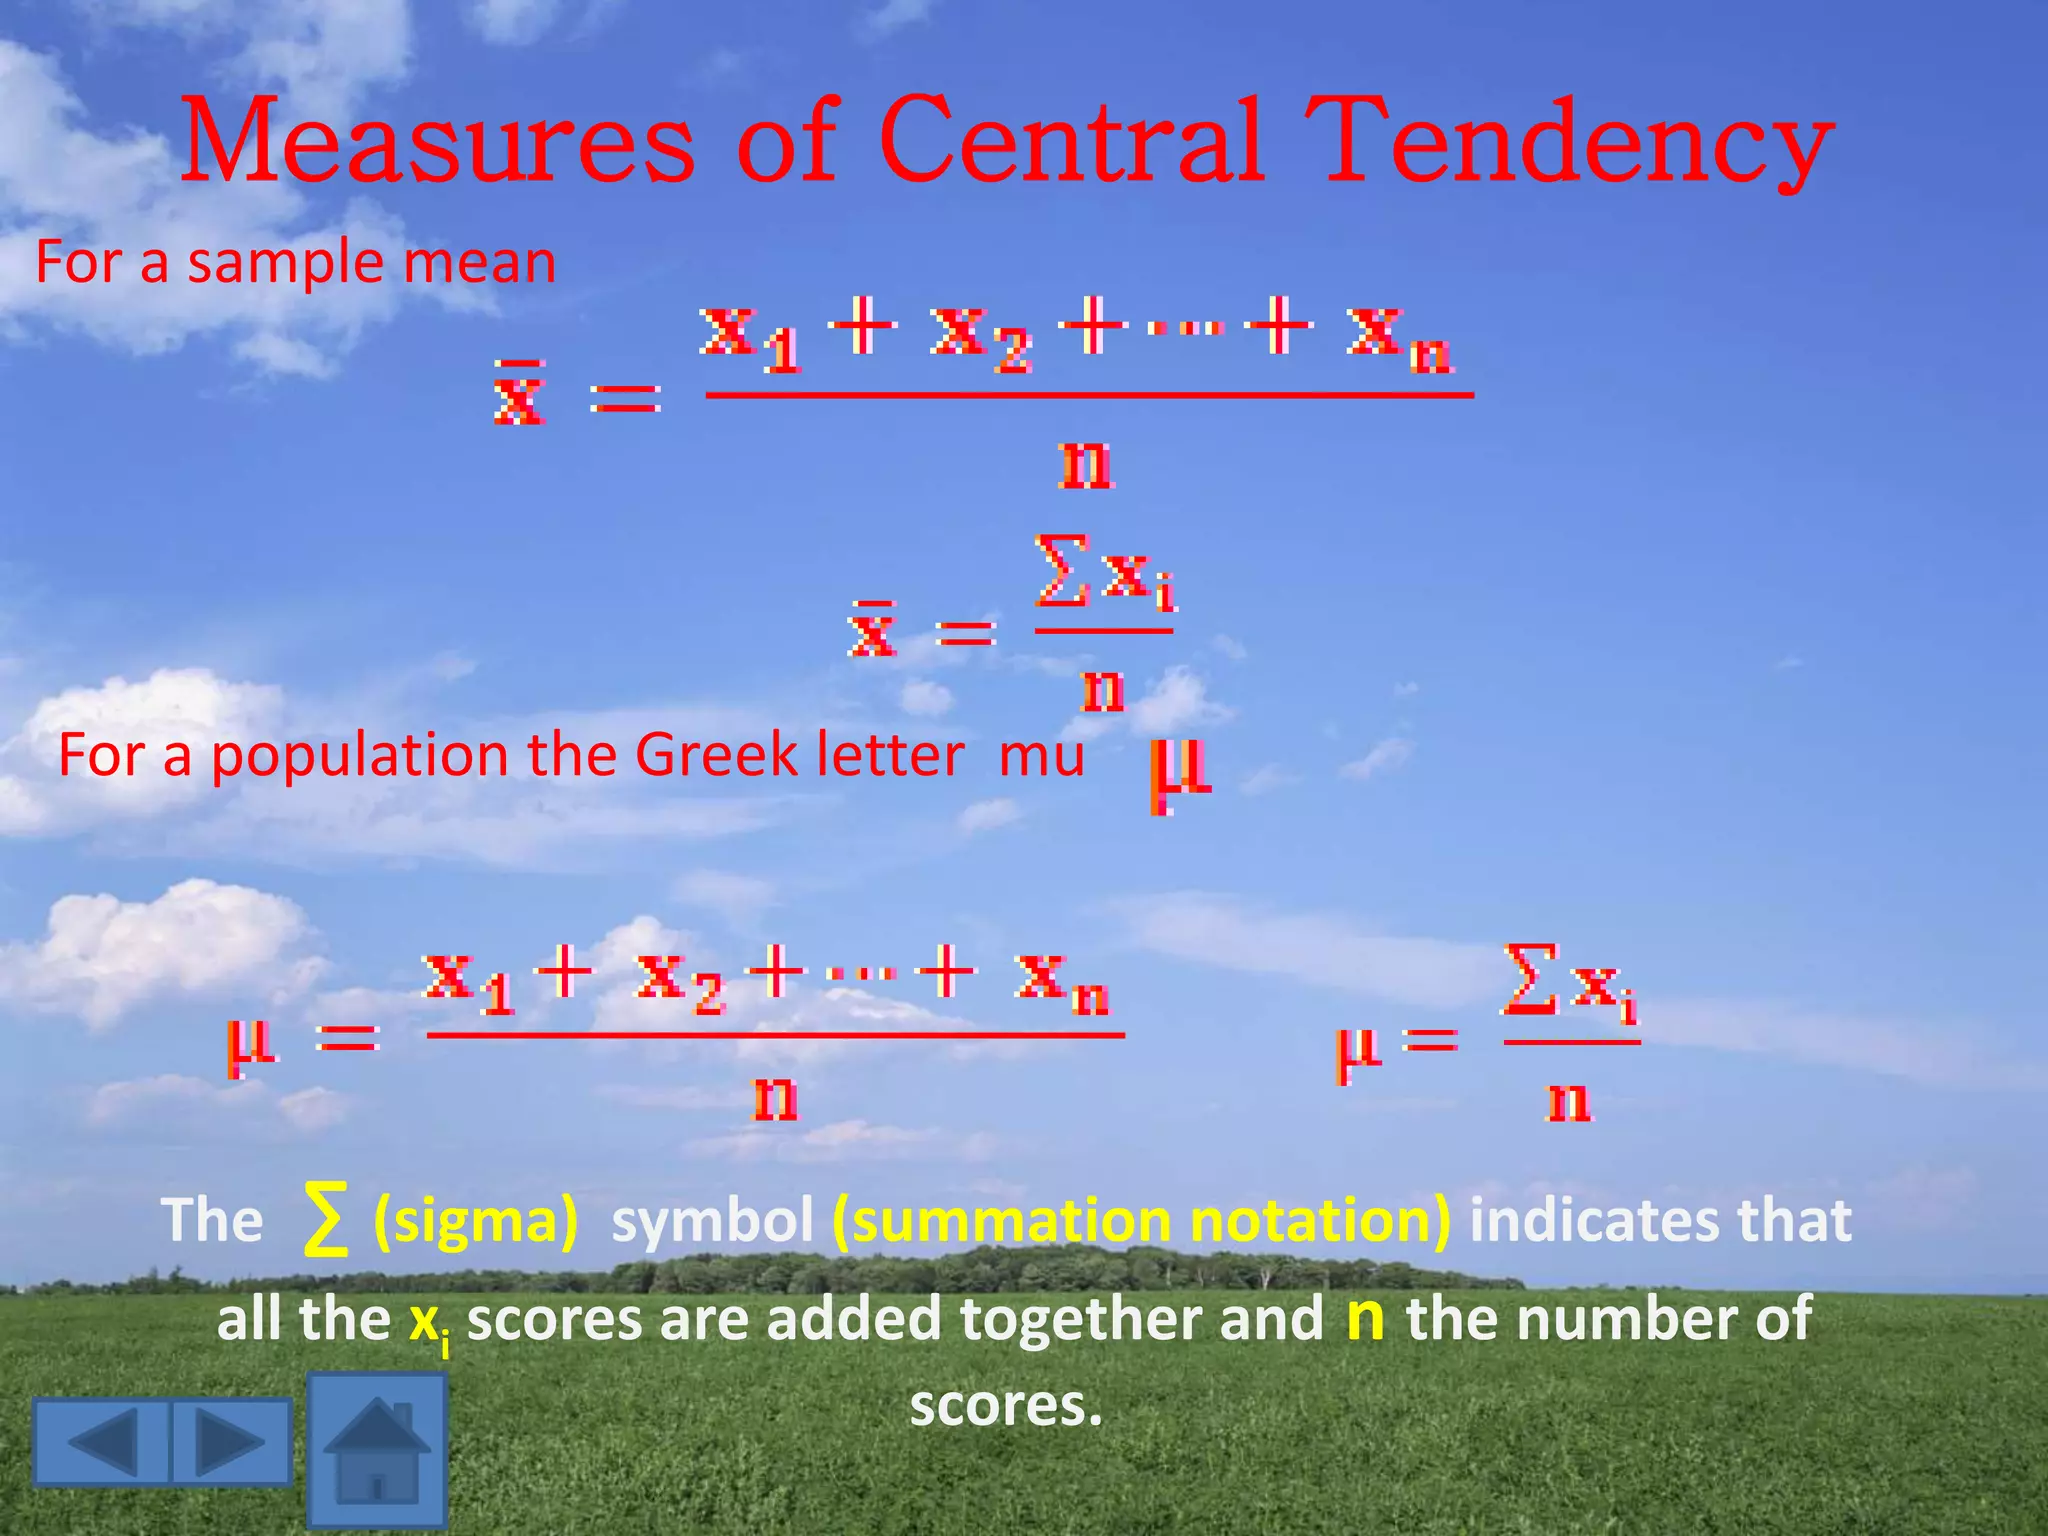
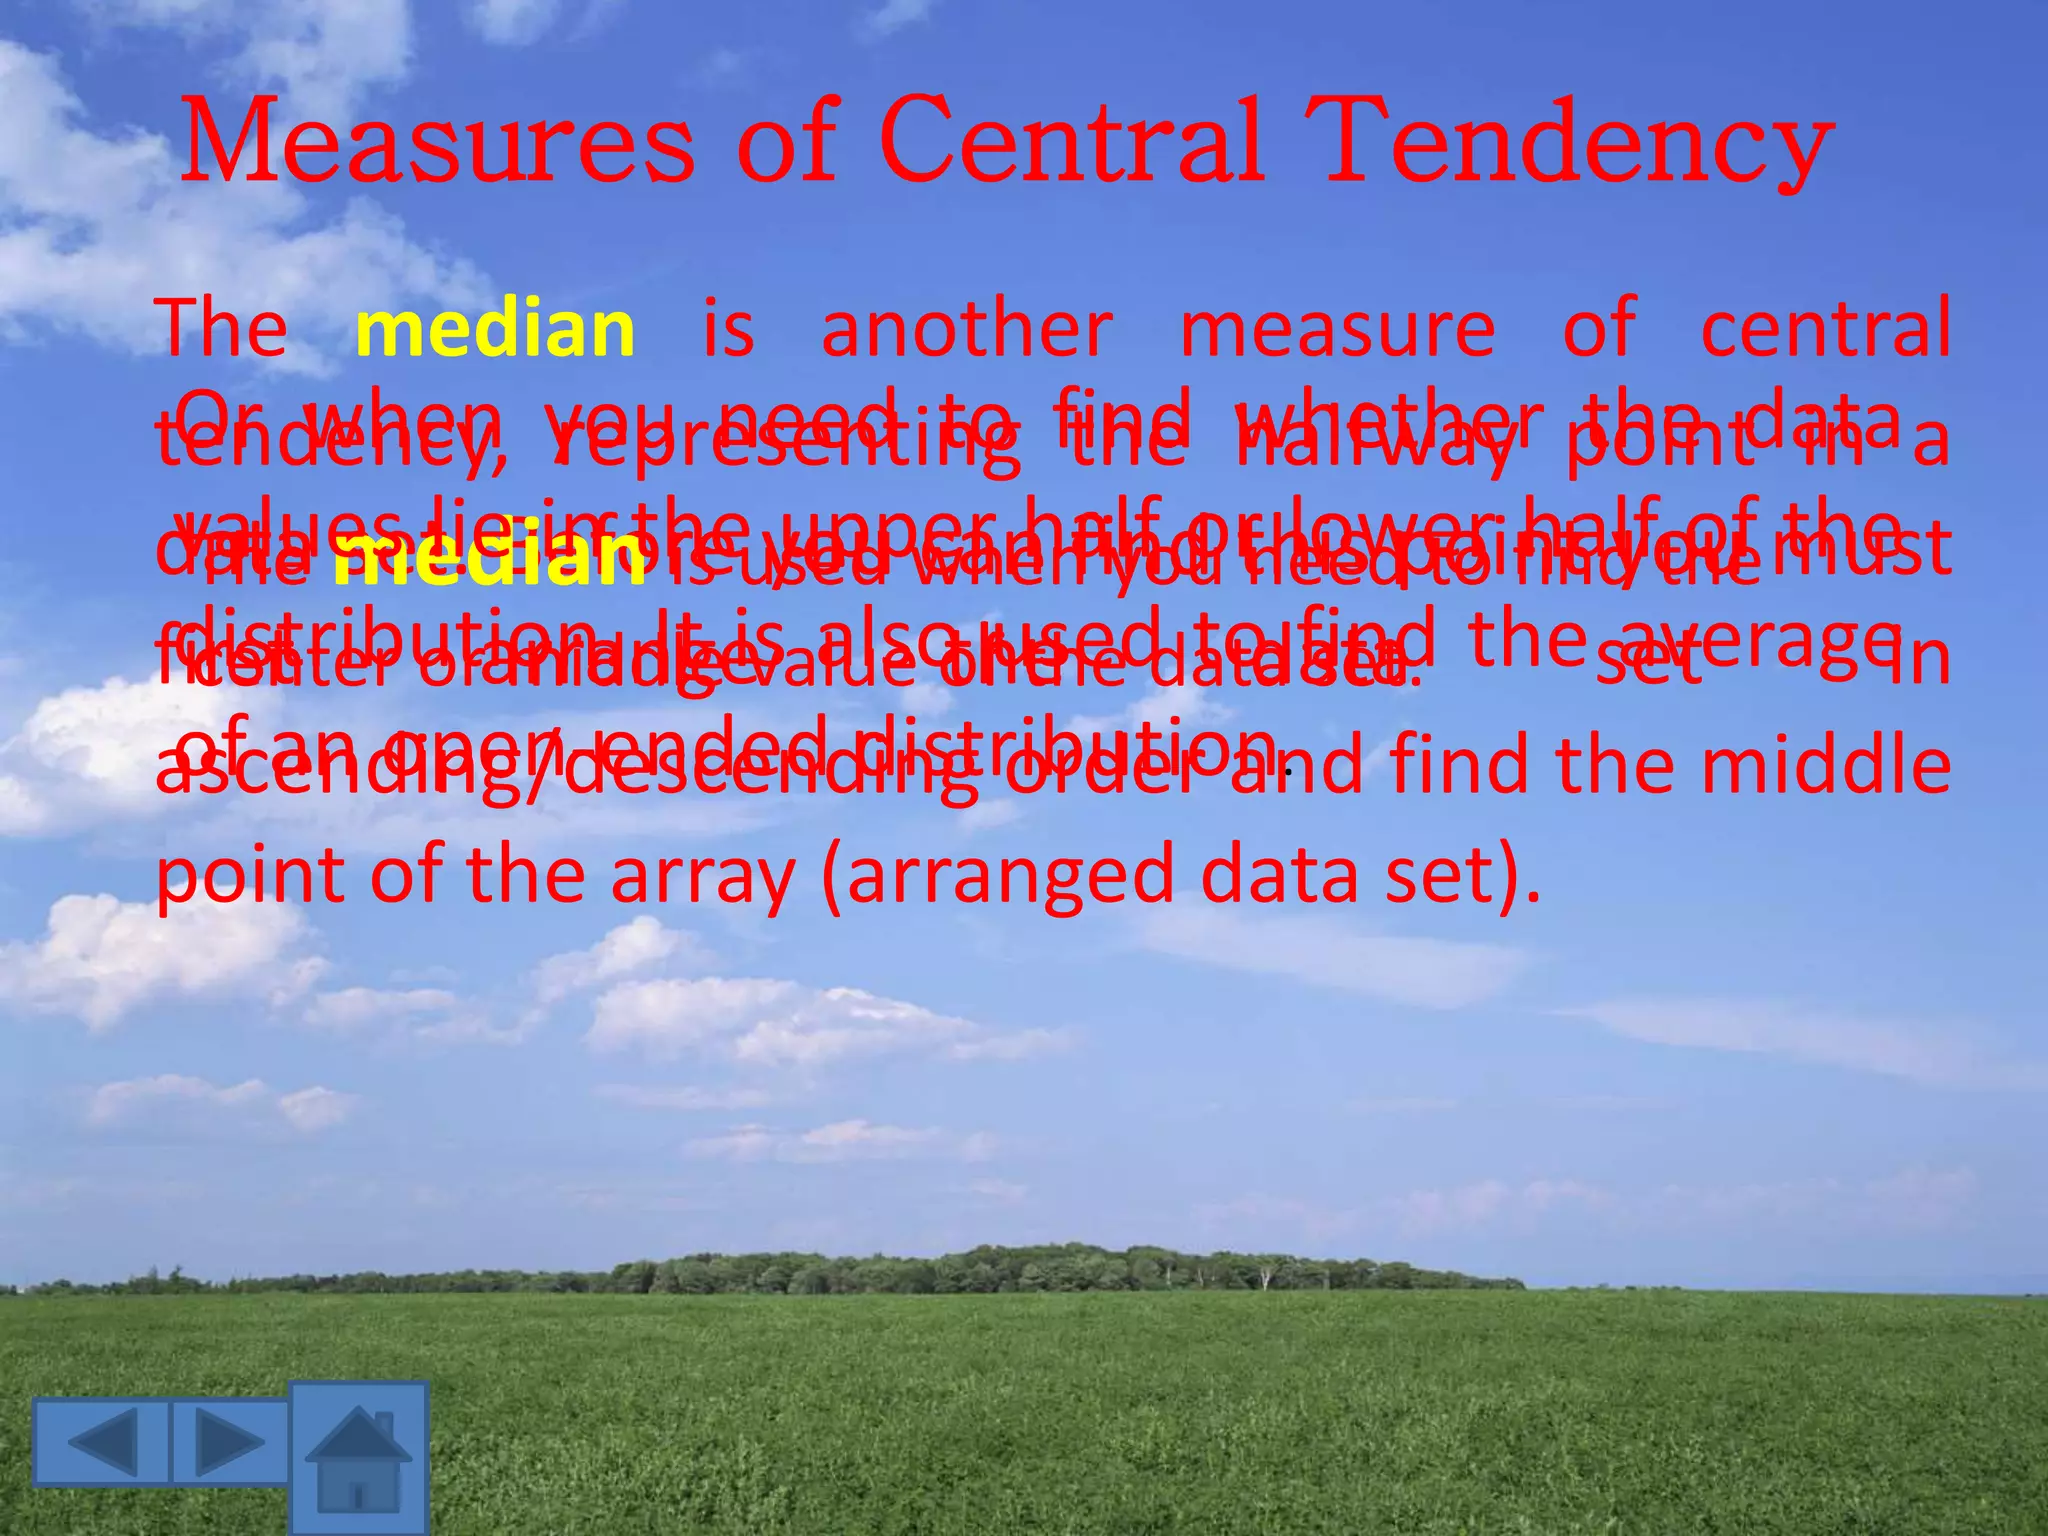
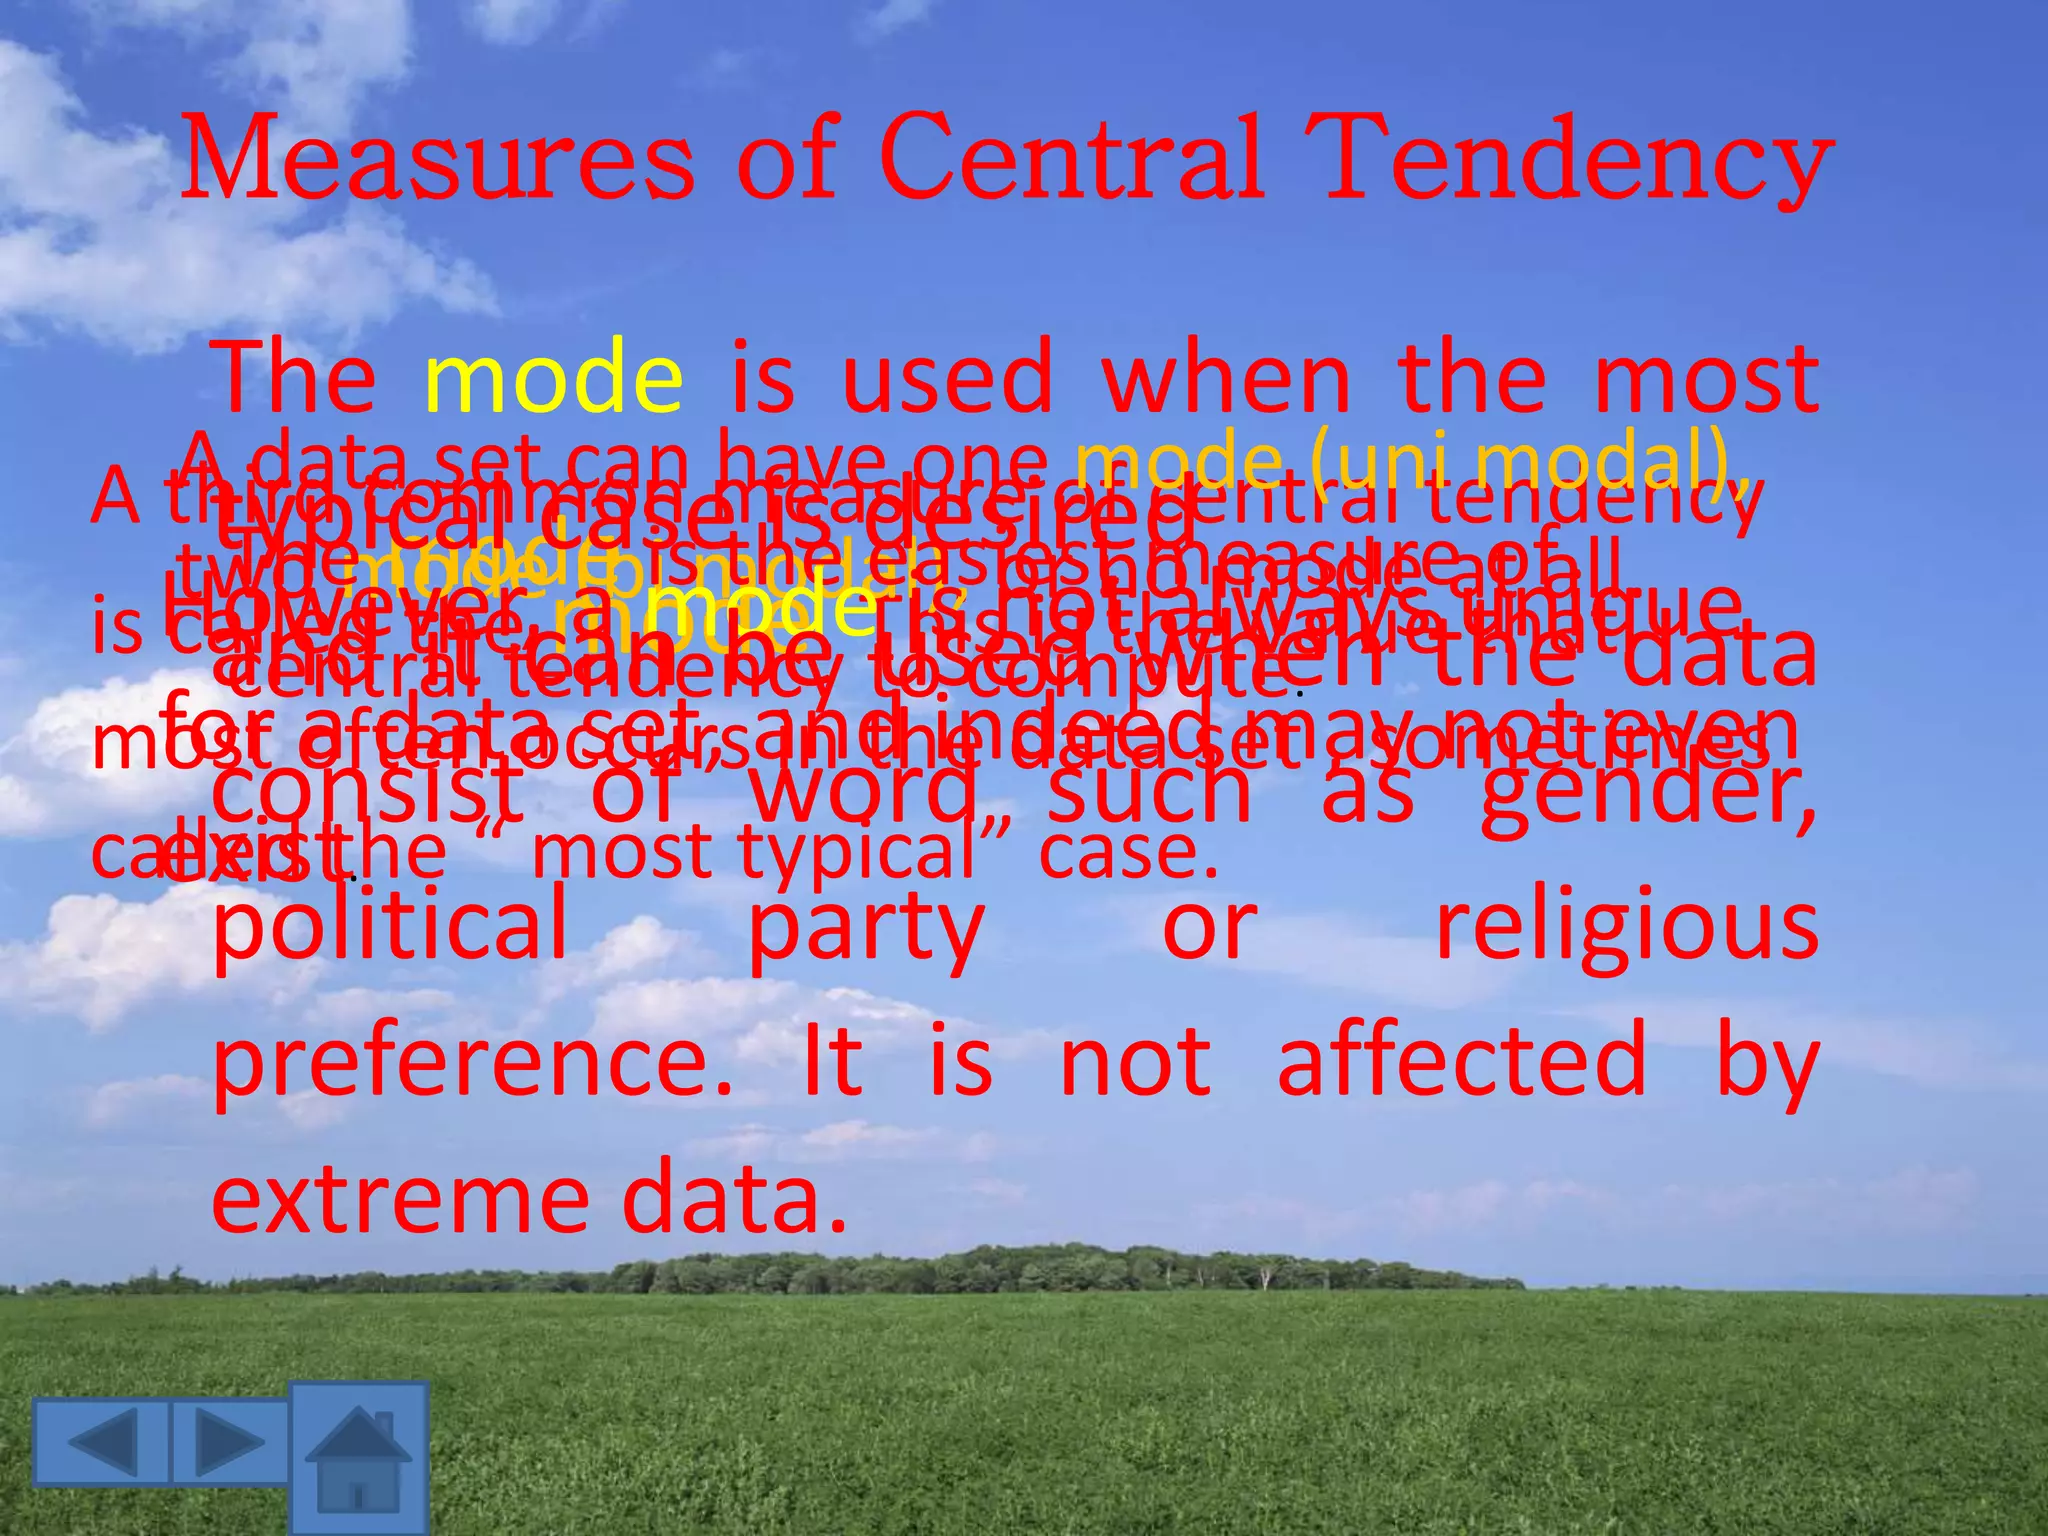
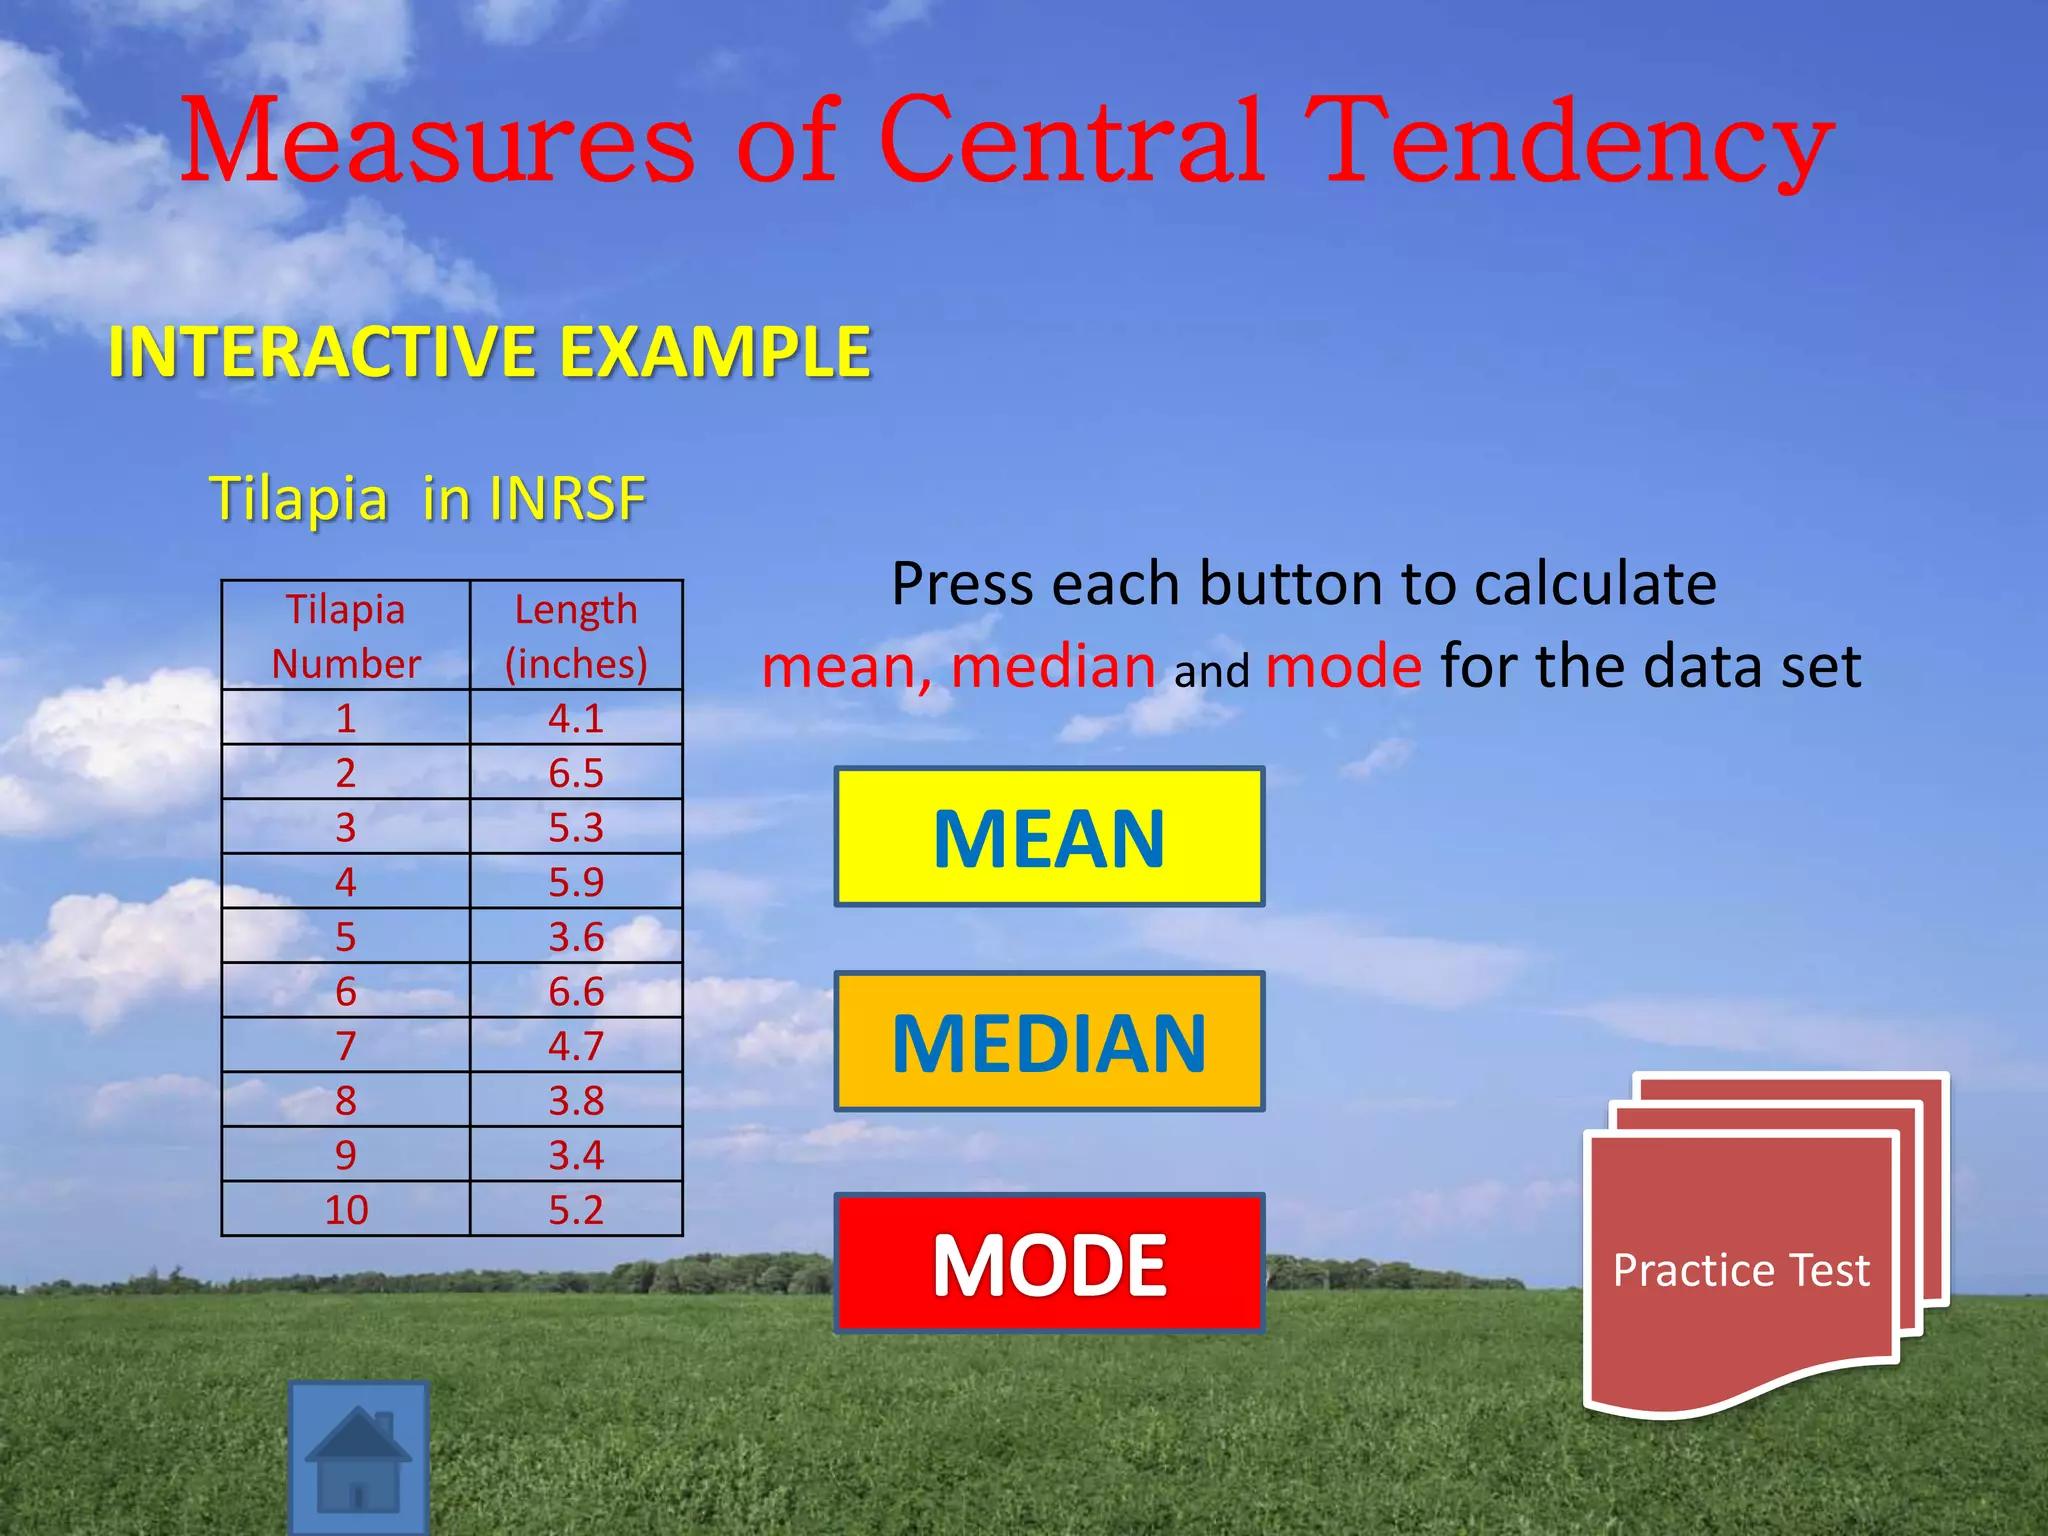
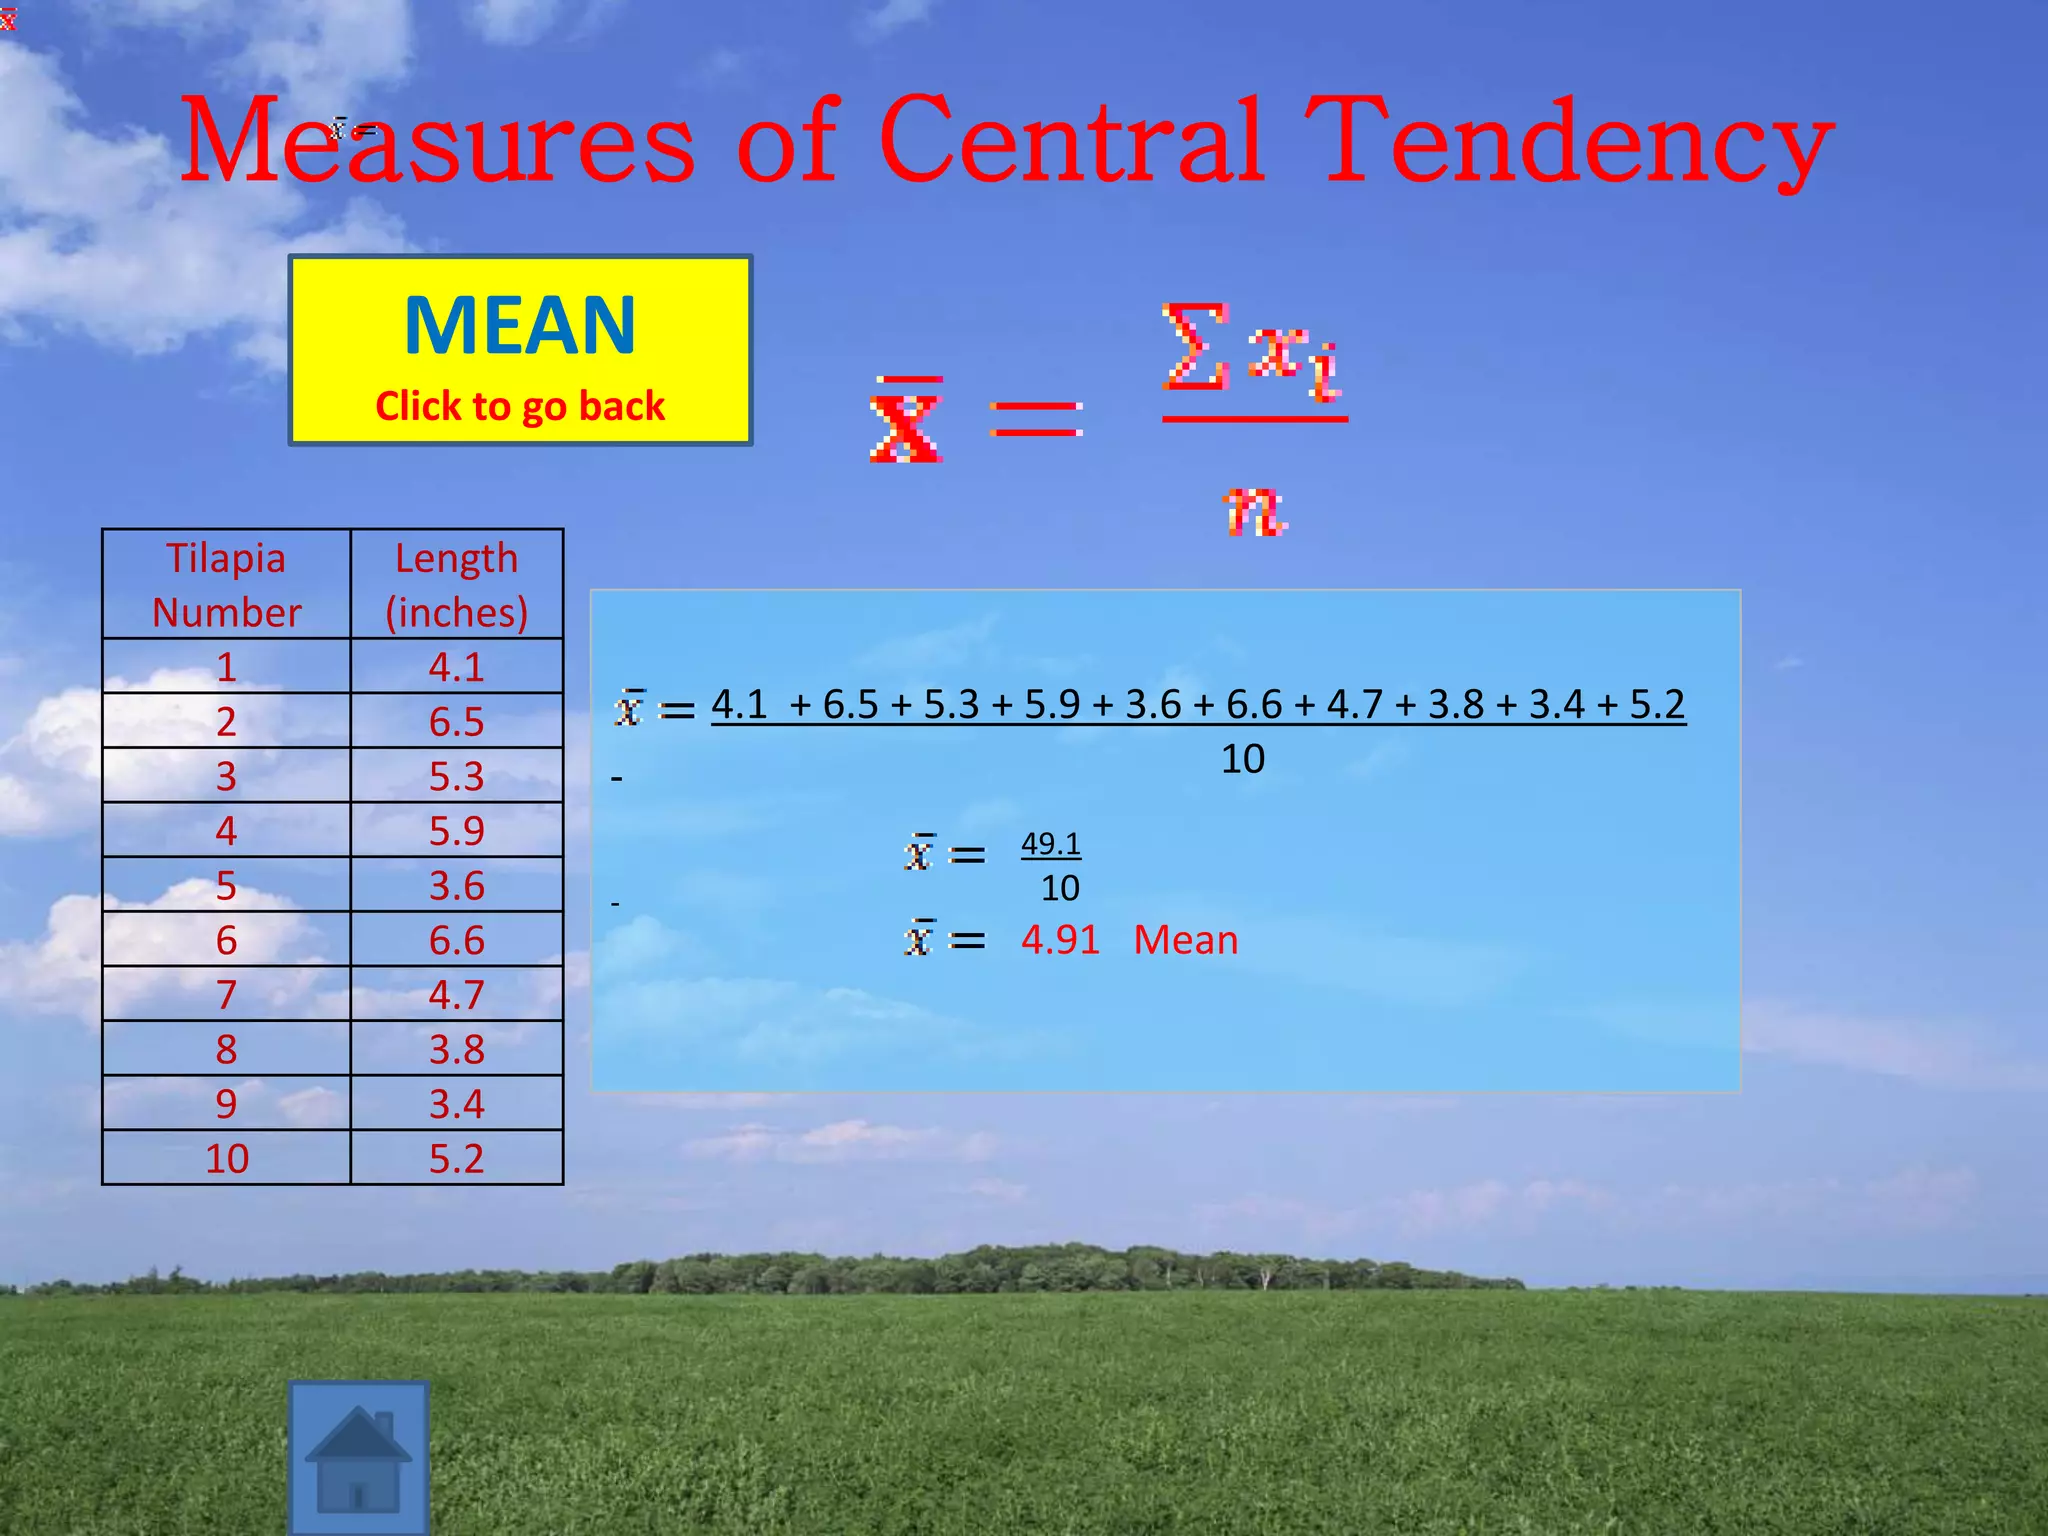
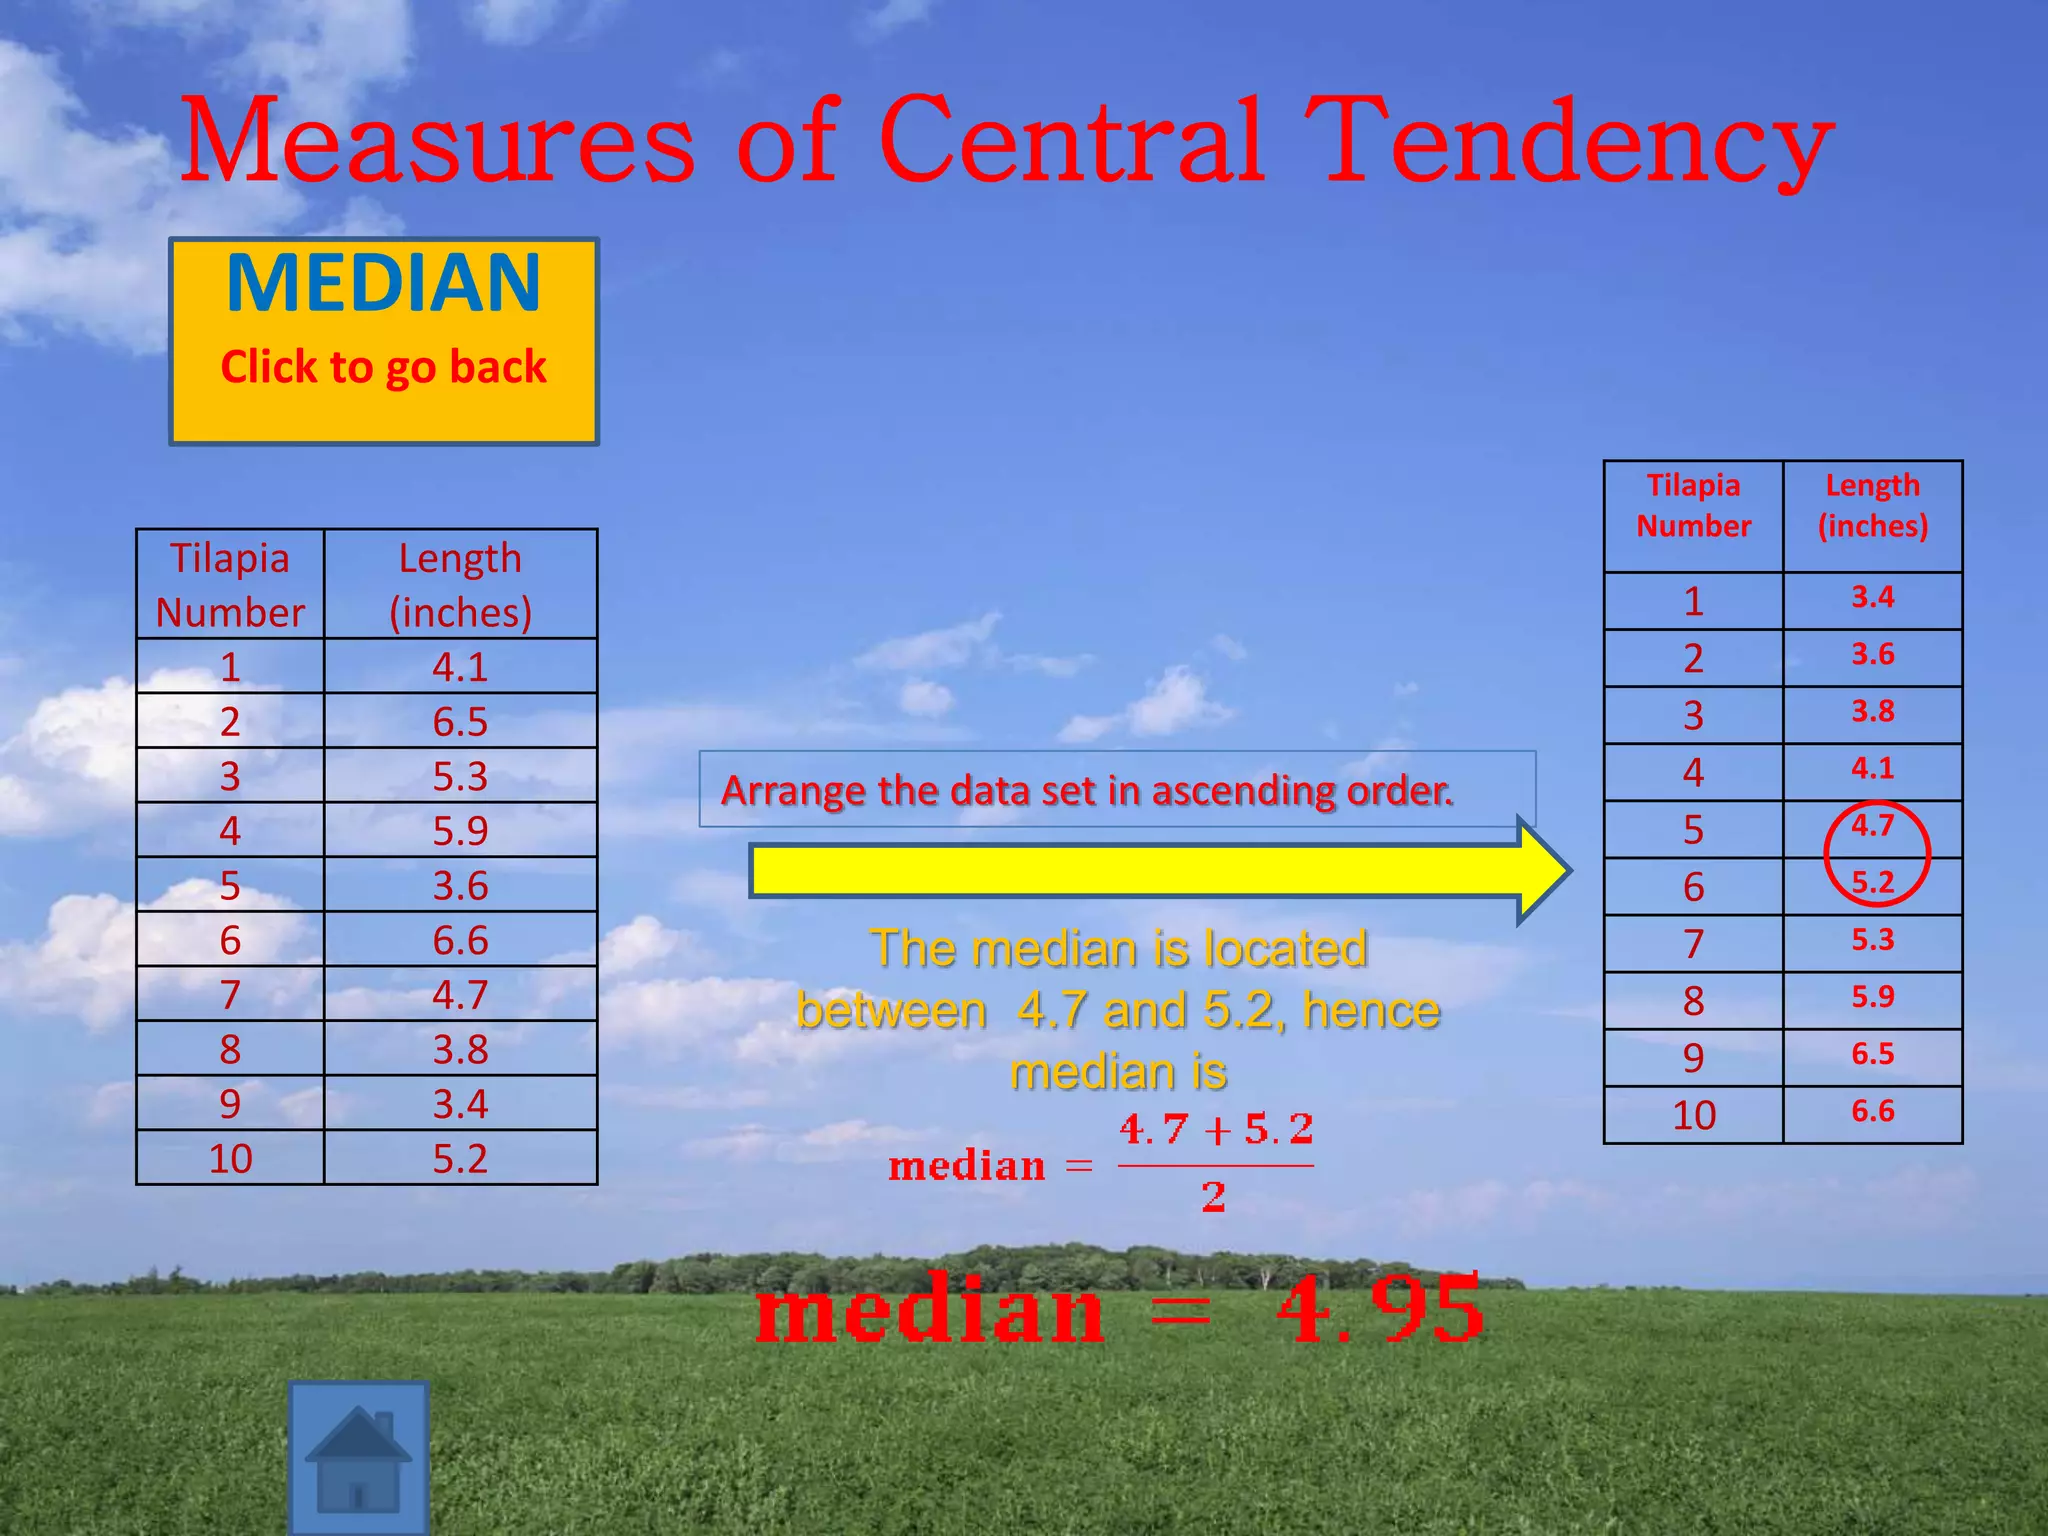
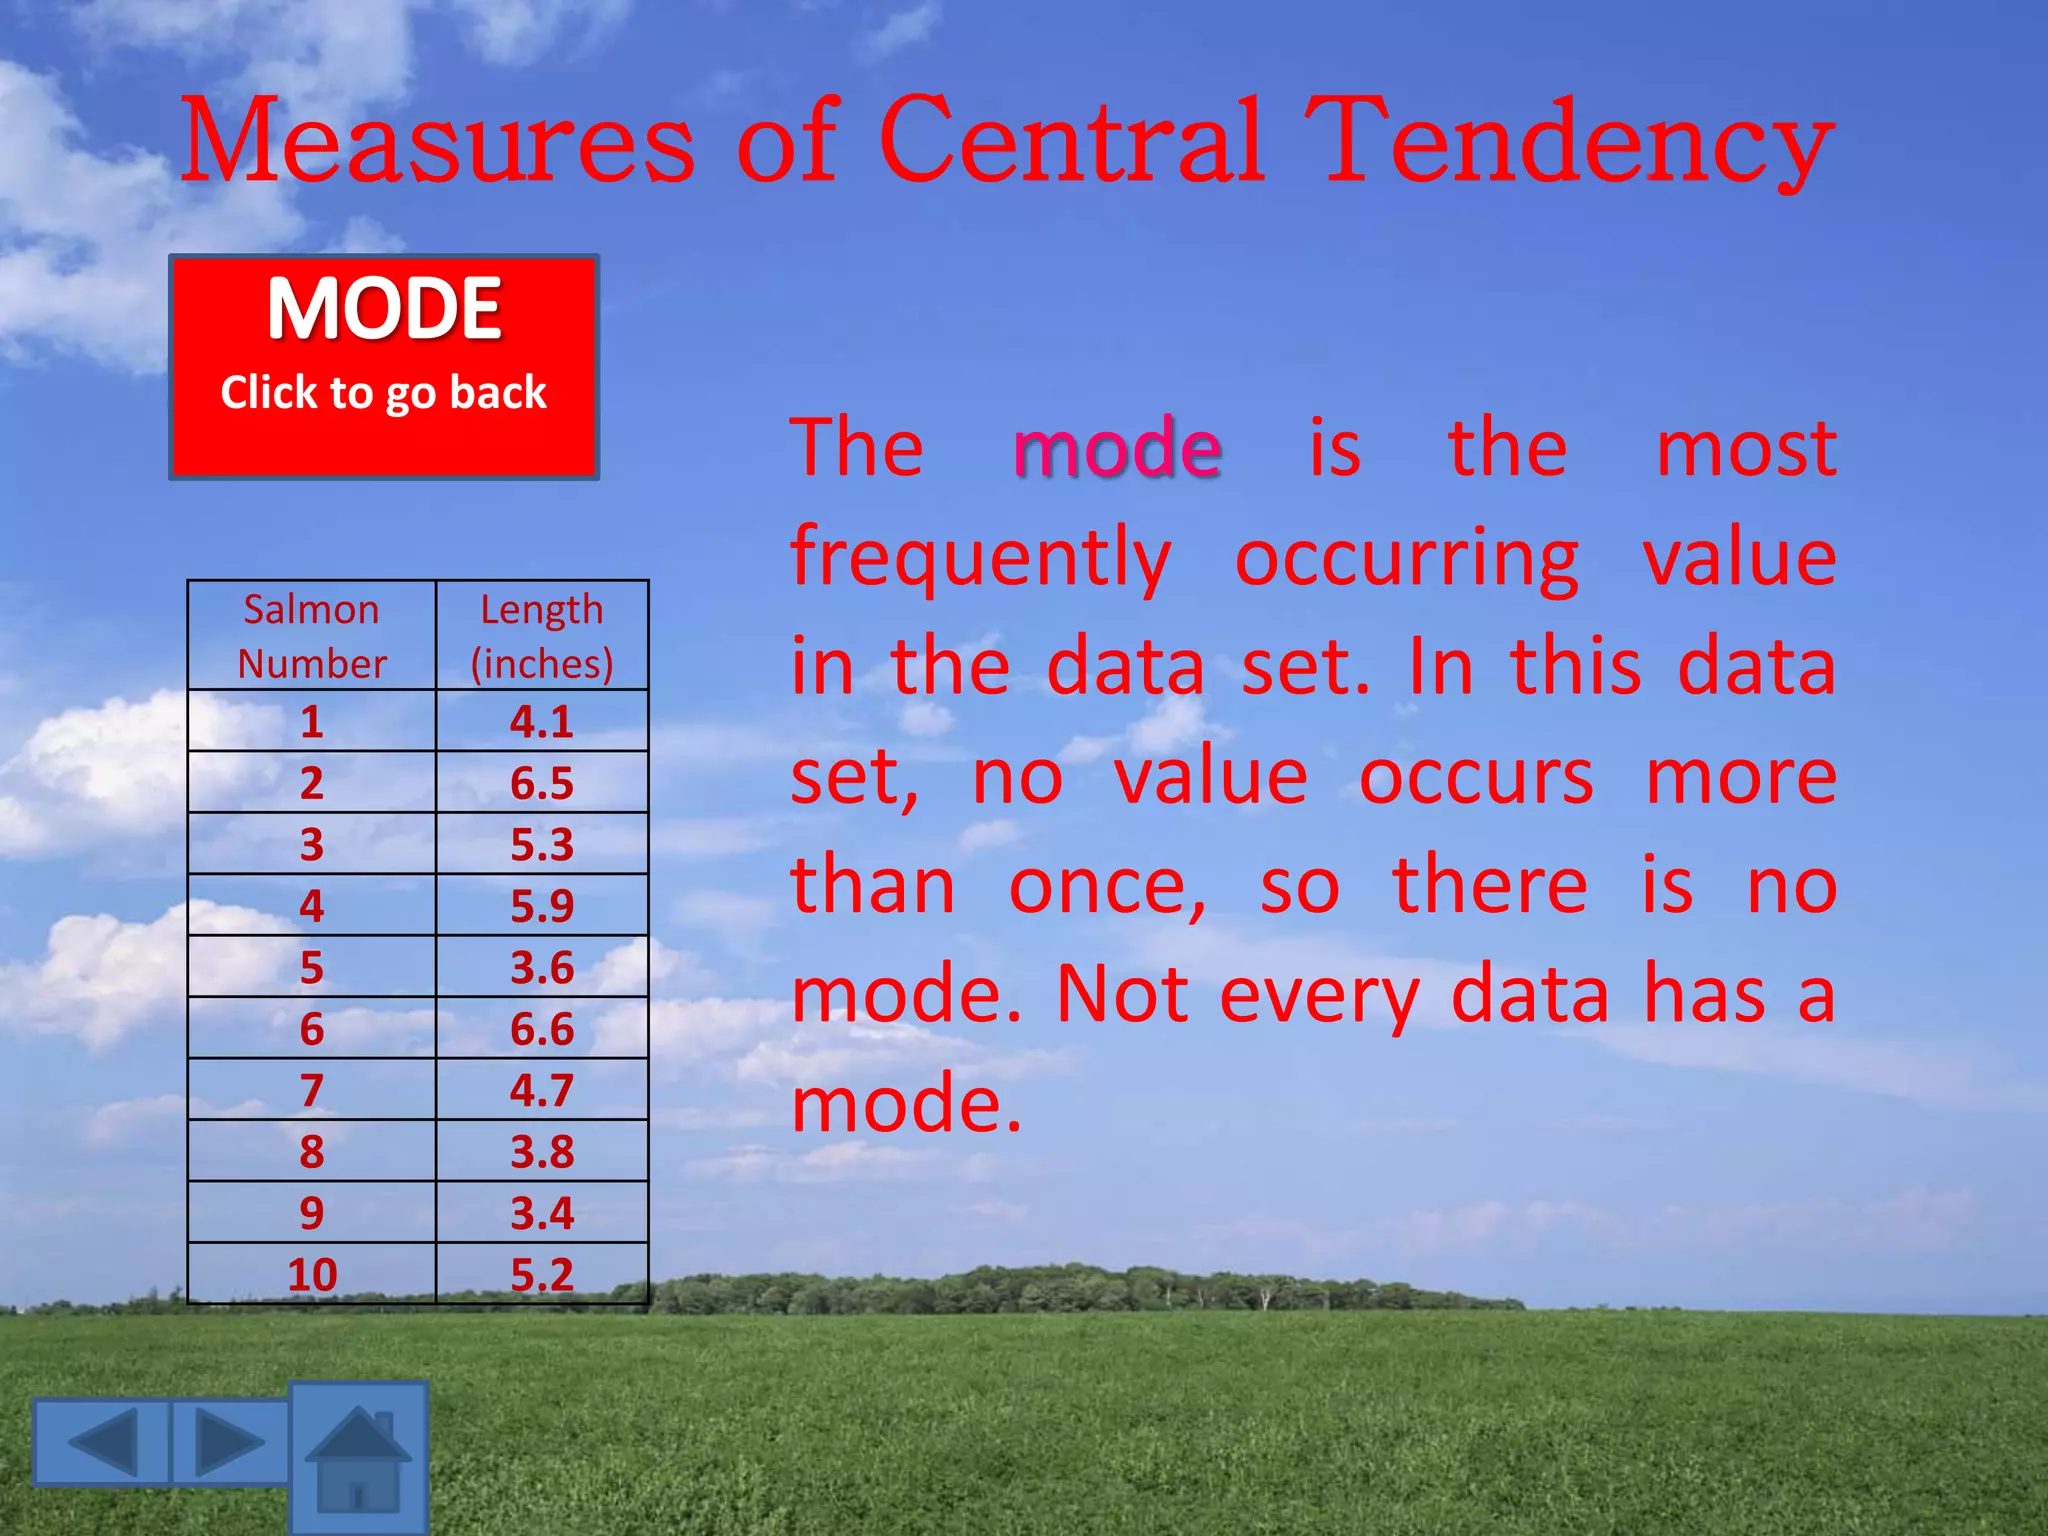
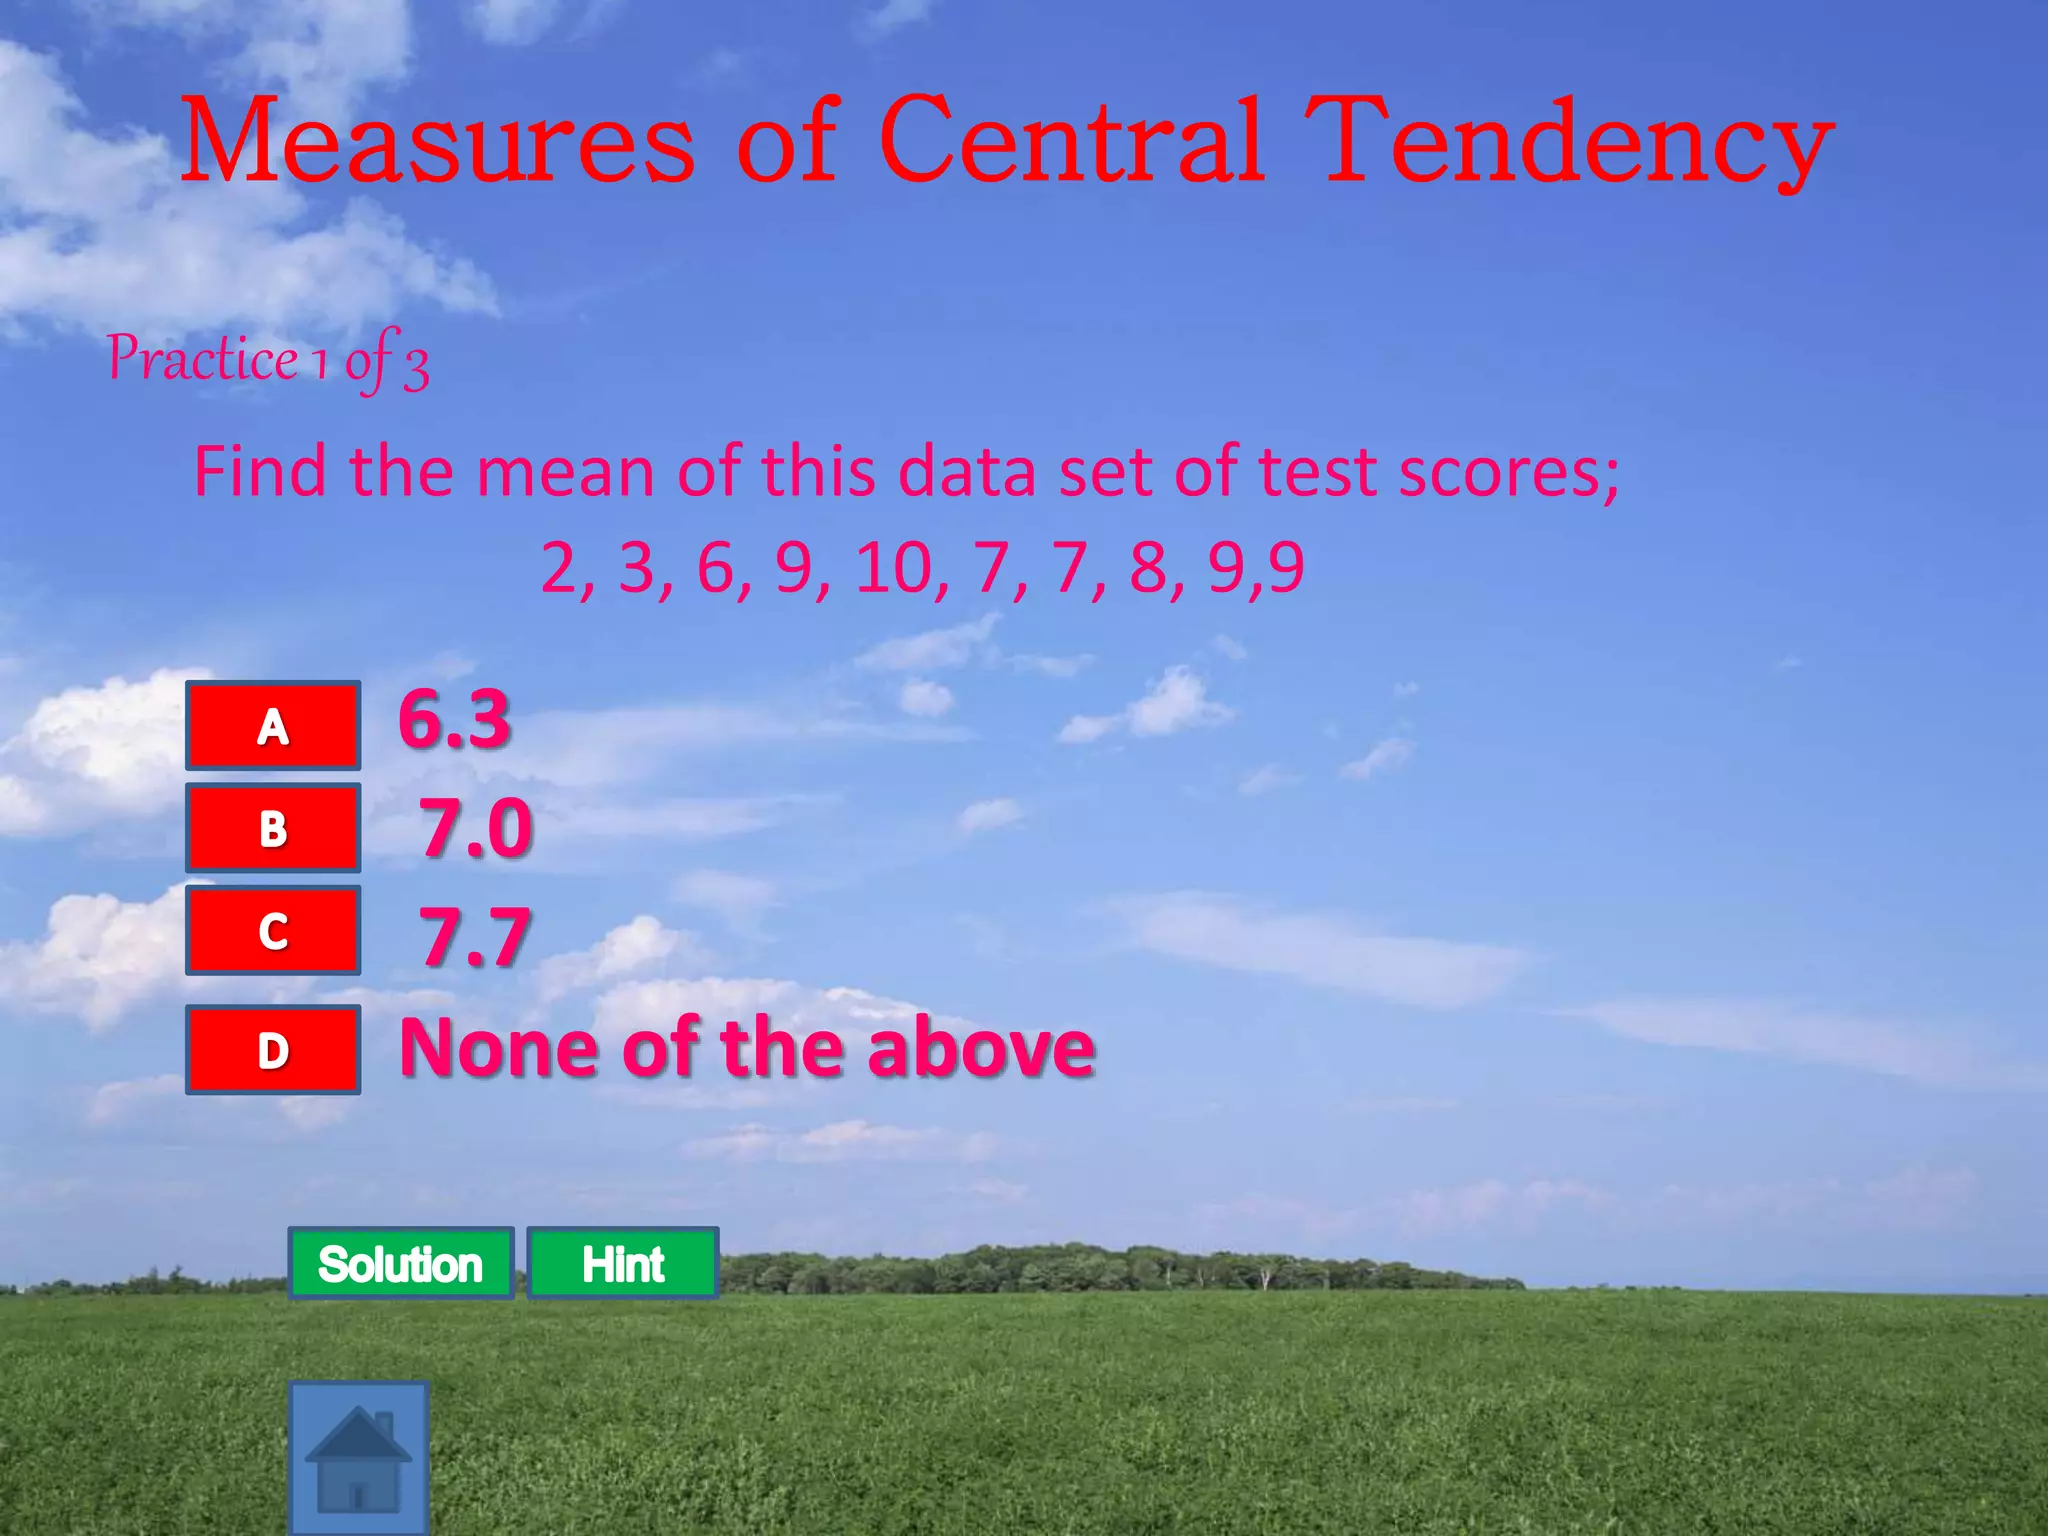
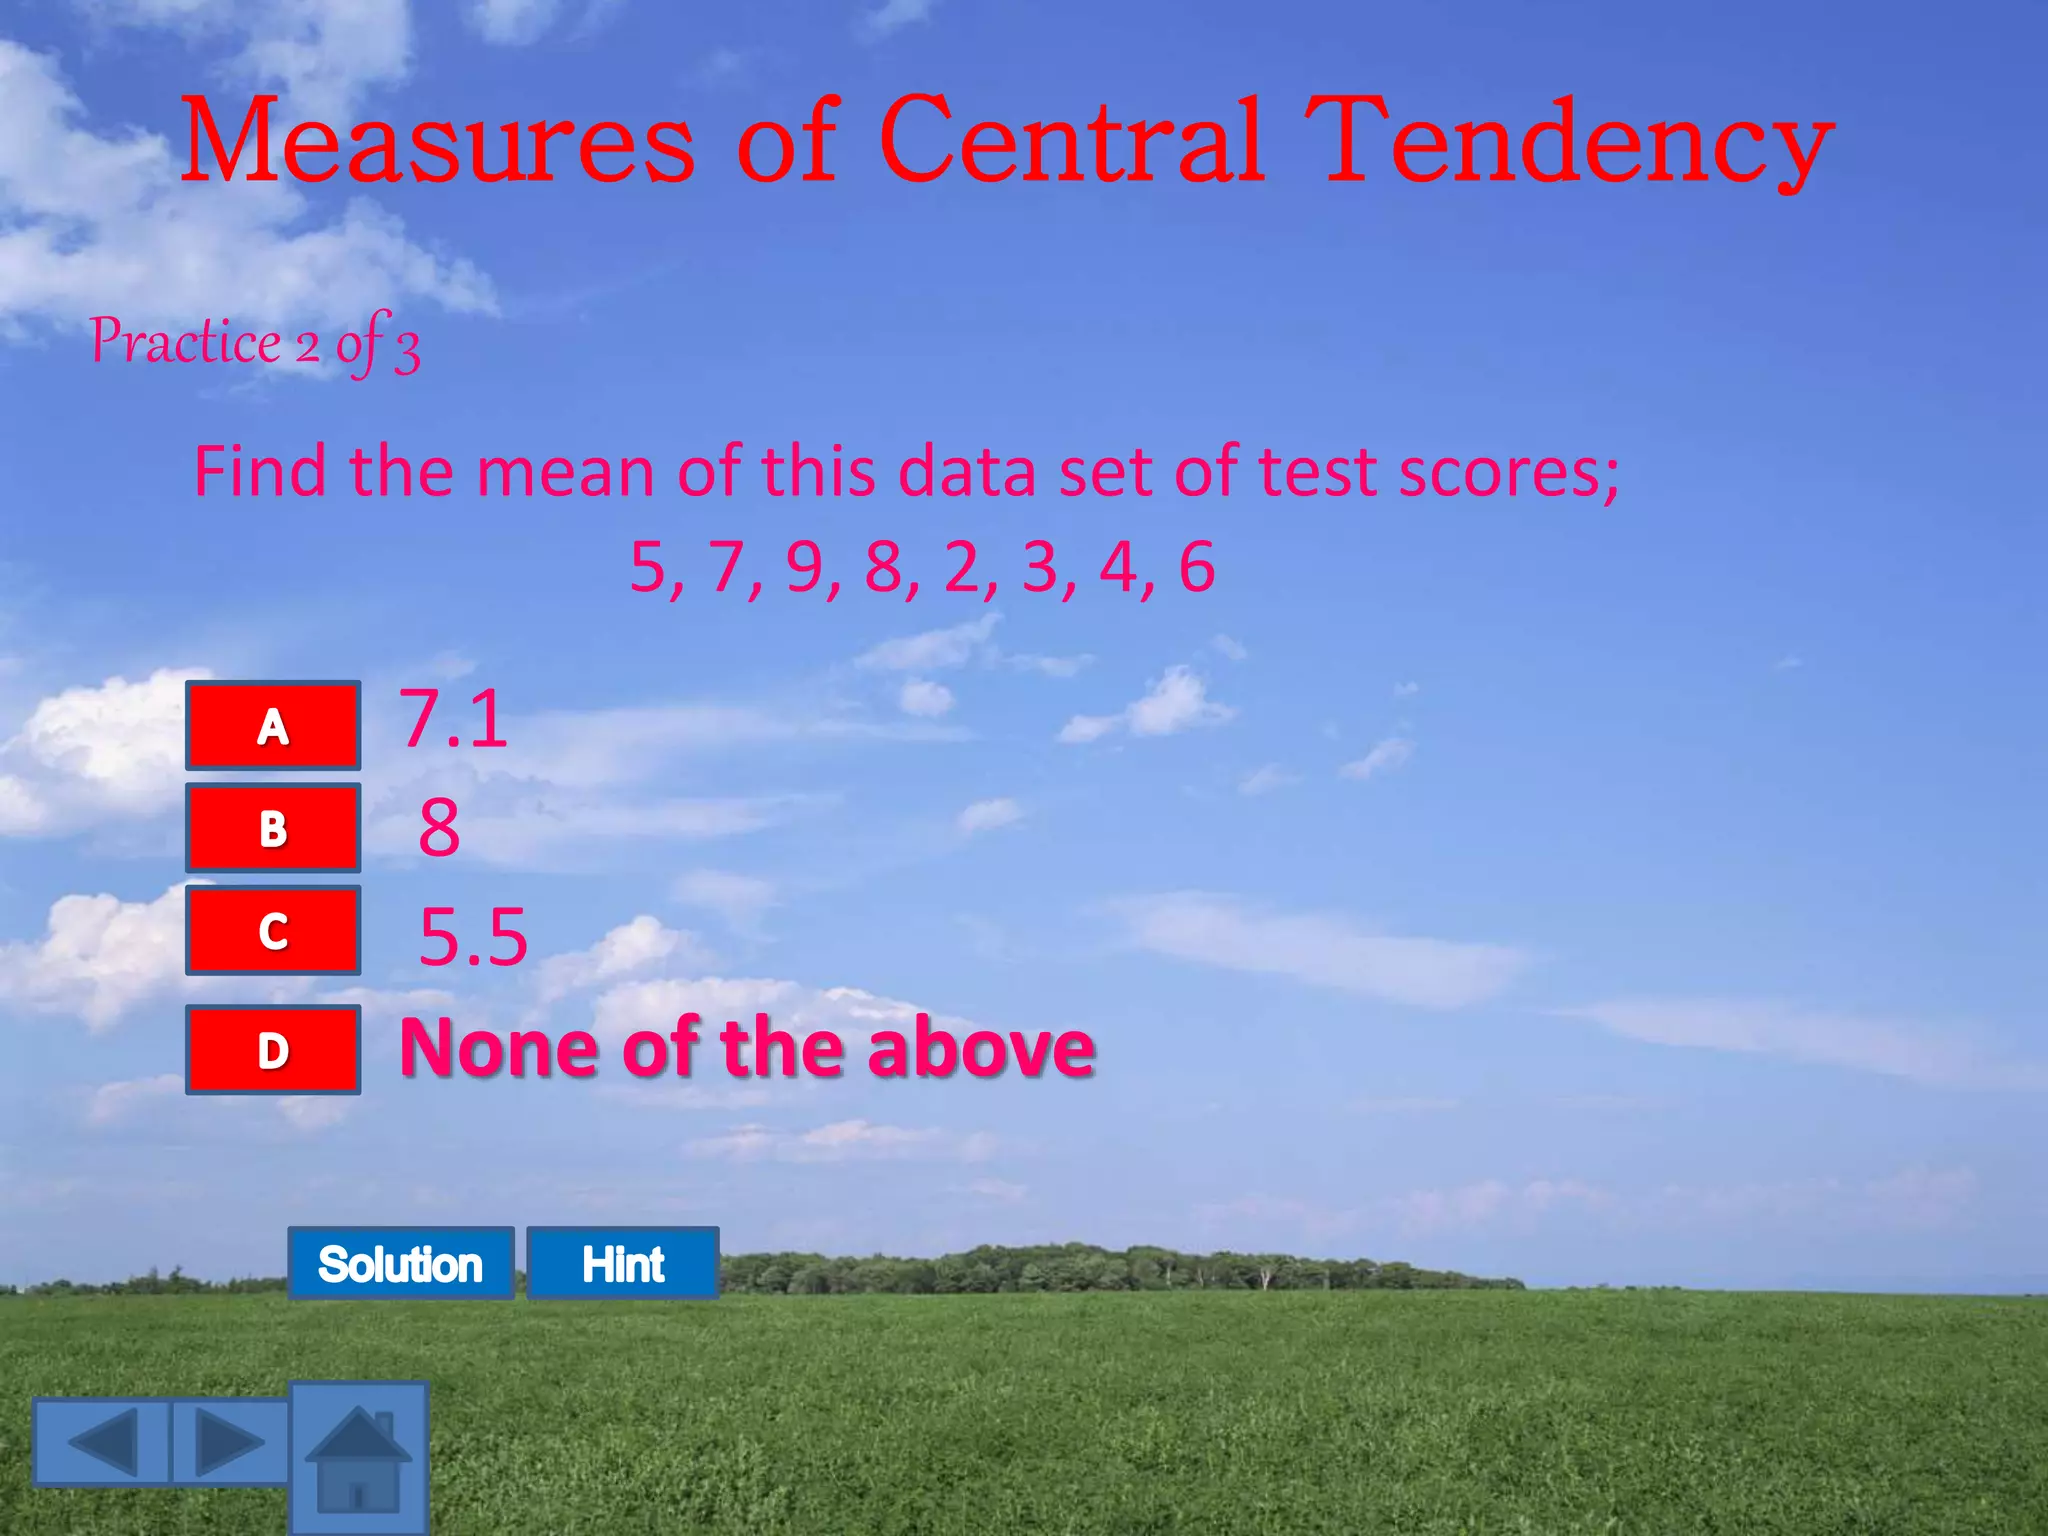
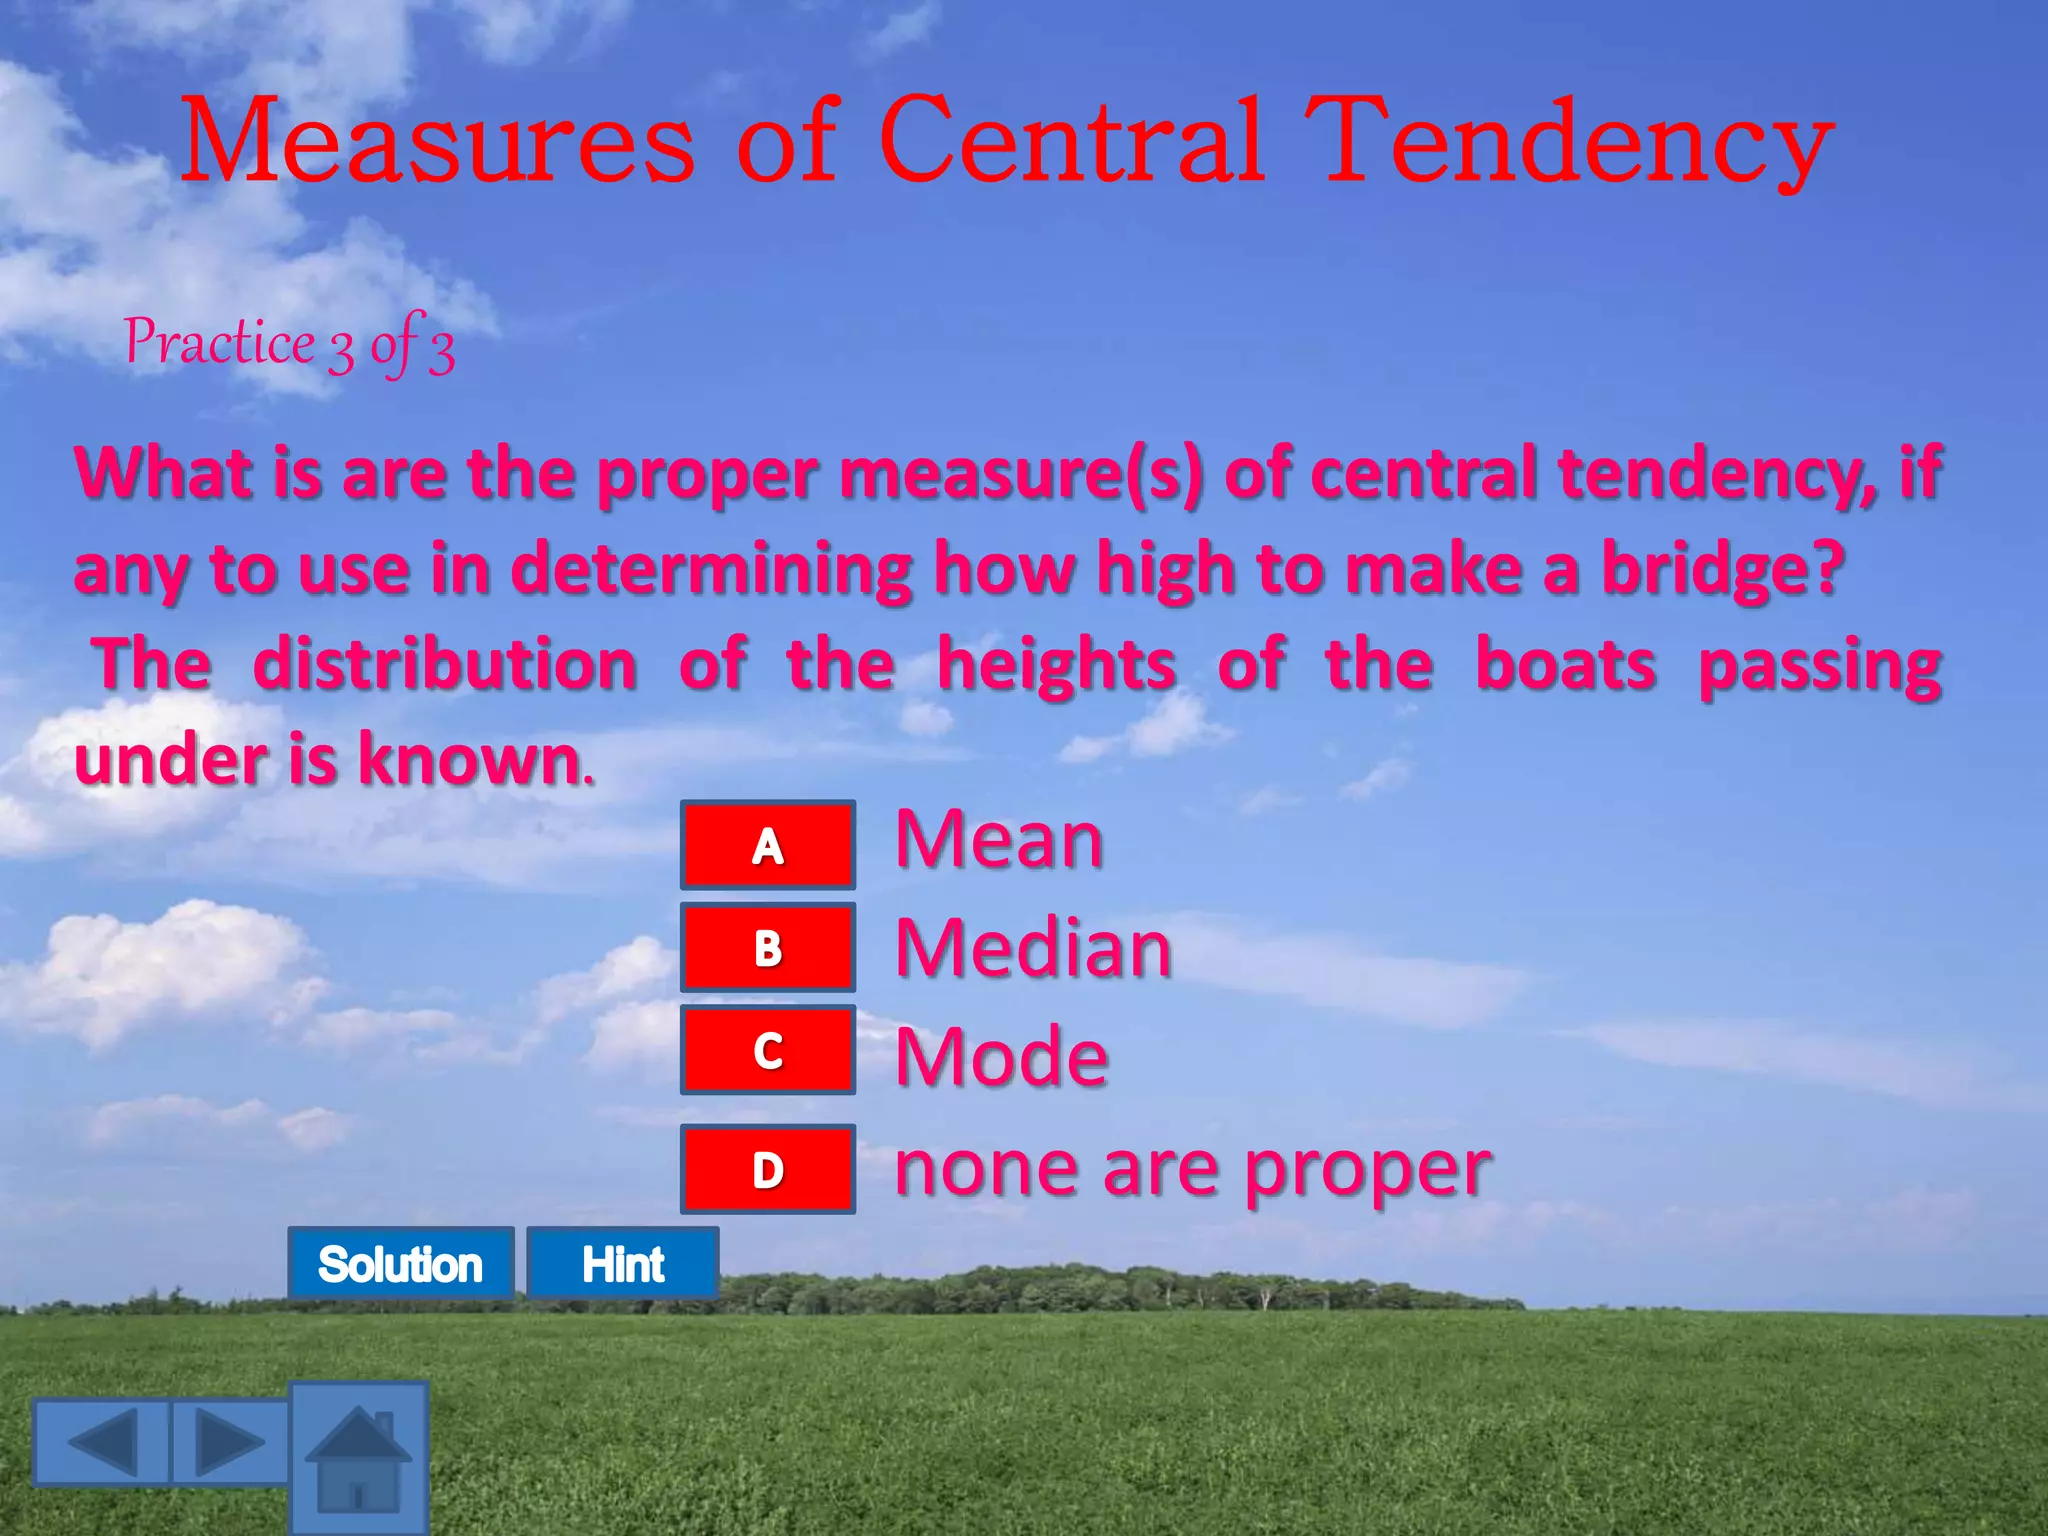
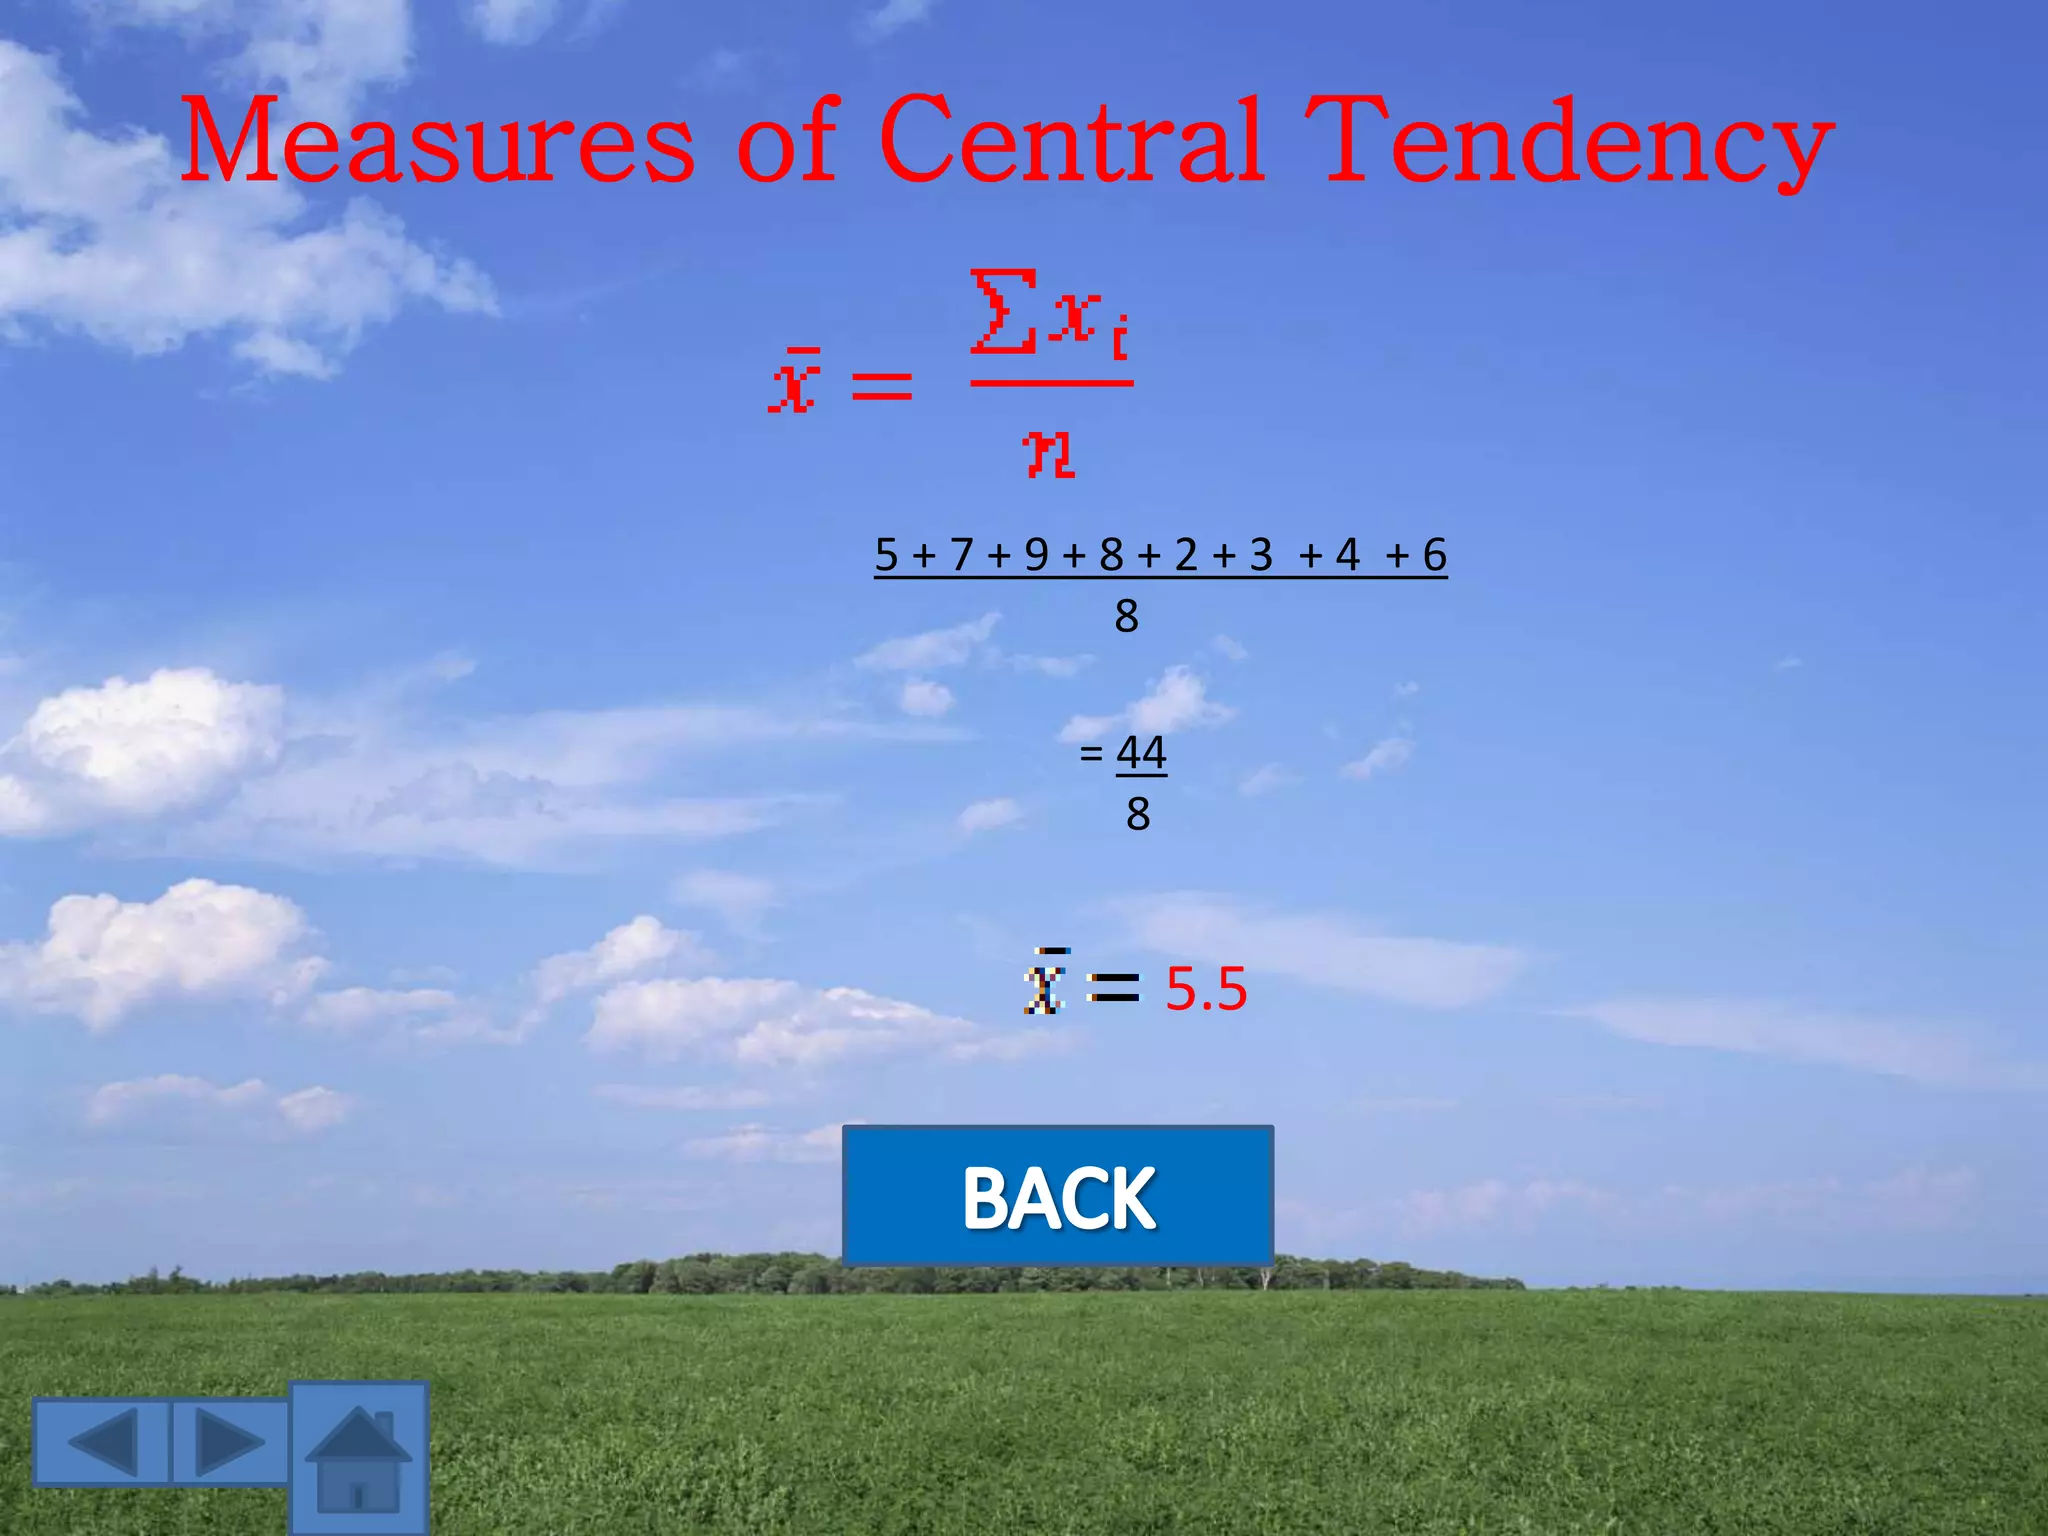


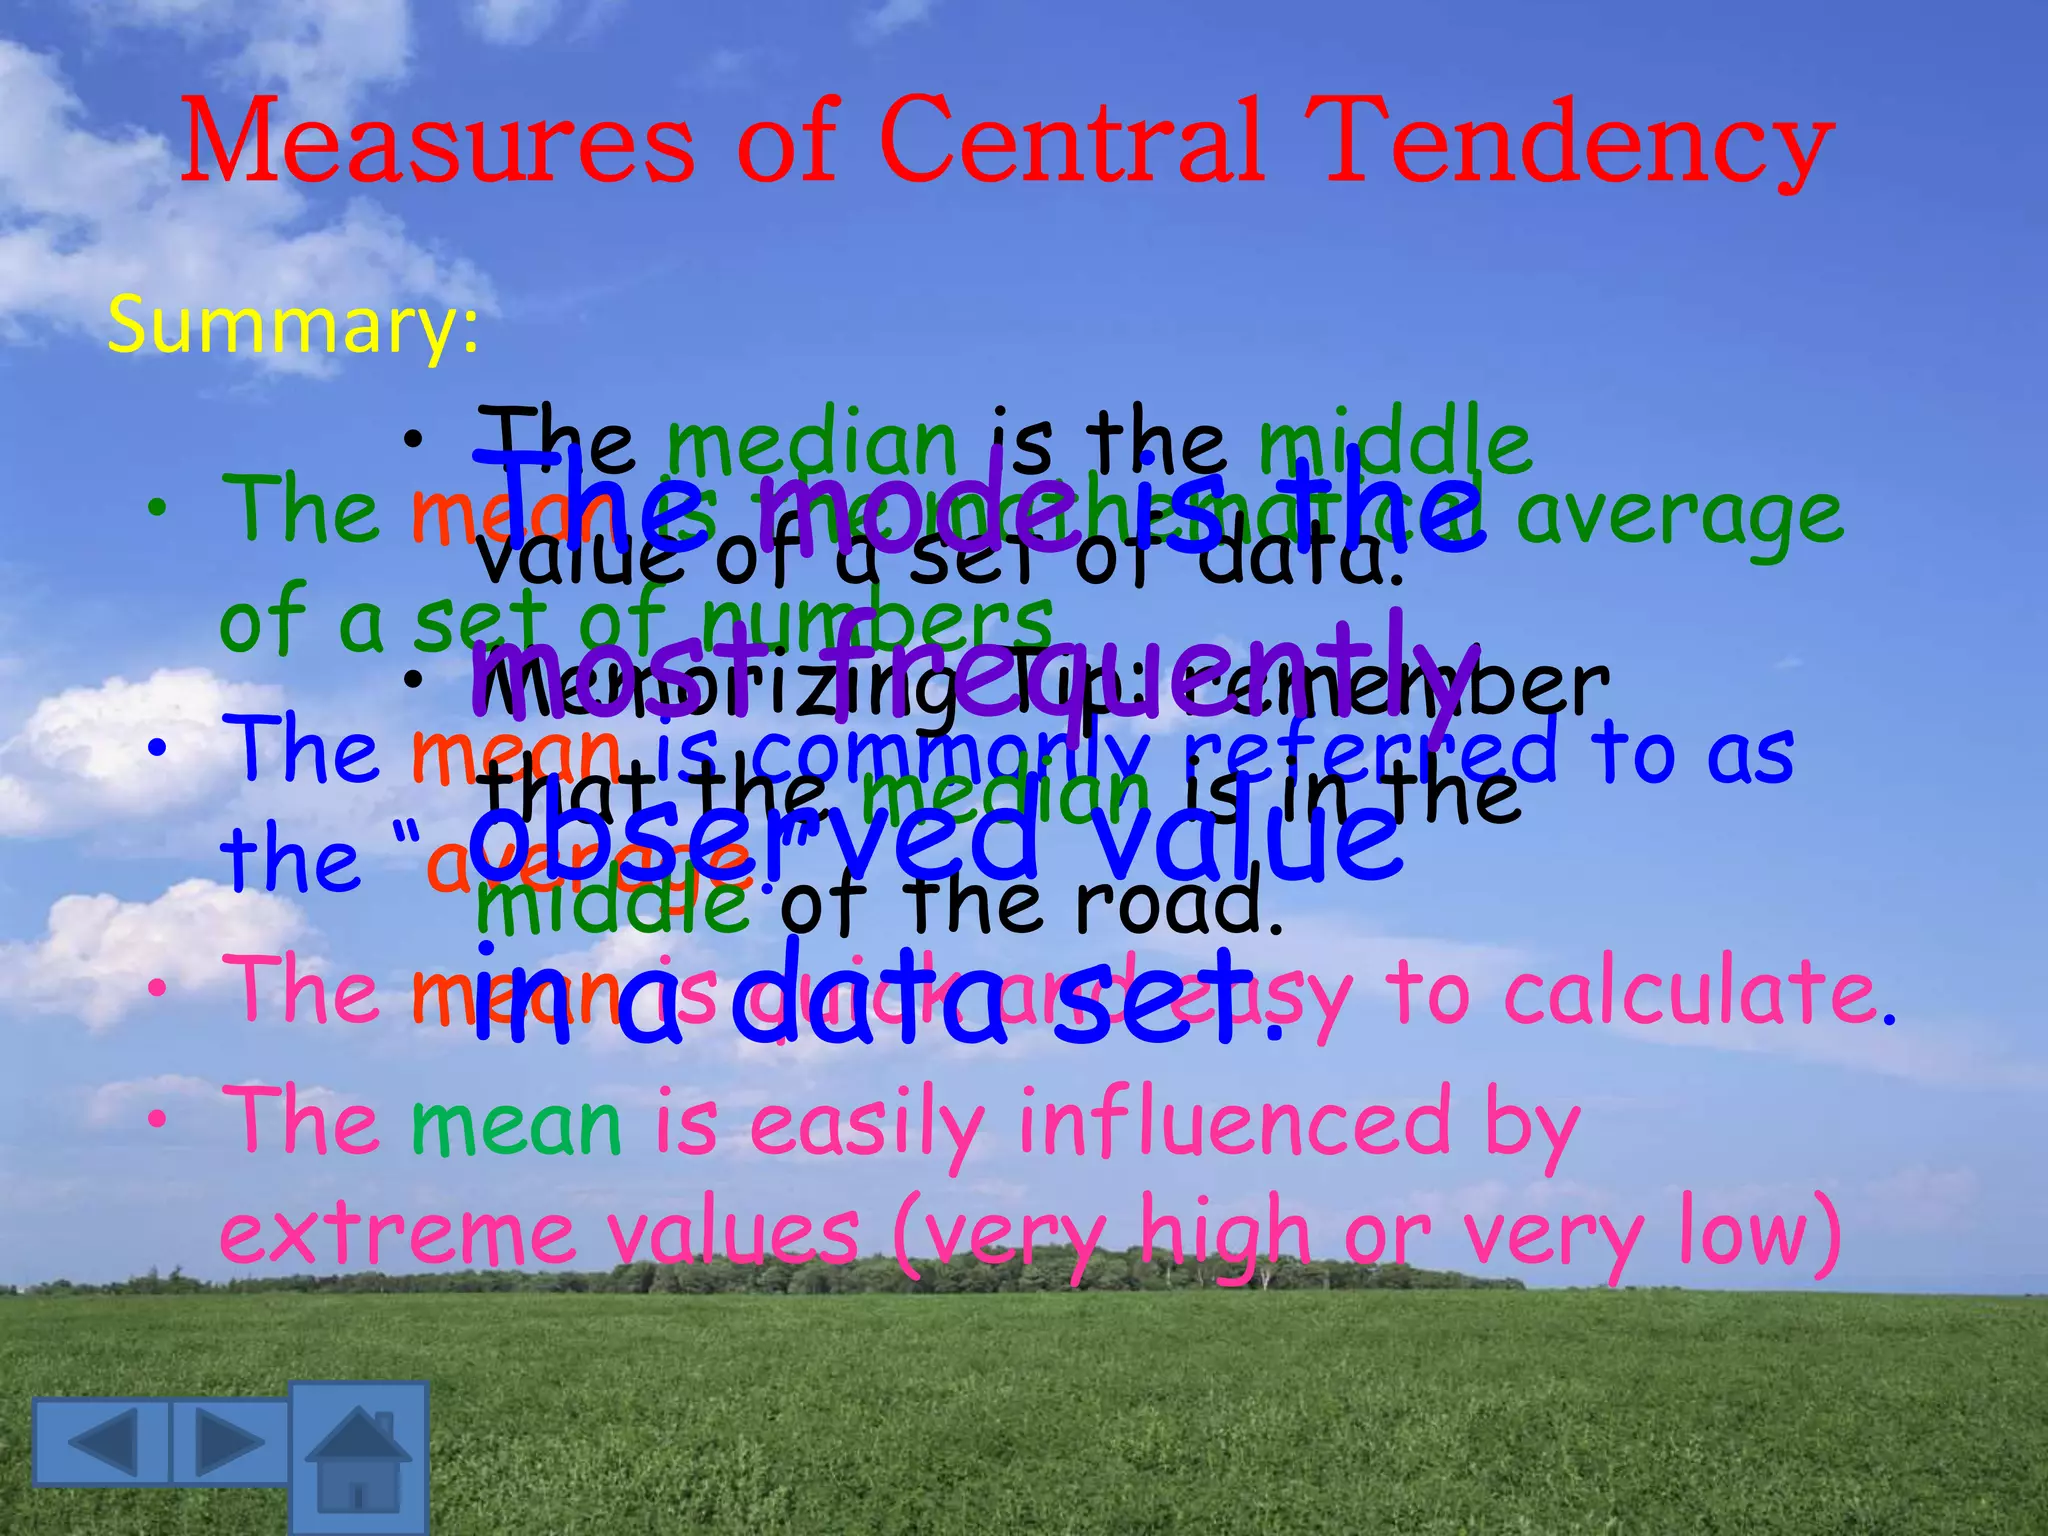
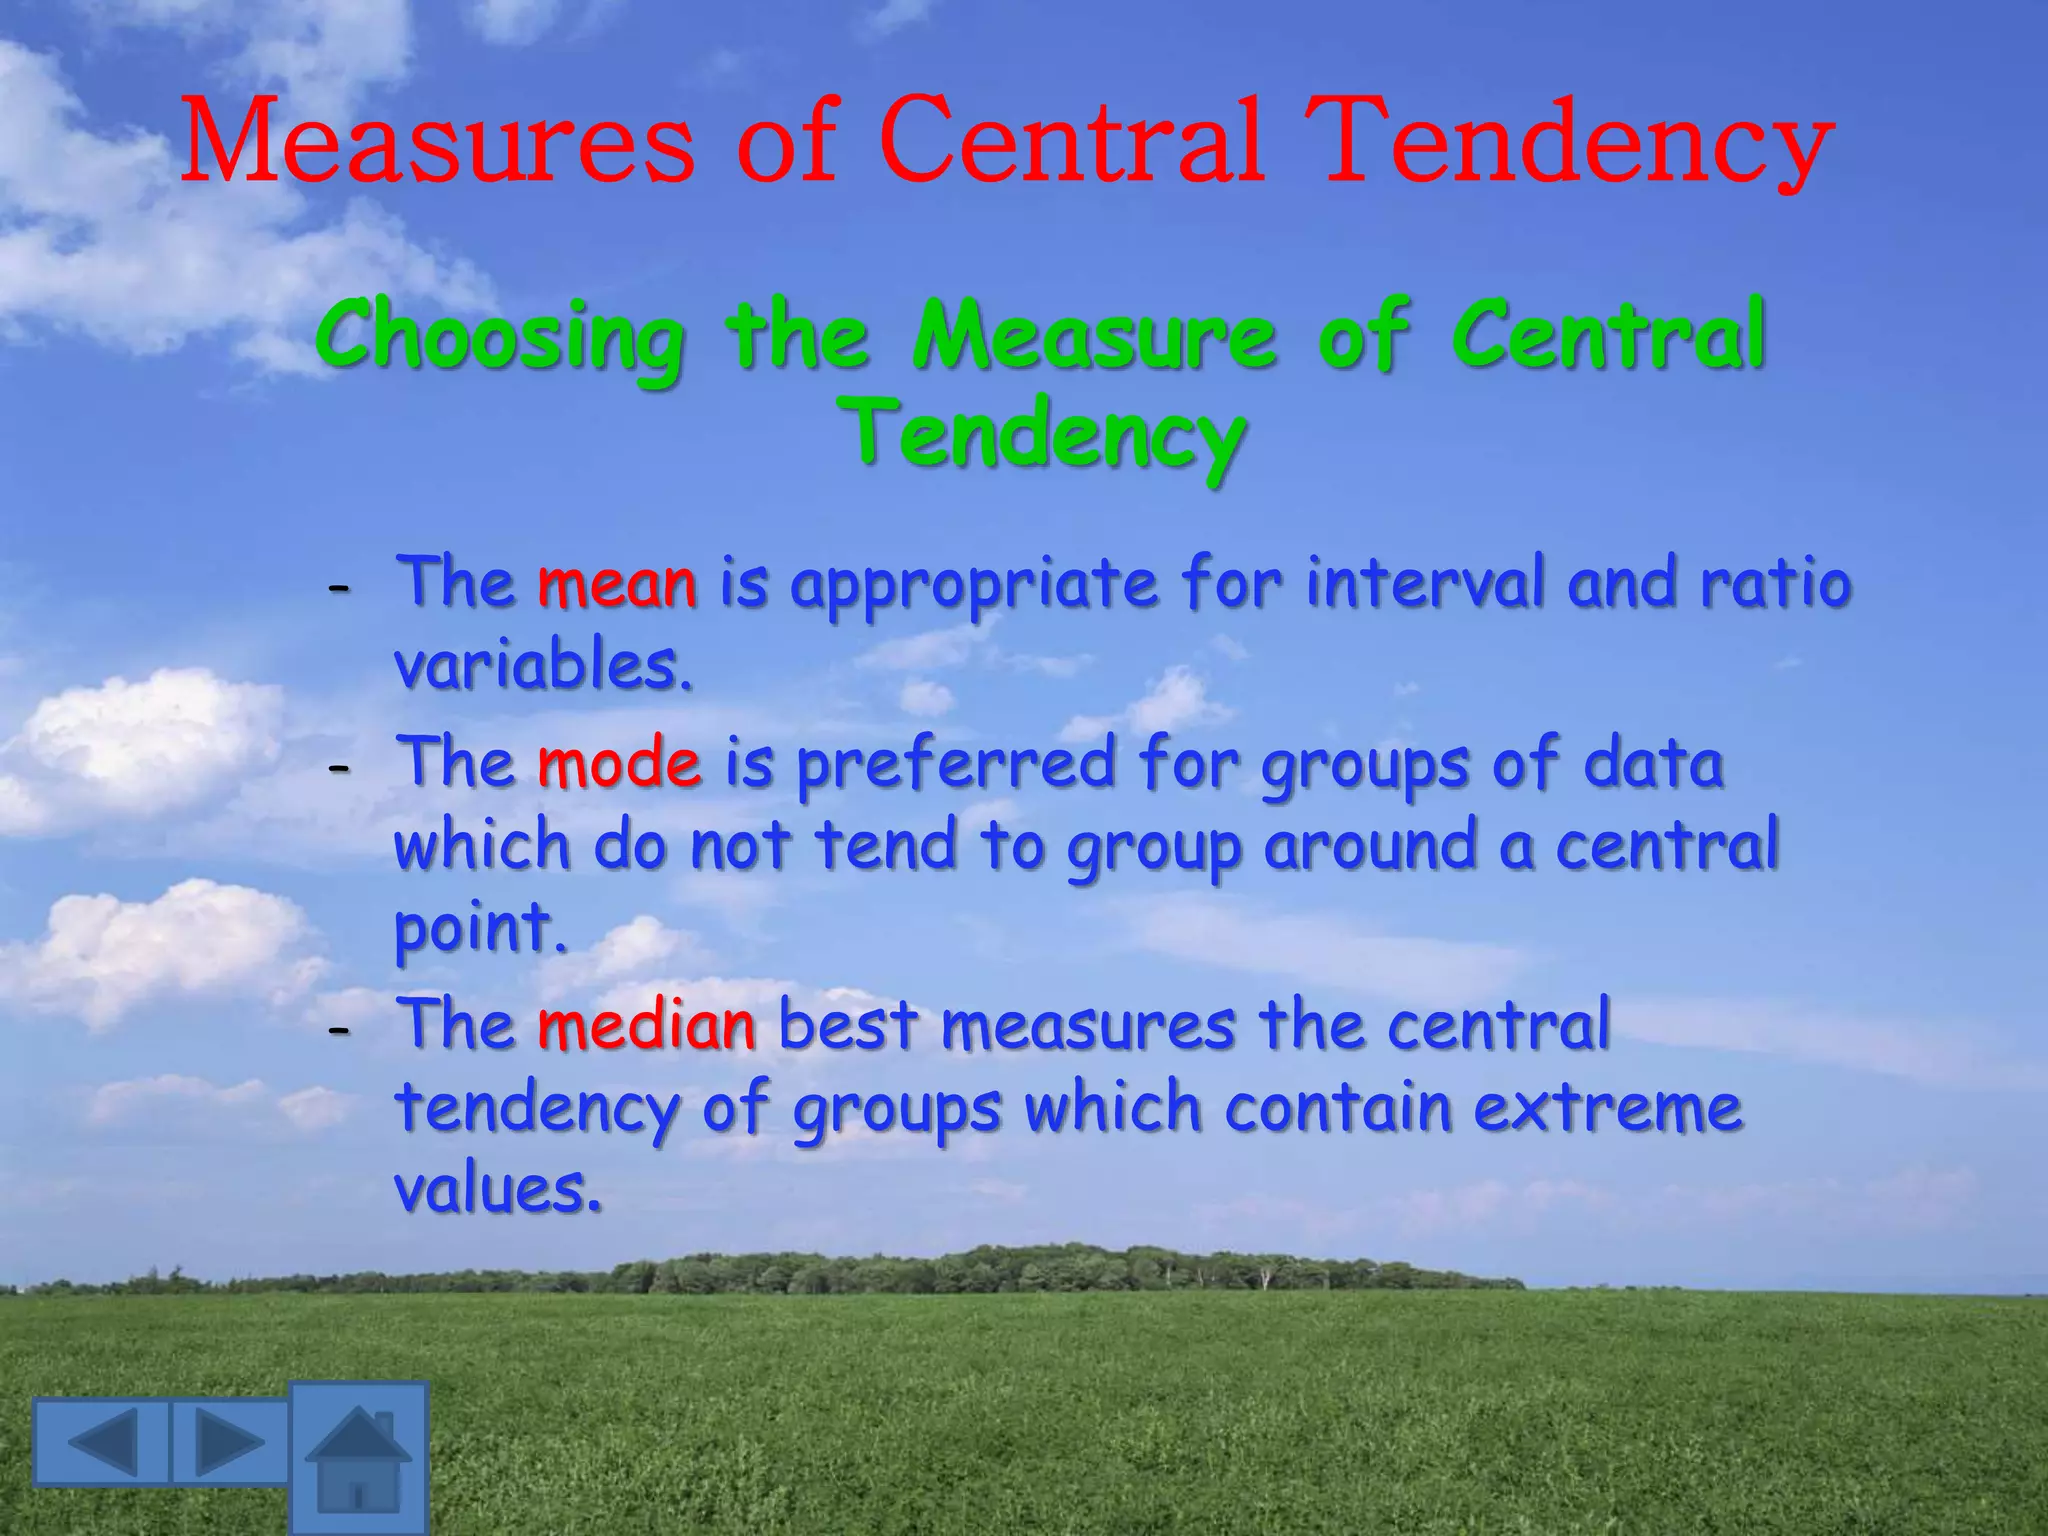

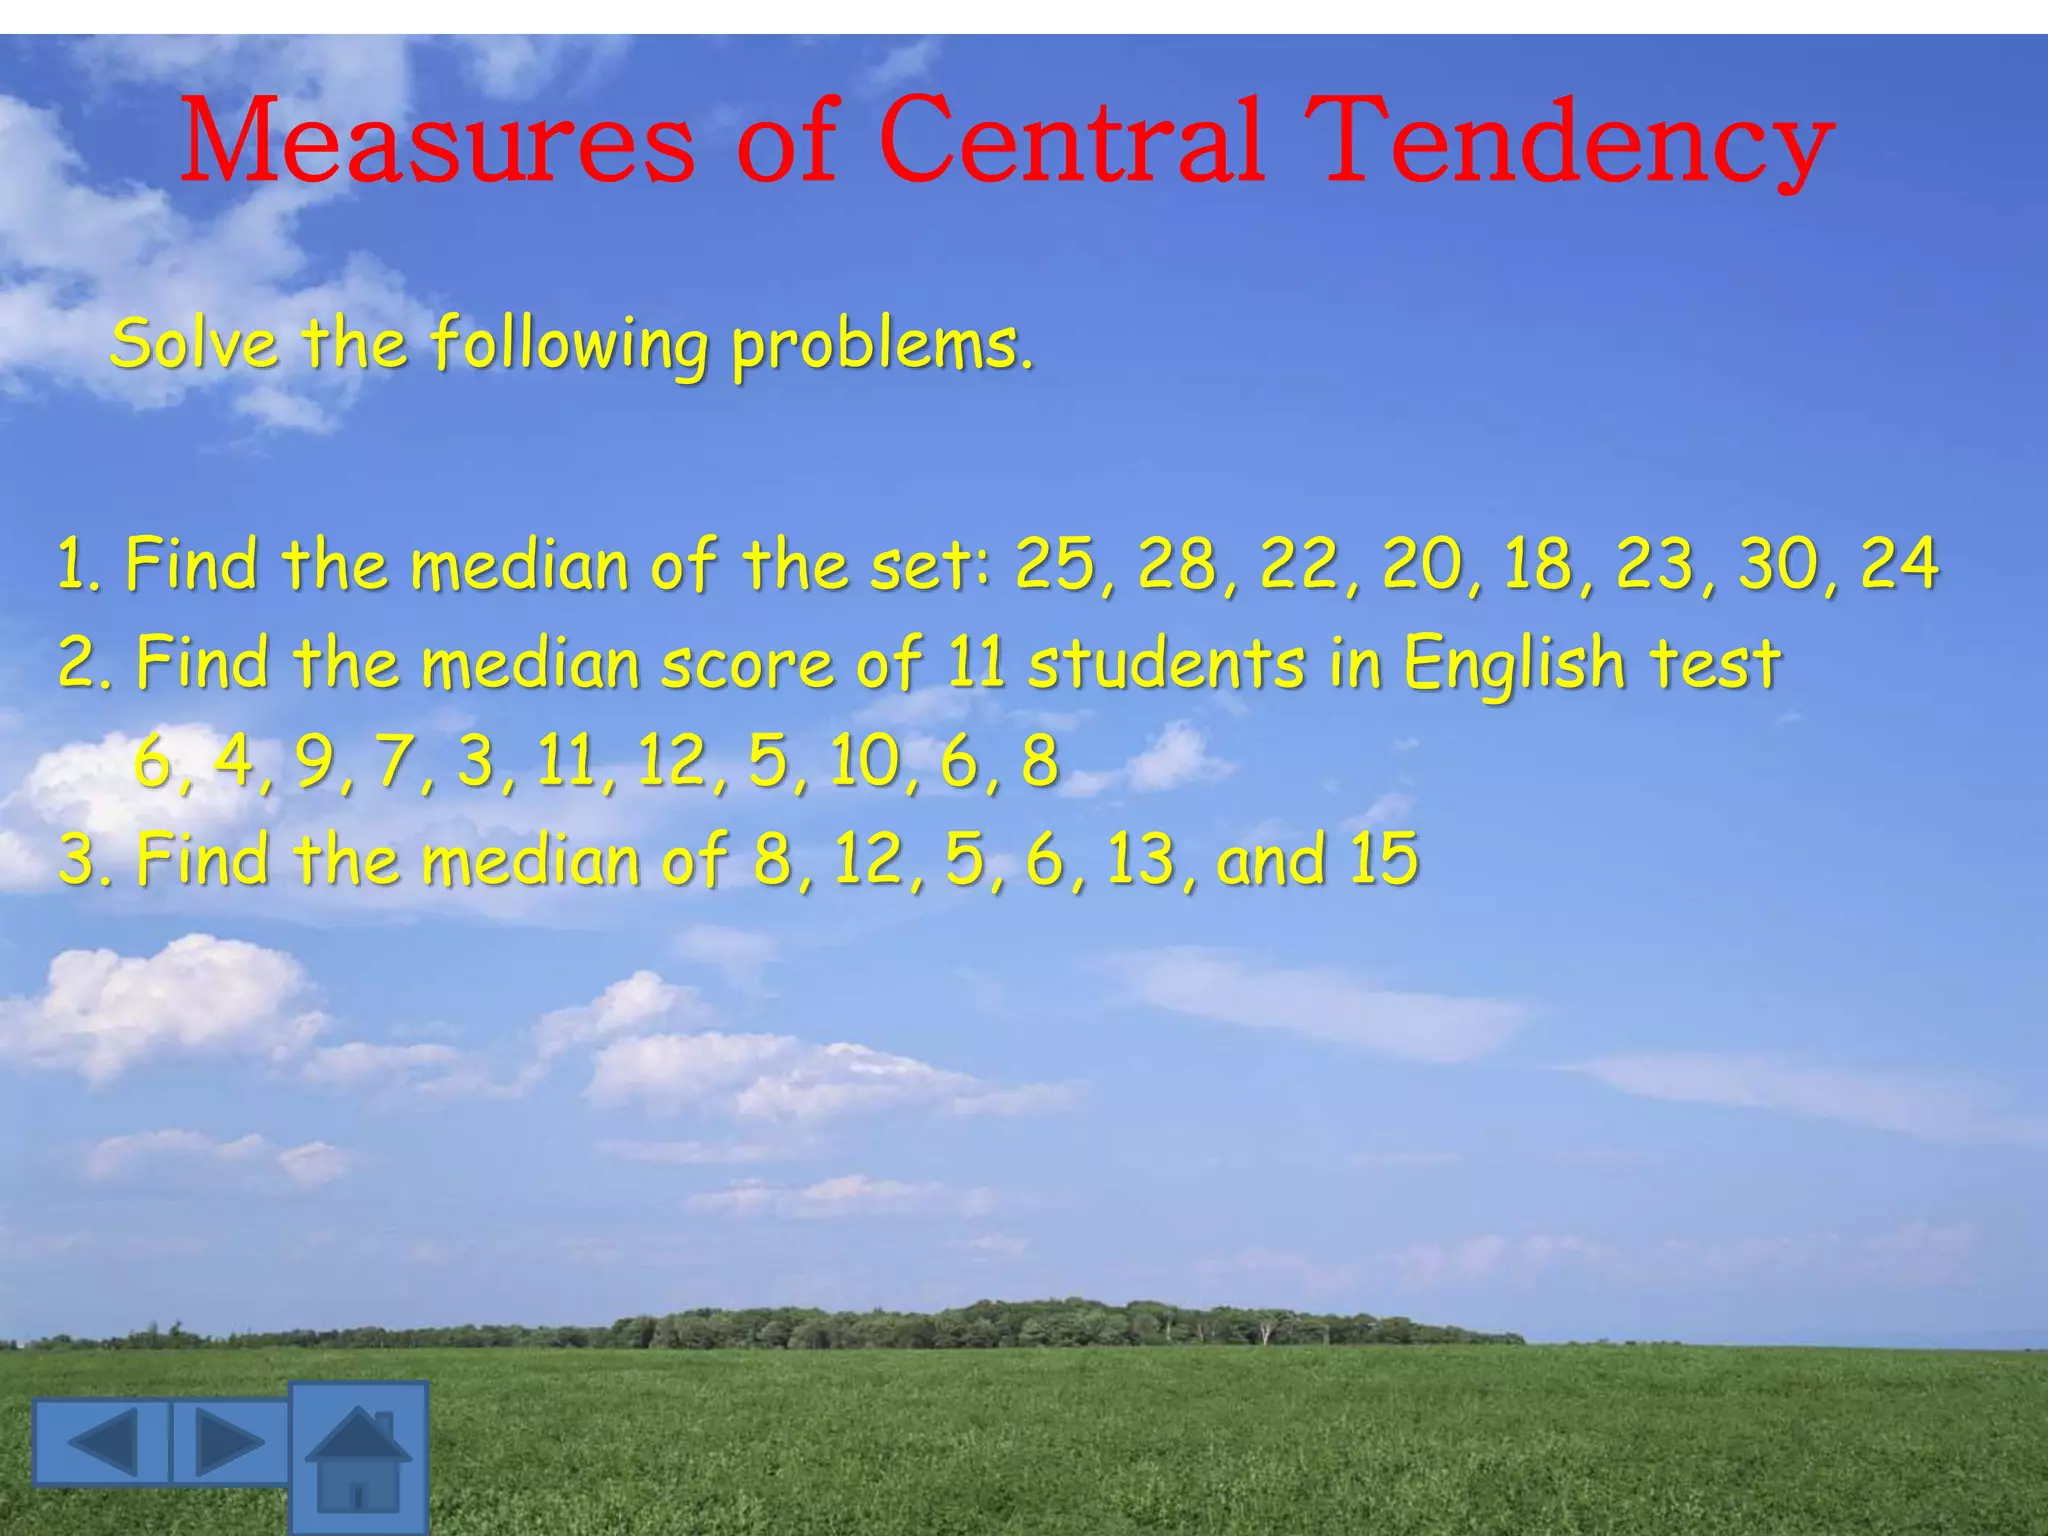
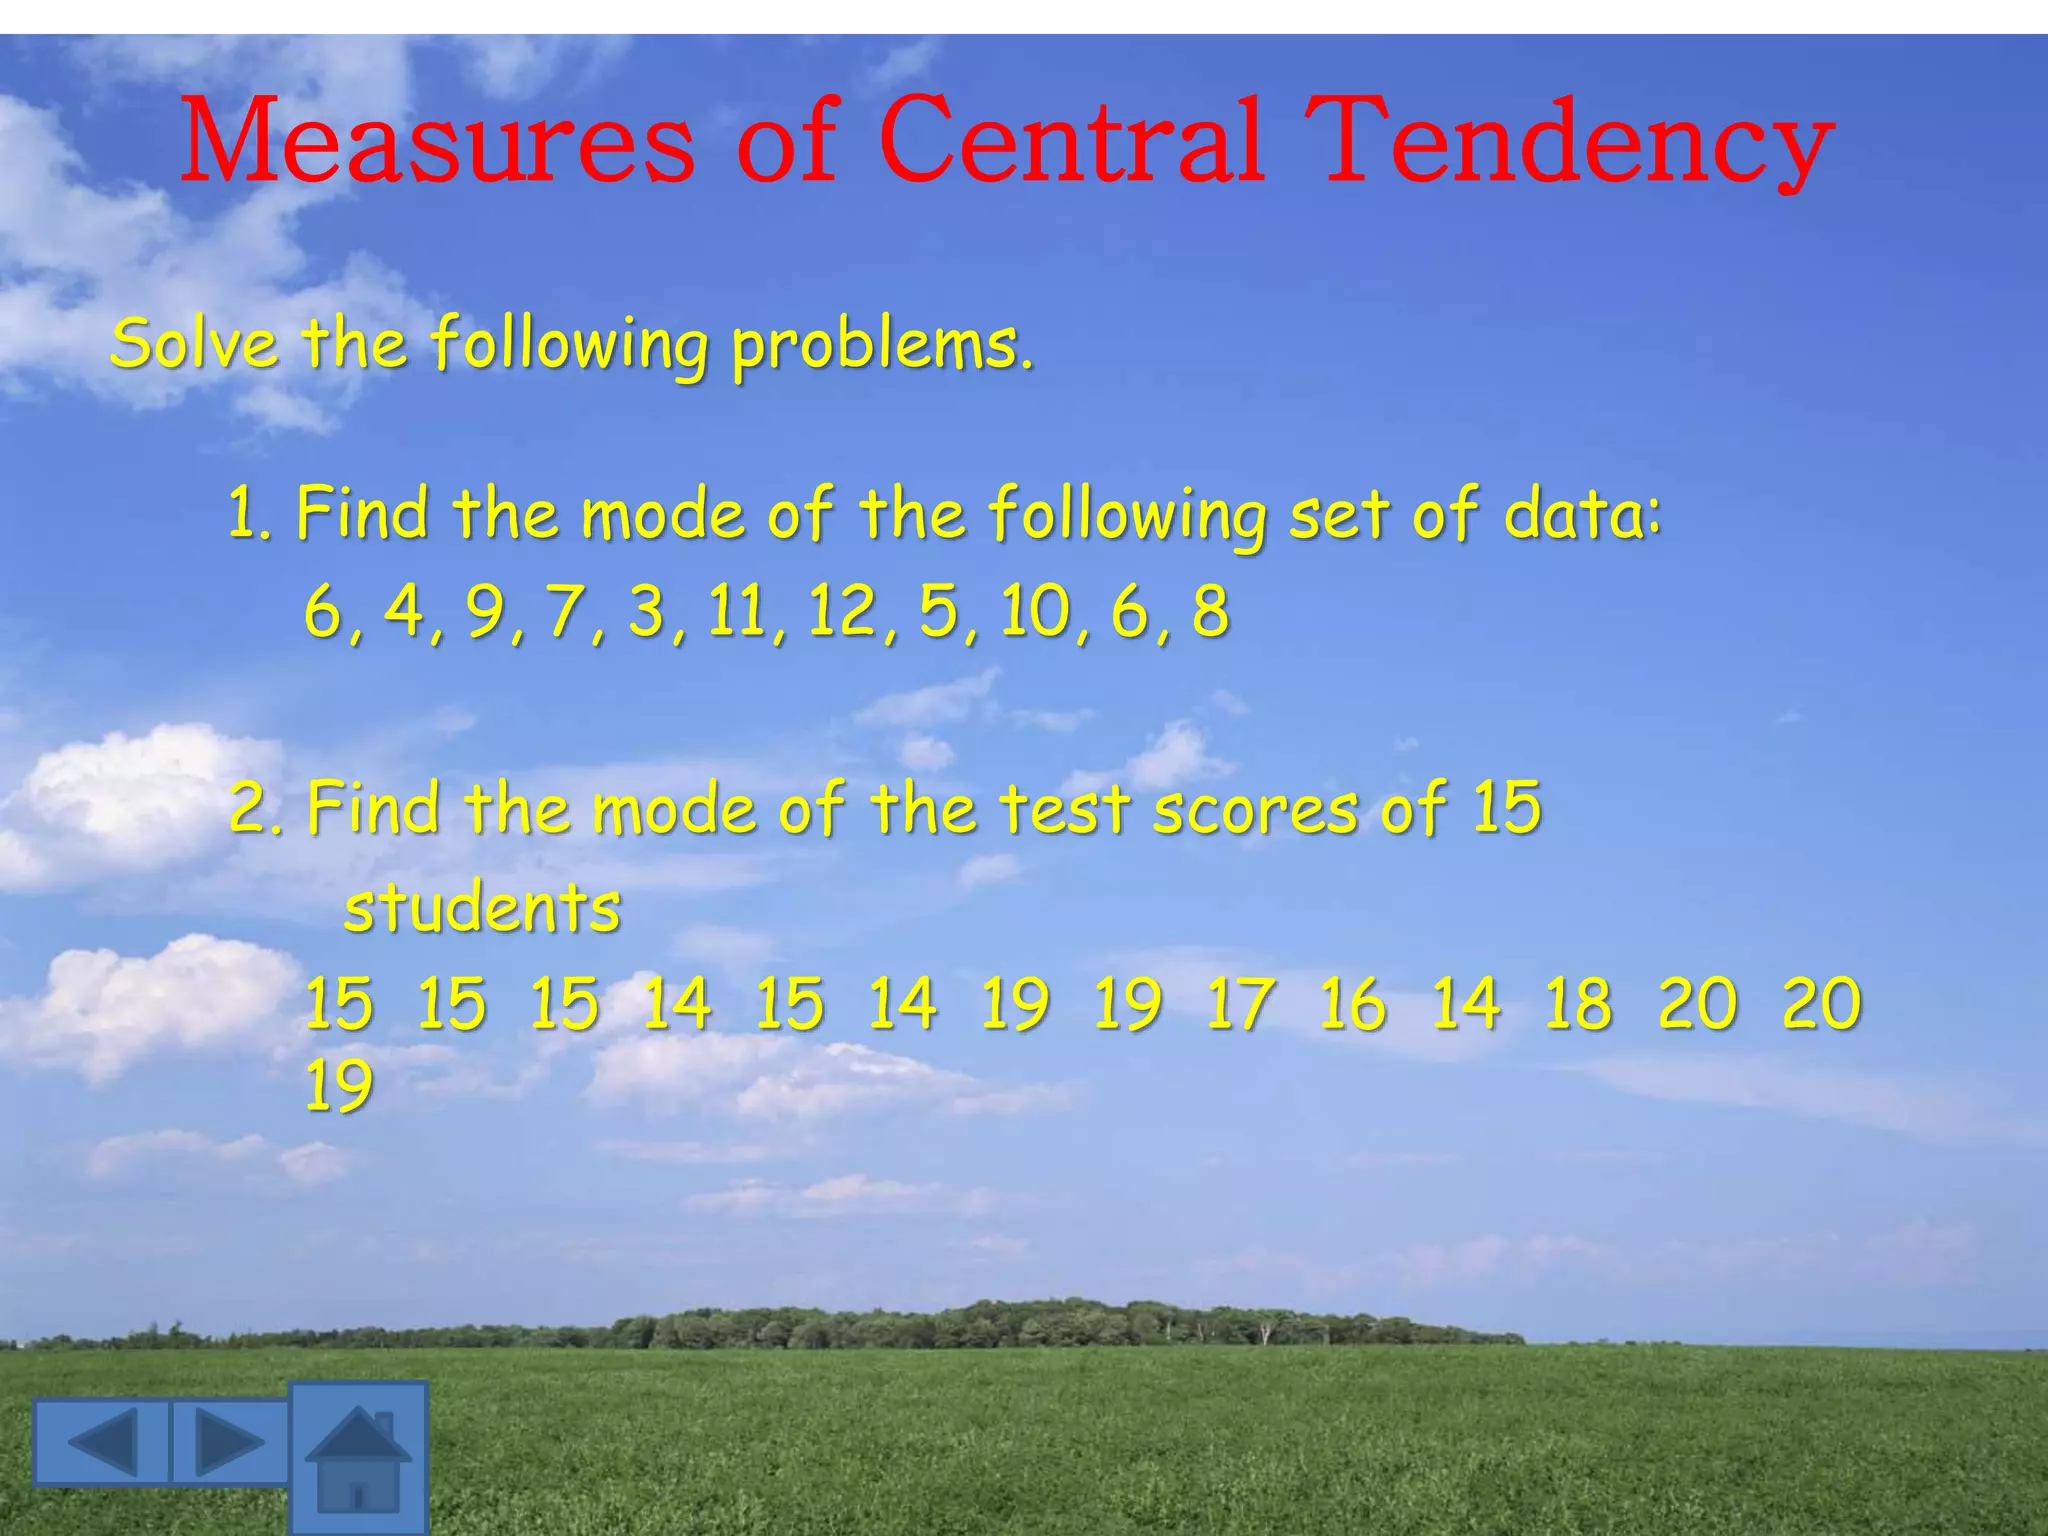

The document discusses different measures of central tendency including the mean, median, and mode. It provides definitions and formulas for calculating each. The mean is the average and is calculated by adding all values and dividing by the total count. The median is the middle value when data is arranged in order. The mode is the most frequently occurring value. Examples are provided to demonstrate calculating and interpreting these measures of central tendency.