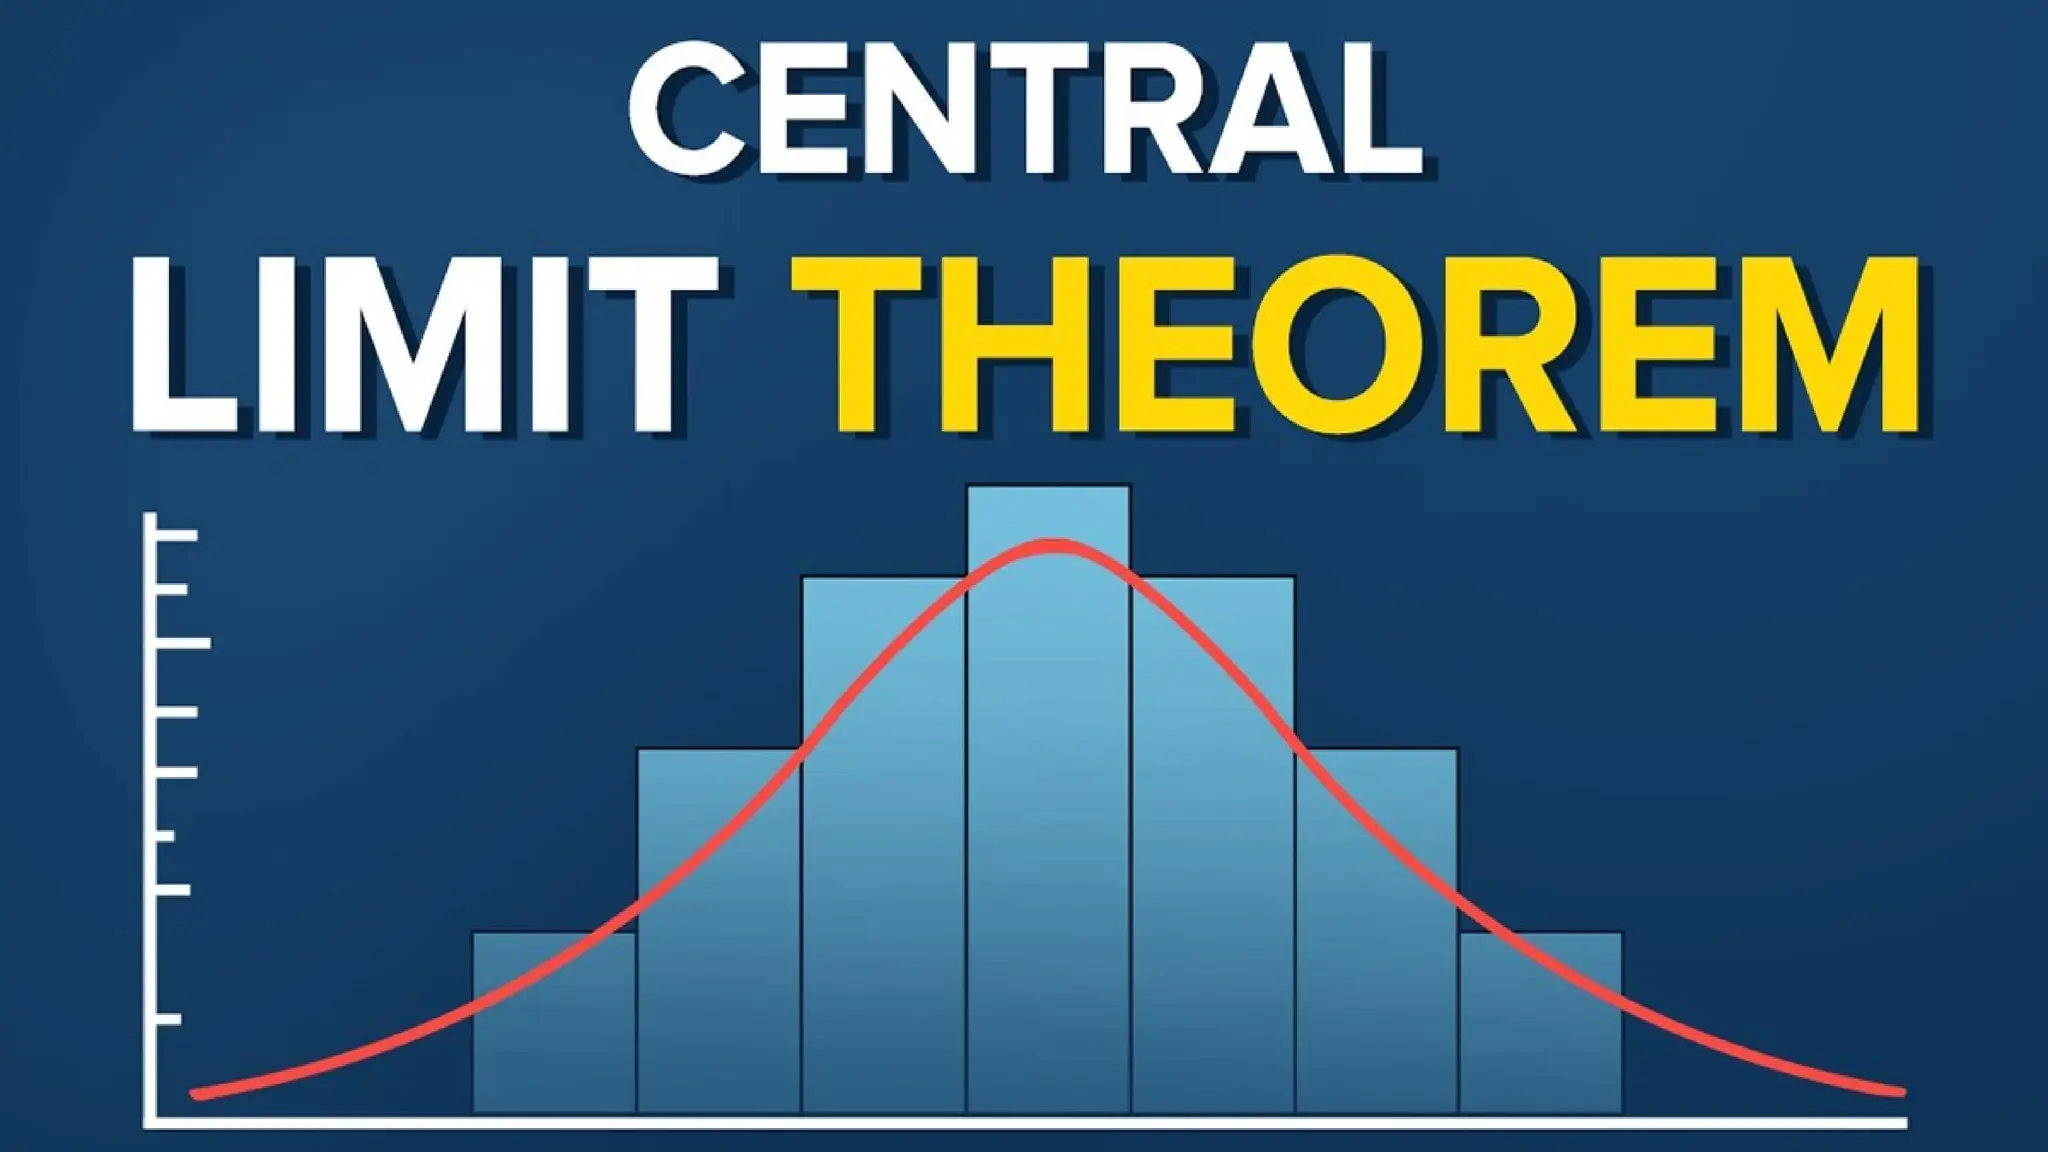
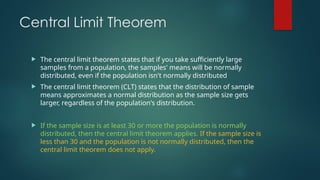
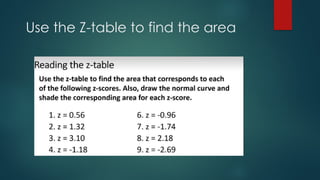
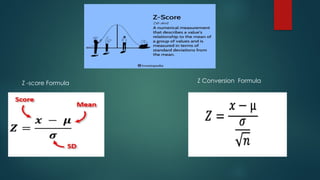
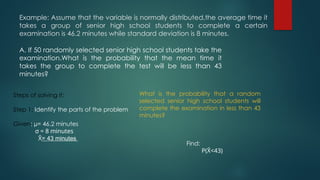
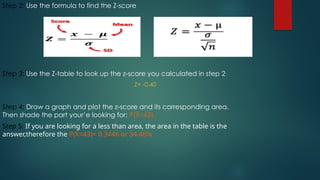
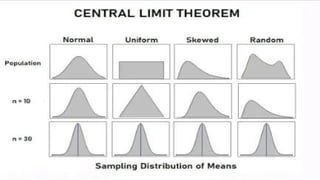
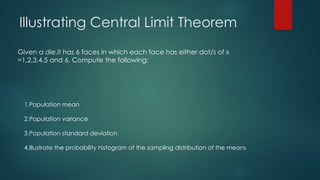
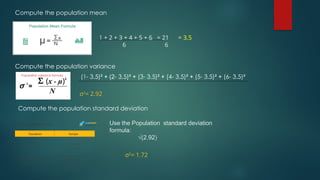
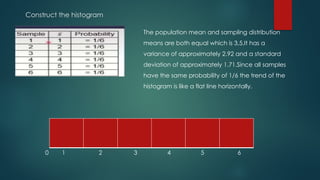
Central Limit Theorem
 The central limit theorem states that if you take sufficiently large
samples from a population, the samples' means will be normally
distributed, even if the population isn't normally distributed
 The central limit theorem (CLT) states that the distribution of sample
means approximates a normal distribution as the sample size gets
larger, regardless of the population's distribution.
 If the sample size is at least 30 or more the population is normally
distributed, then the central limit theorem applies. If the sample size is
less than 30 and the population is not normally distributed, then the
central limit theorem does not apply.
Standard normal Distribution
The standard deviation is the measure of
how spread out a normally distributed
set of data is.
Use the Z-table to find the area
Z -score Formula Z Conversion Formula
Example: Assume that the variable is normally distributed,the average time it
takes a group of senior high school students to complete a certain
examination is 46.2 minutes while standard deviation is 8 minutes.
A. If 50 randomly selected senior high school students take the
examination.What is the probability that the mean time it
takes the group to complete the test will be less than 43
minutes?
Steps of solving it:
Step 1: Identify the parts of the problem
Given: µ= 46.2 minutes
σ = 8 minutes
X
̄ = 43 minutes
What is the probability that a random
selected senior high school students will
complete the examination in less than 43
minutes?
Find:
P(X
̄ <43)
Step 2: Use the formula to find the Z-score
Step 3: Use the Z-table to look up the z-score you calculated in step 2
Z= -0.40
Step 4: Draw a graph and plot the z-score and its corresponding area.
Then shade the part your’e looking for: P(X
̄ <43).
Step 5: If you are looking for a less than area, the area in the table is the
answer,therefore the P(X
̄ <43)= 0.3446 or 34.46%
A. If 50 randomly selected senior high school students take the
examination.What is the probability that the mean time it takes the
group to complete the test will be less than 43 minutes?
Step 1: Identify the parts of the problem
Given: µ = 46.2 minutes
σ = 8 minutes
X
̄ = 43 minutes
n= 50 students
Step 2: Use the formula to find the Z-score
Step 3: Use the Z-table to look up the z-score you calculated in step 2
Z= -2.83
Step 4: Draw a graph and plot the z-score and its corresponding area. Then shade the part your’e looking
for: P(X
̄ <43).
Step 5: If you are looking for a less than area, the area in the table is the answer,therefore the P(X
̄ <43)= 0.0023
or 0.23%
What is the probability that the mean
time it takes the group to complete the
test will be less than 43 minutes?
Find:
P(X
̄ <43)
Illustrating Central Limit Theorem
Given a die,it has 6 faces in which each face has either dot/s of x
=1,2,3,4,5 and 6. Compute the following:
1.Population mean
2.Population variance
3.Population standard deviation
4.Illustrate the probability histogram of the sampling distribution of the means
Compute the population mean
1 + 2 + 3 + 4 + 5 + 6 = 21 = 3.5
6 6
Compute the population variance
Population variance formula
(1- 3.5)² + (2- 3.5)² + (3- 3.5)² + (4- 3.5)² + (5- 3.5)² + (6- 3.5)²
σ2
= 2.92
Compute the population standard deviation
Use the Population standard deviation
formula:
√(2.92)
σ2
= 1.72
Construct the histogram
The population mean and sampling distribution
means are both equal which is 3,5,It has a
variance of approximately 2.92 and a standard
deviation of approximately 1.71.Since all samples
have the same probability of 1/6 the trend of the
histogram is like a flat line horizontally.
0 1 2 3 4 5 6
Given a die,it has 6 faces in which each face has either dot/s of x =1,2,3,4,5 and 6.
Compute the following.Given it as the population, consider the sample size
n = 2.Compute each following:
 1. Mean of the sampling distribution of the sample mean
 2. Variance of the sampling distribution of the sample mean
 3. Standard deviation of the sampling distribution of the sample
mean
 4. Illustrate the probability histogram of the sampling distribution of
the mean.
Central-limit-theorem of probability.pptx

Central-limit-theorem of probability.pptx

  • 2.
    Central Limit Theorem The central limit theorem states that if you take sufficiently large samples from a population, the samples' means will be normally distributed, even if the population isn't normally distributed  The central limit theorem (CLT) states that the distribution of sample means approximates a normal distribution as the sample size gets larger, regardless of the population's distribution.  If the sample size is at least 30 or more the population is normally distributed, then the central limit theorem applies. If the sample size is less than 30 and the population is not normally distributed, then the central limit theorem does not apply.
  • 3.
    Standard normal Distribution Thestandard deviation is the measure of how spread out a normally distributed set of data is.
  • 4.
    Use the Z-tableto find the area
  • 5.
    Z -score FormulaZ Conversion Formula
  • 6.
    Example: Assume thatthe variable is normally distributed,the average time it takes a group of senior high school students to complete a certain examination is 46.2 minutes while standard deviation is 8 minutes. A. If 50 randomly selected senior high school students take the examination.What is the probability that the mean time it takes the group to complete the test will be less than 43 minutes? Steps of solving it: Step 1: Identify the parts of the problem Given: µ= 46.2 minutes σ = 8 minutes X ̄ = 43 minutes What is the probability that a random selected senior high school students will complete the examination in less than 43 minutes? Find: P(X ̄ <43)
  • 7.
    Step 2: Usethe formula to find the Z-score Step 3: Use the Z-table to look up the z-score you calculated in step 2 Z= -0.40 Step 4: Draw a graph and plot the z-score and its corresponding area. Then shade the part your’e looking for: P(X ̄ <43). Step 5: If you are looking for a less than area, the area in the table is the answer,therefore the P(X ̄ <43)= 0.3446 or 34.46%
  • 8.
    A. If 50randomly selected senior high school students take the examination.What is the probability that the mean time it takes the group to complete the test will be less than 43 minutes? Step 1: Identify the parts of the problem Given: µ = 46.2 minutes σ = 8 minutes X ̄ = 43 minutes n= 50 students Step 2: Use the formula to find the Z-score Step 3: Use the Z-table to look up the z-score you calculated in step 2 Z= -2.83 Step 4: Draw a graph and plot the z-score and its corresponding area. Then shade the part your’e looking for: P(X ̄ <43). Step 5: If you are looking for a less than area, the area in the table is the answer,therefore the P(X ̄ <43)= 0.0023 or 0.23% What is the probability that the mean time it takes the group to complete the test will be less than 43 minutes? Find: P(X ̄ <43)
  • 10.
    Illustrating Central LimitTheorem Given a die,it has 6 faces in which each face has either dot/s of x =1,2,3,4,5 and 6. Compute the following: 1.Population mean 2.Population variance 3.Population standard deviation 4.Illustrate the probability histogram of the sampling distribution of the means
  • 11.
    Compute the populationmean 1 + 2 + 3 + 4 + 5 + 6 = 21 = 3.5 6 6 Compute the population variance Population variance formula (1- 3.5)² + (2- 3.5)² + (3- 3.5)² + (4- 3.5)² + (5- 3.5)² + (6- 3.5)² σ2 = 2.92 Compute the population standard deviation Use the Population standard deviation formula: √(2.92) σ2 = 1.72
  • 12.
    Construct the histogram Thepopulation mean and sampling distribution means are both equal which is 3,5,It has a variance of approximately 2.92 and a standard deviation of approximately 1.71.Since all samples have the same probability of 1/6 the trend of the histogram is like a flat line horizontally. 0 1 2 3 4 5 6
  • 13.
    Given a die,ithas 6 faces in which each face has either dot/s of x =1,2,3,4,5 and 6. Compute the following.Given it as the population, consider the sample size n = 2.Compute each following:  1. Mean of the sampling distribution of the sample mean  2. Variance of the sampling distribution of the sample mean  3. Standard deviation of the sampling distribution of the sample mean  4. Illustrate the probability histogram of the sampling distribution of the mean.