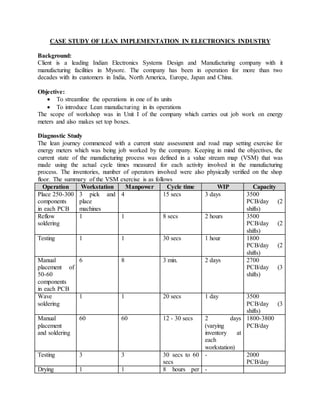
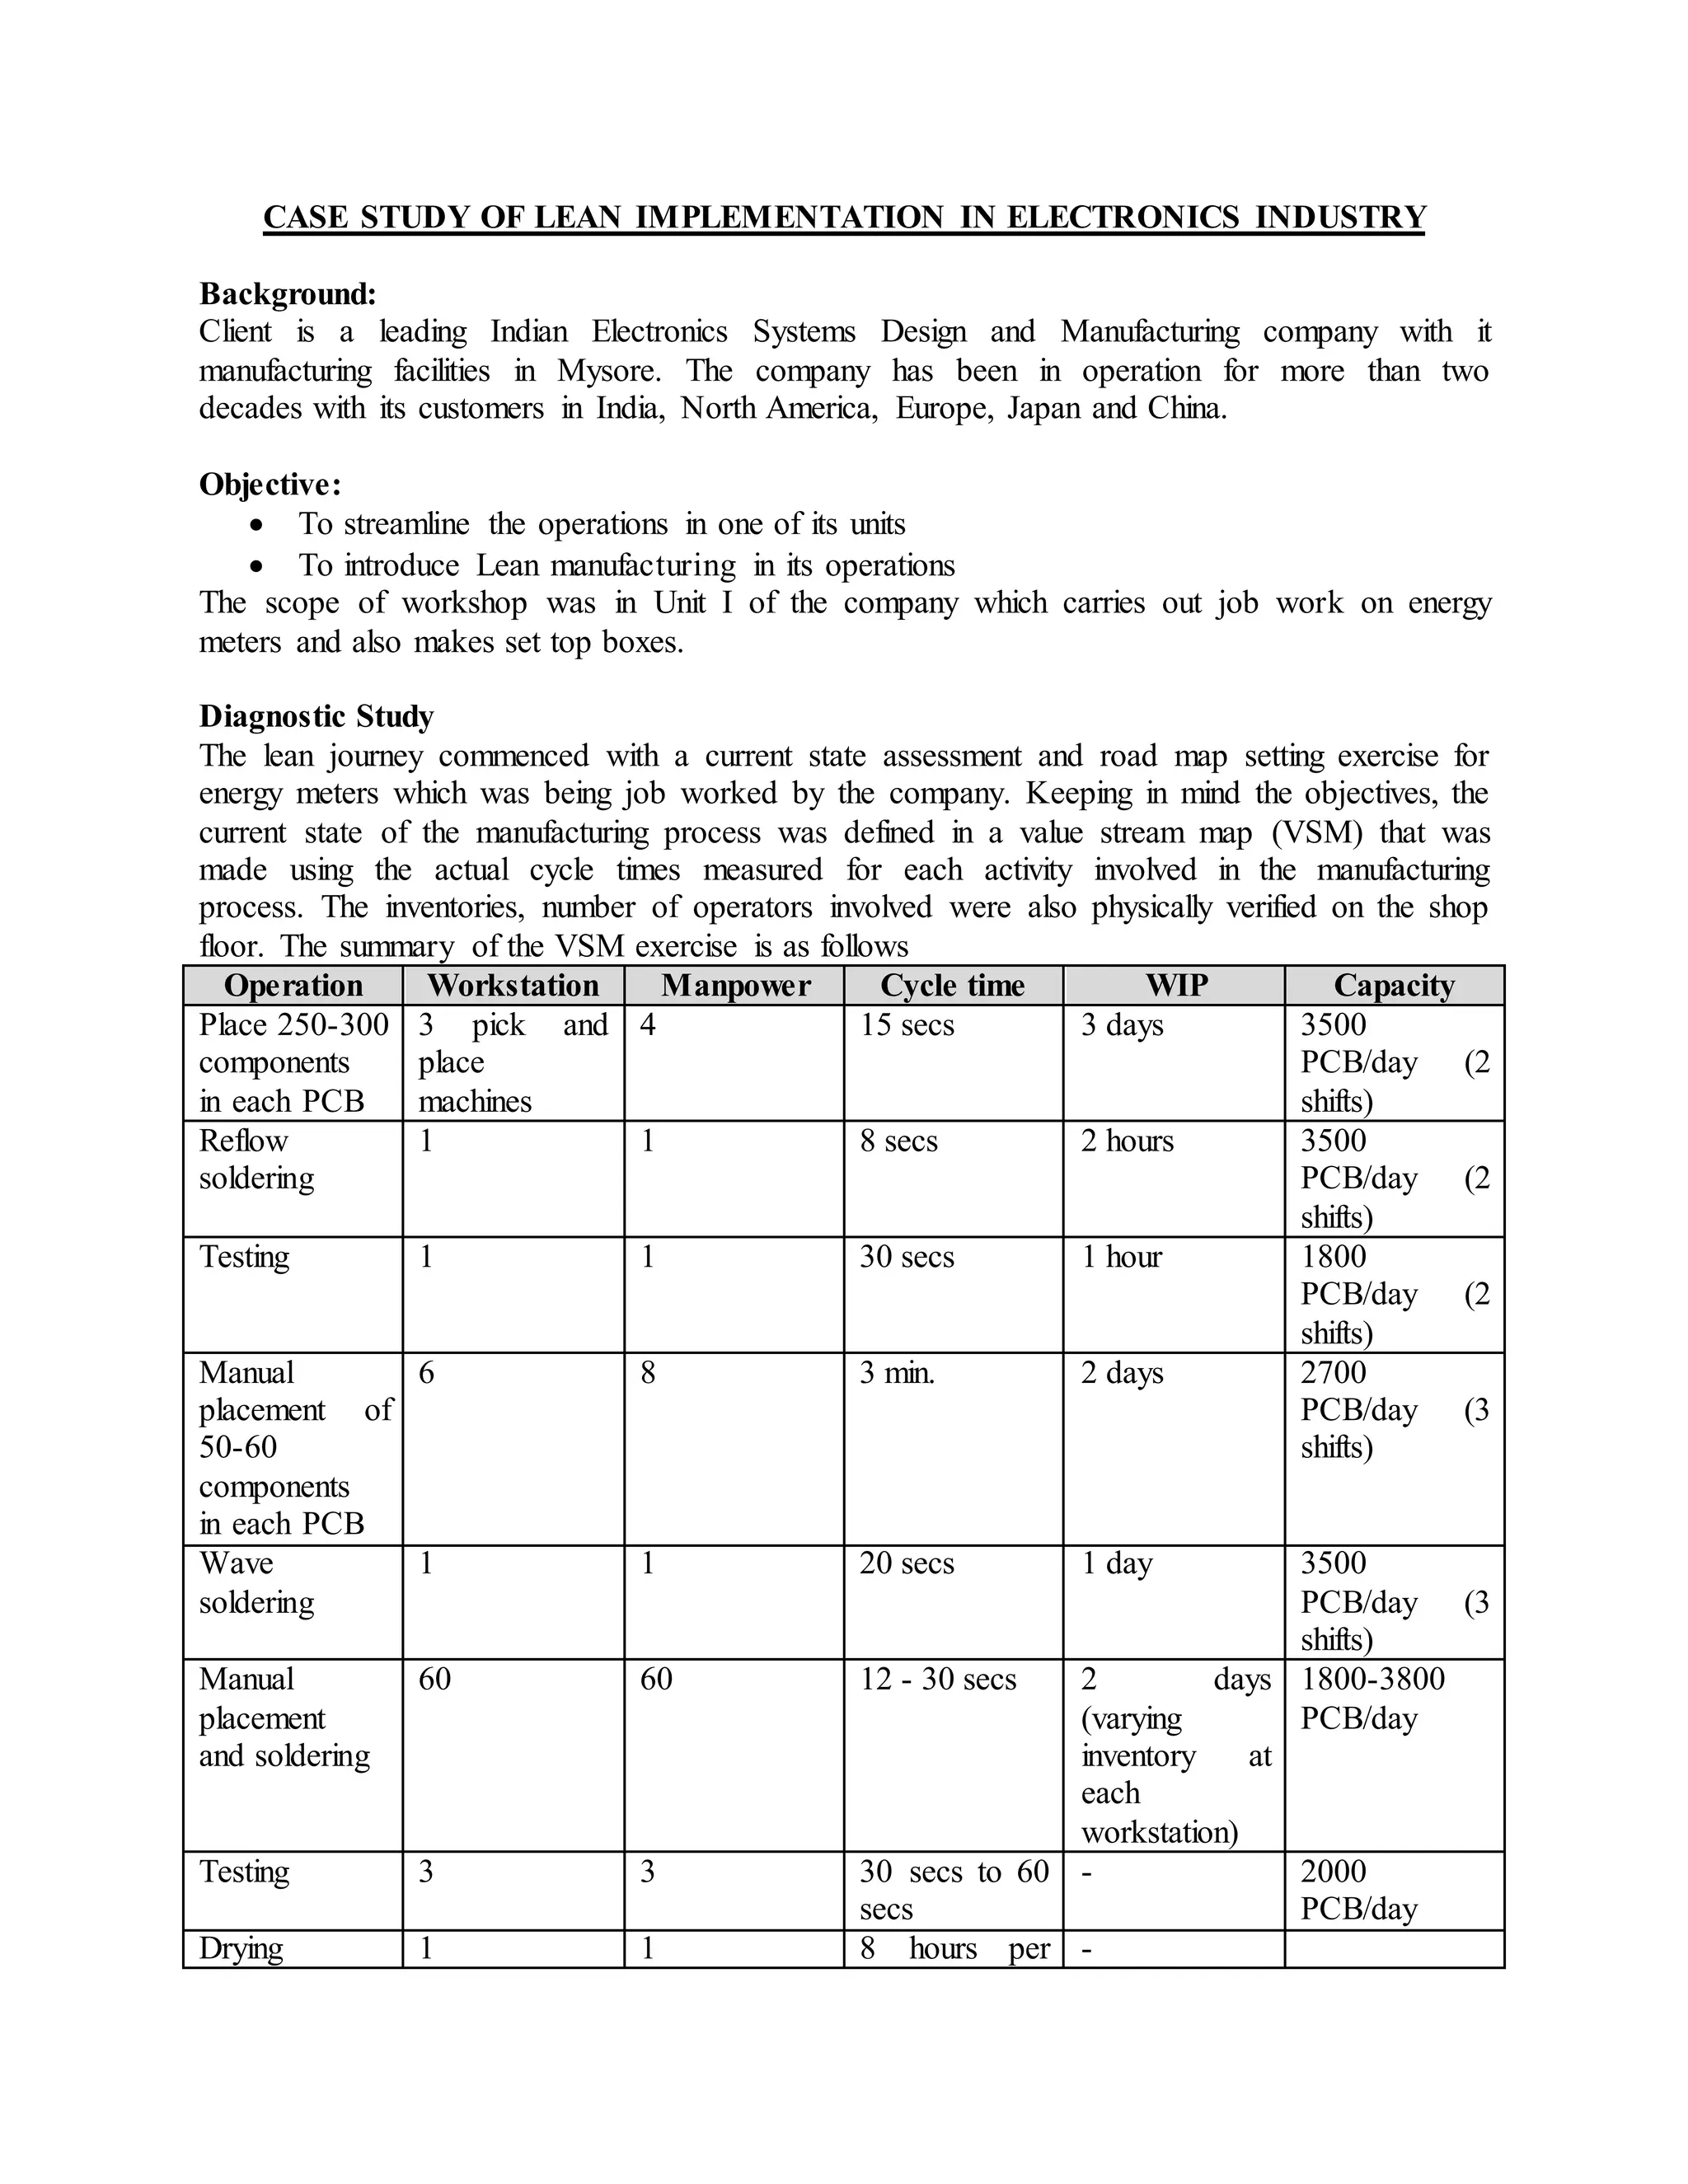
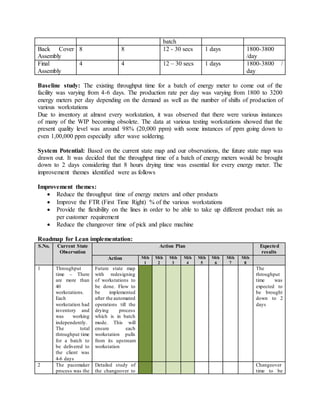
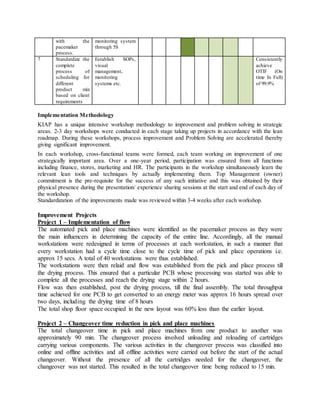
The document summarizes a case study of implementing lean manufacturing principles in an electronics company. It describes conducting an analysis of current operations, identifying areas for improvement, and implementing changes. Key points:
1) The company aimed to streamline operations and introduce lean. An analysis found throughput time varied from 4-6 days with quality issues.
2) Improvements included establishing flow between workstations, reducing changeover times from 90 minutes to 15 minutes, and moving quality checks closer to where defects occurred.
3) Results included reducing throughput time to 2 days, floor space by 60%, and improving quality levels and production flexibility. The lean implementation improved operations and addressed original objectives.
Deployed Lean Manufacturing in fabrication of Exhaust After Treatment System Rack made for VOLVO / Mack Trucks used Lean to increase productivity by 50% and Six Sigma
methodology to resolve complex design issues, improve quality controls for sustained improvement
SMED implementation on Automated Stamping LineParth Patel
The company was facing higher machine downtime on the manufacturing line. After carrying out the root cause analysis using various lean tools such as 5W 1H, Ishikawa Diagram, and Pareto Chart conclusion has been made that die changeover is the root cause of the machine downtime. SMED implementation kick-off started with observing the current changeover activities. After that various kind of wastes identified. External and Internal activities separated and internal activities are streamlined using Precedence diagram and Gantt chart. That has resulted in standard work operations and increased parallel activities. The previous changeover time was 252 minutes and after SMED implementation it is estimated that changeover will be completed in 72 minutes.
A simple nonlinear PD controller for integrating processesISA Interchange
Many industrial processes are found to be integrating in nature, for which widely used Ziegler–Nichols tuned PID controllers usually fail to provide satisfactory performance due to excessive overshoot with large settling time. Although, IMC (Internal Model Control) based PID controllers are capable to reduce the overshoot, but little improvement is found in the load disturbance response. Here, we propose an auto-tuning proportional-derivative controller (APD) where a nonlinear gain updating factor α continuously adjusts the proportional and derivative gains to achieve an overall improved performance during set point change as well as load disturbance. The value of α is obtained by a simple relation based on the instantaneous values of normalized error (eN) and change of error (ΔeN) of the controlled variable. Performance of the proposed nonlinear PD controller (APD) is tested and compared with other PD and PID tuning rules for pure integrating plus delay (IPD) and first-order integrating plus delay (FOIPD) processes. Effectiveness of the proposed scheme is verified on a laboratory scale servo position control system.
summary of 16 Lean Six Sigma improvement projects in manufacturing, bio-manufacturing, supply chain
including 2 machine safeguarding . Total savings over $8Mil
Guidelines for Setting Filter and Module Execution RateEmerson Exchange
The is a recording of a presentation given at Emerson Exchange 2010. Basic guidelines are presented on how to set filtering to avoid aliasing. Also, information is provided on how to set control execution rate to achieve best performance.
It was really excited to run my First Lean Six Sigma Black Belt Project in my factory . And during the project im really great full to my honorable management . Now im posting this project for the audience of this site .
Thoughts on how to utilize Amazons EC2 (Elastic Compute Cloud) web service for hosting applications, especially with Ruby on Rails in mind. A major issue is the non persistence of local storage in the EC2 environment. We outlined several approaches on how to possibly solve this issue, minimizing potential data loss.
by Adam Groves and Martin Rehfeld
The purpose of this class exercise is to walk someone through the Design for Six Sigma process. One learns that design changes later on in the development process are astronomically more expensive than design changes early in the process.
Customer service training for mobil filling station attendants(1)Olatunji Olajide
A presentation designed by Abdulkabir Olatunji for Mobil Filling Stations in Nigeria. You can visit my blog to learn more about me http://coolstuff49ja.com
This workshop will provide everybody who works in a leisure centre with the inspiration, support and tools to develop a customer service oriented culture, improve their customer service skills, resolve customer service problems and increase the satisfaction and retention of your customers.
Overview on the Toyota production system principles, techniques and theories.
The presentation include:
-Lean Manufacturing Principles
-Productivity Measurement, Analysis and Improvement
-Effect & Elimination of the Manufacturing 7-Wastes
-Lean Improvement Techniques
-Lean Management for Making Improvement & Gaining Sustainability
Application of value stream mapping tool to reduce wastes in bearing industryijmech
In today’s highly competitive business environment, companies require improvement in Production Lead
Times, costs and customer service levels to survive. Because of this, companies have become more
customers focused. The result is that companies have been putting in significant effort to improve their
efficiency.
This paper present the practical application of Value Stream Mapping (VSM) tool implement in a bearing
industry. A value stream is an assortment of all actions (value added as well as non-value added) that are
required to bring a product through the essential flows, starting with raw material and ending with the
customer. For drawing current state value stream mapping, all relevant data has been collected and analyzed. Then analysis of current state map has been done for identifying non-value adding activities, in
other words waste and suggestions on how to remove or reduce different wastes. From the results achieved
by current VSM, it was observable that the two processes Annealing and CNC Machining have higher cycle
time and WIP. In order to increase their capacity, their cycle should be reduced.
By implementing some lean principles and changes in the production line, the future state map was created and the reduction the different types of wastes reduced. The total processing time was reduced from 409
seconds to 344 seconds.
We are a Chennai based Lean Manufacturing Consulting firm, working with manufacturing companies in the implementation of Lean Initiatives like JIT, Kaizen Single Piece Flow, SMED and many more. We work with Medium Sized and Large Companies.
IMPROVING OSH & PRODUCTIVITY OF RMG INDUSTRIES BY IMPLEMENTING LEAN TOOLS AN...Karina Islam
The garment industry has played a pioneering role in the development of industrial sector of Bangladesh. The RMG sector is expected to grow despite the global financial crisis of 2009.As China is finding it challenging to make textile and foot wear items at cheap price, due to rising labor costs, many foreign investors, are coming to Bangladesh to take advantage of the low labor cost. Though Bangladesh produces garment with lowest cost but poor productivity. To survive and prosper in today's economic times, companies can no longer manage using financial measures alone, they have to track non-financial measures also such as customer satisfaction, brand preference, speed of response, employee satisfaction etc.Productivity can improve by applying lean tools like- 5s, JIT, Muda, Root Cause analysis, KPIs, VSM. For improving the ultimate productivity OHS of RMG sector of Bangladesh should be improved. In Ready Made Garments (RMG) sector of Bangladesh, the employees represent an organization's biggest and its most valuable asset. The company's productivity, and ultimately, its profitability depend on making sure all of its workers perform up to their full potential. This paper summarizes that how KPIs analysis improve productivity and OHS of RMG sectors. Appropriate indicators are first selected for KPI scoring then simulate the scores with the help of Adaptive Network-based Fuzzy Inference System (ANFIS) and finally illustrated how KPIs impacts on overall productivity.
Senior Project and Engineering Leader Jim Smith.pdfJim Smith
I am a Project and Engineering Leader with extensive experience as a Business Operations Leader, Technical Project Manager, Engineering Manager and Operations Experience for Domestic and International companies such as Electrolux, Carrier, and Deutz. I have developed new products using Stage Gate development/MS Project/JIRA, for the pro-duction of Medical Equipment, Large Commercial Refrigeration Systems, Appliances, HVAC, and Diesel engines.
My experience includes:
Managed customized engineered refrigeration system projects with high voltage power panels from quote to ship, coordinating actions between electrical engineering, mechanical design and application engineering, purchasing, production, test, quality assurance and field installation. Managed projects $25k to $1M per project; 4-8 per month. (Hussmann refrigeration)
Successfully developed the $15-20M yearly corporate capital strategy for manufacturing, with the Executive Team and key stakeholders. Created project scope and specifications, business case, ROI, managed project plans with key personnel for nine consumer product manufacturing and distribution sites; to support the company’s strategic sales plan.
Over 15 years of experience managing and developing cost improvement projects with key Stakeholders, site Manufacturing Engineers, Mechanical Engineers, Maintenance, and facility support personnel to optimize pro-duction operations, safety, EHS, and new product development. (BioLab, Deutz, Caire)
Experience working as a Technical Manager developing new products with chemical engineers and packaging engineers to enhance and reduce the cost of retail products. I have led the activities of multiple engineering groups with diverse backgrounds.
Great experience managing the product development of products which utilize complex electrical controls, high voltage power panels, product testing, and commissioning.
Created project scope, business case, ROI for multiple capital projects to support electrotechnical assembly and CPG goods. Identified project cost, risk, success criteria, and performed equipment qualifications. (Carrier, Electrolux, Biolab, Price, Hussmann)
Created detailed projects plans using MS Project, Gant charts in excel, and updated new product development in Jira for stakeholders and project team members including critical path.
Great knowledge of ISO9001, NFPA, OSHA regulations.
User level knowledge of MRP/SAP, MS Project, Powerpoint, Visio, Mastercontrol, JIRA, Power BI and Tableau.
I appreciate your consideration, and look forward to discussing this role with you, and how I can lead your company’s growth and profitability. I can be contacted via LinkedIn via phone or E Mail.
Jim Smith
678-993-7195
jimsmith30024@gmail.com
The case study discusses the potential of drone delivery and the challenges that need to be addressed before it becomes widespread.
Key takeaways:
Drone delivery is in its early stages: Amazon's trial in the UK demonstrates the potential for faster deliveries, but it's still limited by regulations and technology.
Regulations are a major hurdle: Safety concerns around drone collisions with airplanes and people have led to restrictions on flight height and location.
Other challenges exist: Who will use drone delivery the most? Is it cost-effective compared to traditional delivery trucks?
Discussion questions:
Managerial challenges: Integrating drones requires planning for new infrastructure, training staff, and navigating regulations. There are also marketing and recruitment considerations specific to this technology.
External forces vary by country: Regulations, consumer acceptance, and infrastructure all differ between countries.
Demographics matter: Younger generations might be more receptive to drone delivery, while older populations might have concerns.
Stakeholders for Amazon: Customers, regulators, aviation authorities, and competitors are all stakeholders. Regulators likely hold the greatest influence as they determine the feasibility of drone delivery.
Artificial intelligence (AI) offers new opportunities to radically reinvent the way we do business. This study explores how CEOs and top decision makers around the world are responding to the transformative potential of AI.
The Team Member and Guest Experience - Lead and Take Care of your restaurant team. They are the people closest to and delivering Hospitality to your paying Guests!
Make the call, and we can assist you.
408-784-7371
Foodservice Consulting + Design
Oprah Winfrey: A Leader in Media, Philanthropy, and Empowerment | CIO Women M...CIOWomenMagazine
This person is none other than Oprah Winfrey, a highly influential figure whose impact extends beyond television. This article will delve into the remarkable life and lasting legacy of Oprah. Her story serves as a reminder of the importance of perseverance, compassion, and firm determination.
1. CASE STUDY OF LEAN IMPLEMENTATION IN ELECTRONICS INDUSTRY
Background:
Client is a leading Indian Electronics Systems Design and Manufacturing company with it
manufacturing facilities in Mysore. The company has been in operation for more than two
decades with its customers in India, North America, Europe, Japan and China.
Objective:
To streamline the operations in one of its units
To introduce Lean manufacturing in its operations
The scope of workshop was in Unit I of the company which carries out job work on energy
meters and also makes set top boxes.
Diagnostic Study
The lean journey commenced with a current state assessment and road map setting exercise for
energy meters which was being job worked by the company. Keeping in mind the objectives, the
current state of the manufacturing process was defined in a value stream map (VSM) that was
made using the actual cycle times measured for each activity involved in the manufacturing
process. The inventories, number of operators involved were also physically verified on the shop
floor. The summary of the VSM exercise is as follows
Operation Workstation Manpower Cycle time WIP Capacity
Place 250-300
components
in each PCB
3 pick and
place
machines
4 15 secs 3 days 3500
PCB/day (2
shifts)
Reflow
soldering
1 1 8 secs 2 hours 3500
PCB/day (2
shifts)
Testing 1 1 30 secs 1 hour 1800
PCB/day (2
shifts)
Manual
placement of
50-60
components
in each PCB
6 8 3 min. 2 days 2700
PCB/day (3
shifts)
Wave
soldering
1 1 20 secs 1 day 3500
PCB/day (3
shifts)
Manual
placement
and soldering
60 60 12 - 30 secs 2 days
(varying
inventory at
each
workstation)
1800-3800
PCB/day
Testing 3 3 30 secs to 60
secs
- 2000
PCB/day
Drying 1 1 8 hours per -
2. batch
Back Cover
Assembly
8 8 12 - 30 secs 1 days 1800-3800
/day
Final
Assembly
4 4 12 – 30 secs 1 days 1800-3800 /
day
Baseline study: The existing throughput time for a batch of energy meter to come out of the
facility was varying from 4-6 days. The production rate per day was varying from 1800 to 3200
energy meters per day depending on the demand as well as the number of shifts of production of
various workstations
Due to inventory at almost every workstation, it was observed that there were various instances
of many of the WIP becoming obsolete. The data at various testing workstations showed that the
present quality level was around 98% (20,000 ppm) with some instances of ppm going down to
even 1,00,000 ppm especially after wave soldering.
System Potential: Based on the current state map and our observations, the future state map was
drawn out. It was decided that the throughput time of a batch of energy meters would be brought
down to 2 days considering that 8 hours drying time was essential for every energy meter. The
improvement themes identified were as follows
Improvement themes:
Reduce the throughput time of energy meters and other products
Improve the FTR (First Time Right) % of the various workstations
Provide the flexibility on the lines in order to be able to take up different product mix as
per customer requirement
Reduce the changeover time of pick and place machine
Roadmap for Lean implementation:
S.No. Current State
Observation
Action Plan Expected
results
Action Mth
1
Mth
2
Mth
3
Mth
4
Mth
5
Mth
6
Mth
7
Mth
8
1 Throughput
time – There
are more than
40
workstations.
Each
workstation had
inventory and
was working
independently.
The total
throughput time
for a batch to
be delivered to
the client was
4-6 days
Future state map
with redesigning
of workstations to
be done. Flow to
be implemented
after the automated
operations till the
drying process
which is in batch
mode. This will
ensure each
workstation pulls
from its upstream
workstation
The
throughput
time was
expected to
be brought
down to 2
days
2 The pacemaker
process was the
Detailed study of
the changeover to
Changeover
time to be
3. pick and place
process which
places 250-300
components in
each PCB.
Changeover
time in the pick
and place
machines from
one product to
another was
around 90 min.
be carried out.
SMED concepts to
be used to reduce
the changeover
time
reduced to
around 15
min.
3 Defects were
being detected
downstream
much later.
This resulted in
the various
workstations
continuing to
produce bad
quality
components as
feedback is not
received in
time. (Reflow
soldering and
wave soldering
workstations)
Point of
occurrence and
point of detection
to be brought
closer to each
other. Quality
check to be
introduced
immediately after
reflow soldering
and after wave
soldering
PPM is
expected to
be reduced
from 20000
ppm to
around
10000 ppm
4 Reflow
soldering and
wave soldering
were the key
workstations
which
contributes to
the FTR being
low
Identify the root
causes of the
defects and
address them with
temporary and
then permanent
countermeasures.
Expected
that the ppm
of these
workstations
will come
down to
1000 ppm
5 Cycle time at
each of the
workstations
was much
different from
the TAKT time
of pacemaker
process. This
results in line
not being
balanced
Change in the
design of the
workstation to
enable
standardization of
work and equal
distribution of
work across
workstations. This
will also ensure
that irrespective of
product the core
processes are
standardized
All
workstations
to work with
even TAKT
time of
pacemaker
process (15
seconds)
6 All the
workstations
have to be
synchronized
Synchronize and
level schedule
based delivery
dates. Improve the
Reduce the
throughput
time by 10%
4. with the
pacemaker
process.
monitoring system
through 5S
7 Standardize the
complete
process of
scheduling for
different
product mix
based on client
requirements
Establish SOPs,
visual
management,
monitoring
systems etc.
Consistently
achieve
OTIF (On
time In Full)
of 99.9%
Implementation Methodology
KIAP has a unique intensive workshop methodology to improvement and problem solving in strategic
areas. 2-3 day workshops were conducted in each stage taking up projects in accordance with the lean
roadmap. During these workshops, process improvement and Problem Solving are accelerated thereby
giving significant improvement.
In each workshop, cross-functional teams were formed, each team working on improvement of one
strategically important area. Over a one-year period, participation was ensured from all functions
including finance, stores, marketing and HR. The participants in the workshop simultaneously learn the
relevant lean tools and techniques by actually implementing them. Top Management (owner)
commitment is the pre-requisite for the success of any such initiative and this was obtained by their
physical presence during the presentation/ experience sharing sessions at the start and end of each day of
the workshop.
Standardization of the improvements made was reviewed within 3-4 weeks after each workshop.
Improvement Projects
Project 1 – Implementation of flow
The automated pick and place machines were identified as the pacemaker process as they were
the main influencers in determining the capacity of the entire line. Accordingly, all the manual
workstations were redesigned in terms of processes at each workstation, in such a manner that
every workstation had a cycle time close to the cycle time of pick and place operations i.e.
approx 15 secs. A total of 40 workstations were thus established.
The workstations were then relaid and flow was established from the pick and place process till
the drying process. This ensured that a particular PCB whose processing was started was able to
complete all the processes and reach the drying stage within 2 hours.
Flow was then established, post the drying process, till the final assembly. The total throughput
time achieved for one PCB to get converted to an energy meter was approx 16 hours spread over
two days, including the drying time of 8 hours
The total shop floor space occupied in the new layout was 60% less than the earlier layout.
Project 2 – Changeover time reduction in pick and place machines
The total changeover time in pick and place machines from one product to another was
approximately 90 min. The changeover process involved unloading and reloading of cartridges
carrying various components. The various activities in the changeover process was classified into
online and offline activities and all offline activities were carried out before the start of the actual
changeover. Without the presence of all the cartridges needed for the changeover, the
changeover was not started. This resulted in the total changeover time being reduced to 15 min.
5. Project 3 – Point of detection of mistakes was made as close to point of occurrence as
possible
The wave soldering operations was identified as the point of occurrences for a number of defects.
However since these defects were actually detected atleast two or three workstations downstream
of the wave soldering workstations, it resulted in a number of PCBs being defectively produced
even thought the defects had already been detected. An inspection workstation was introduced
for the PCBs coming out of wave soldering. This ensured that feedback on wave soldering was
immediately provided and this prevented further defective components produced from wave
soldering. This brought down the ppm after wave soldering from a range of around 20000 ppm
to 10000 ppm
Project 4 – Lifting of components during wave soldering causing quality defects
One of the root causes of quality defects out of wave soldering was the lifting of a transformer
when it is passing over the solder wave. A jig was designed to hold down the transformer which
resulted in the ppm coming down by further 4000 ppm. Thus the quality defects reduced to 6000
ppm after wave soldering.
The above improvements were implemented during the first workshop carried out by us. Further
improvements are still in process and the lean journey is continuing in the organization.
Summary of Results obtained
Parameter Before After Improvement
Throughput time 4 – 6 days 2 days 60% reduction
Floor space occupied 7500 sq.ft. 3000 sq.ft. 60% reduction
Changeover time 90 min. 15 min. 83% reduction
FTR 20000 ppm 6000 ppm 70% reduction
No. of persons 80 persons 60 persons 25% reduction
WIP > 10 days 2 days 80% reduction
The benefits obtained have resulted in the company being able to service the customer with
shorter lead times, take orders of different products and thus be in tune with the market
requirements without compromising on the productivity and quality.