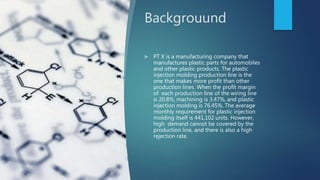
1. The document summarizes a research paper that analyzed the plastic injection molding production process at PT X to identify waste and propose improvements to reduce lead time.
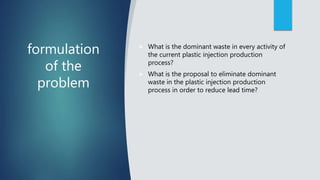
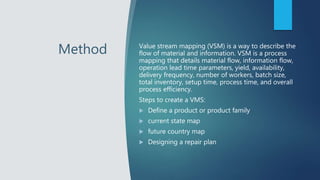
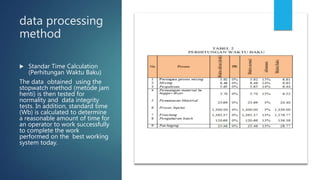
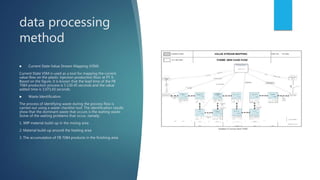
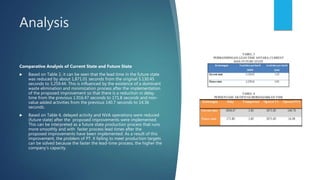
2. Using value stream mapping and a waste checklist, the analysis found that waiting waste was the dominant issue, accounting for 37.5% of the 5,130 second production lead time.
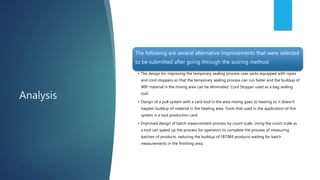
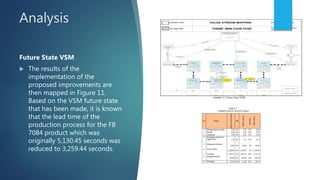
3. The paper proposed improvements like using rope-tied bags and a card pull system to eliminate waste during material transfer. This reduced the lead time to 3,259 seconds and waiting waste to 5.27% of the total time.