Downloaded 268 times


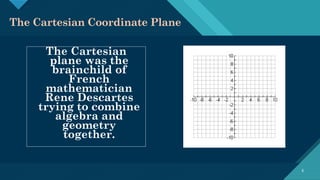


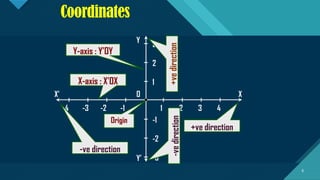
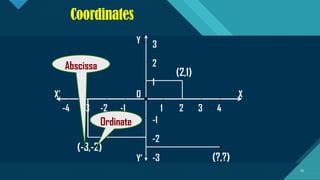

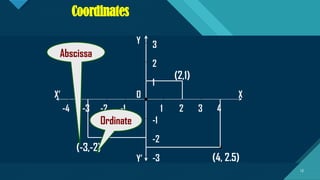
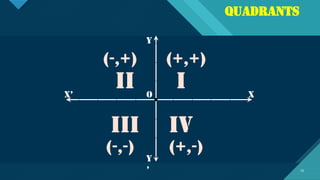

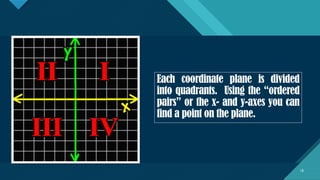

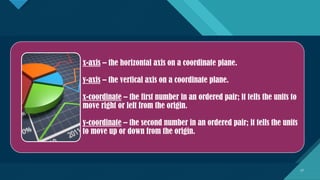


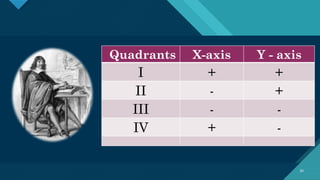
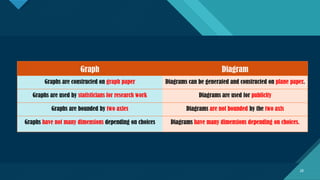


The document discusses the Cartesian coordinate system, created by mathematician René Descartes, which combines algebra and geometry to describe the position of points in a plane. It details how to plot points using ordered pairs on the x and y axes, explains the significance of the origin, quadrants, and coordinates, and highlights the importance of graphic representations for data visualization. Additionally, it covers various types of frequency distributions used in organizing raw data.