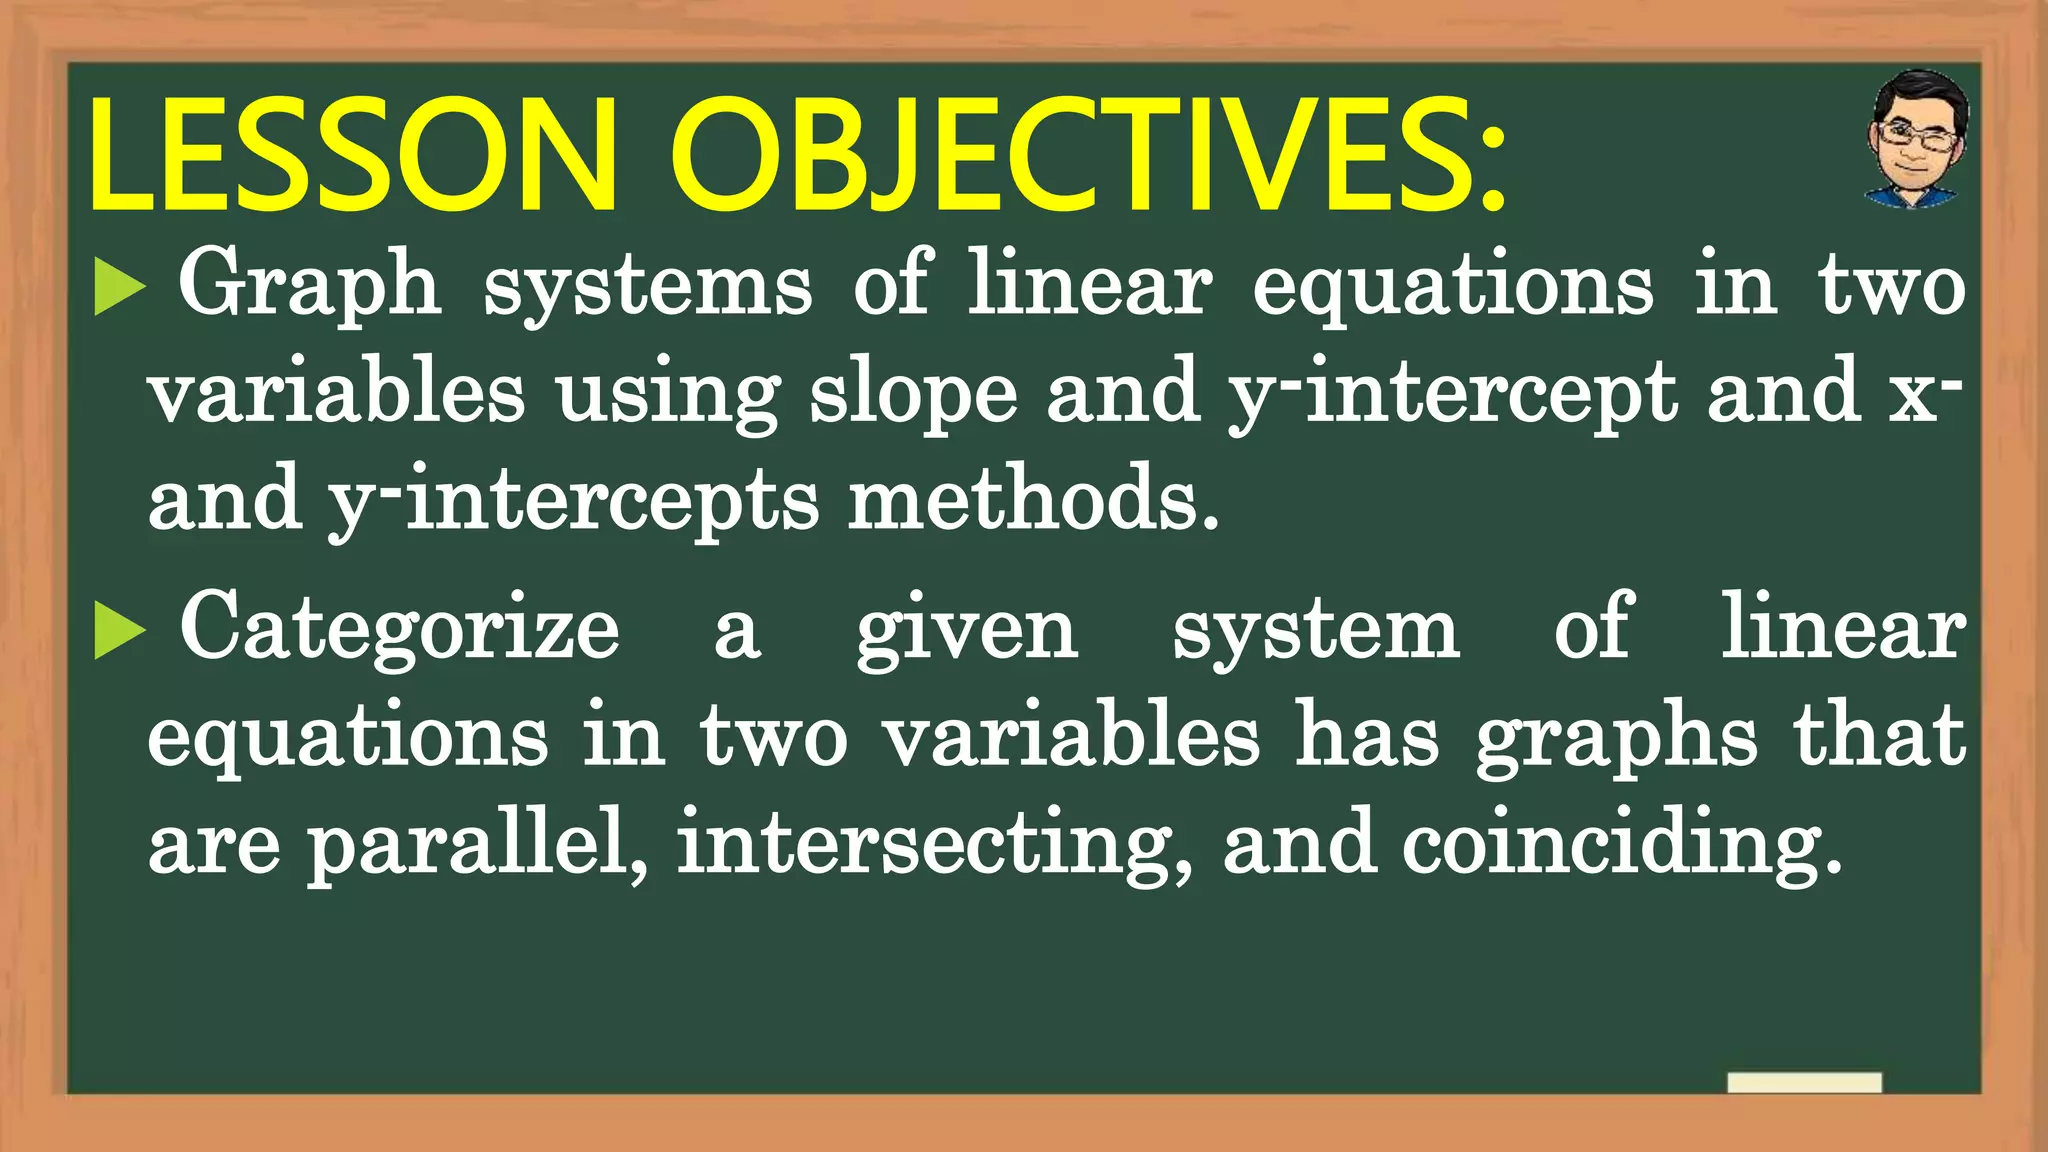
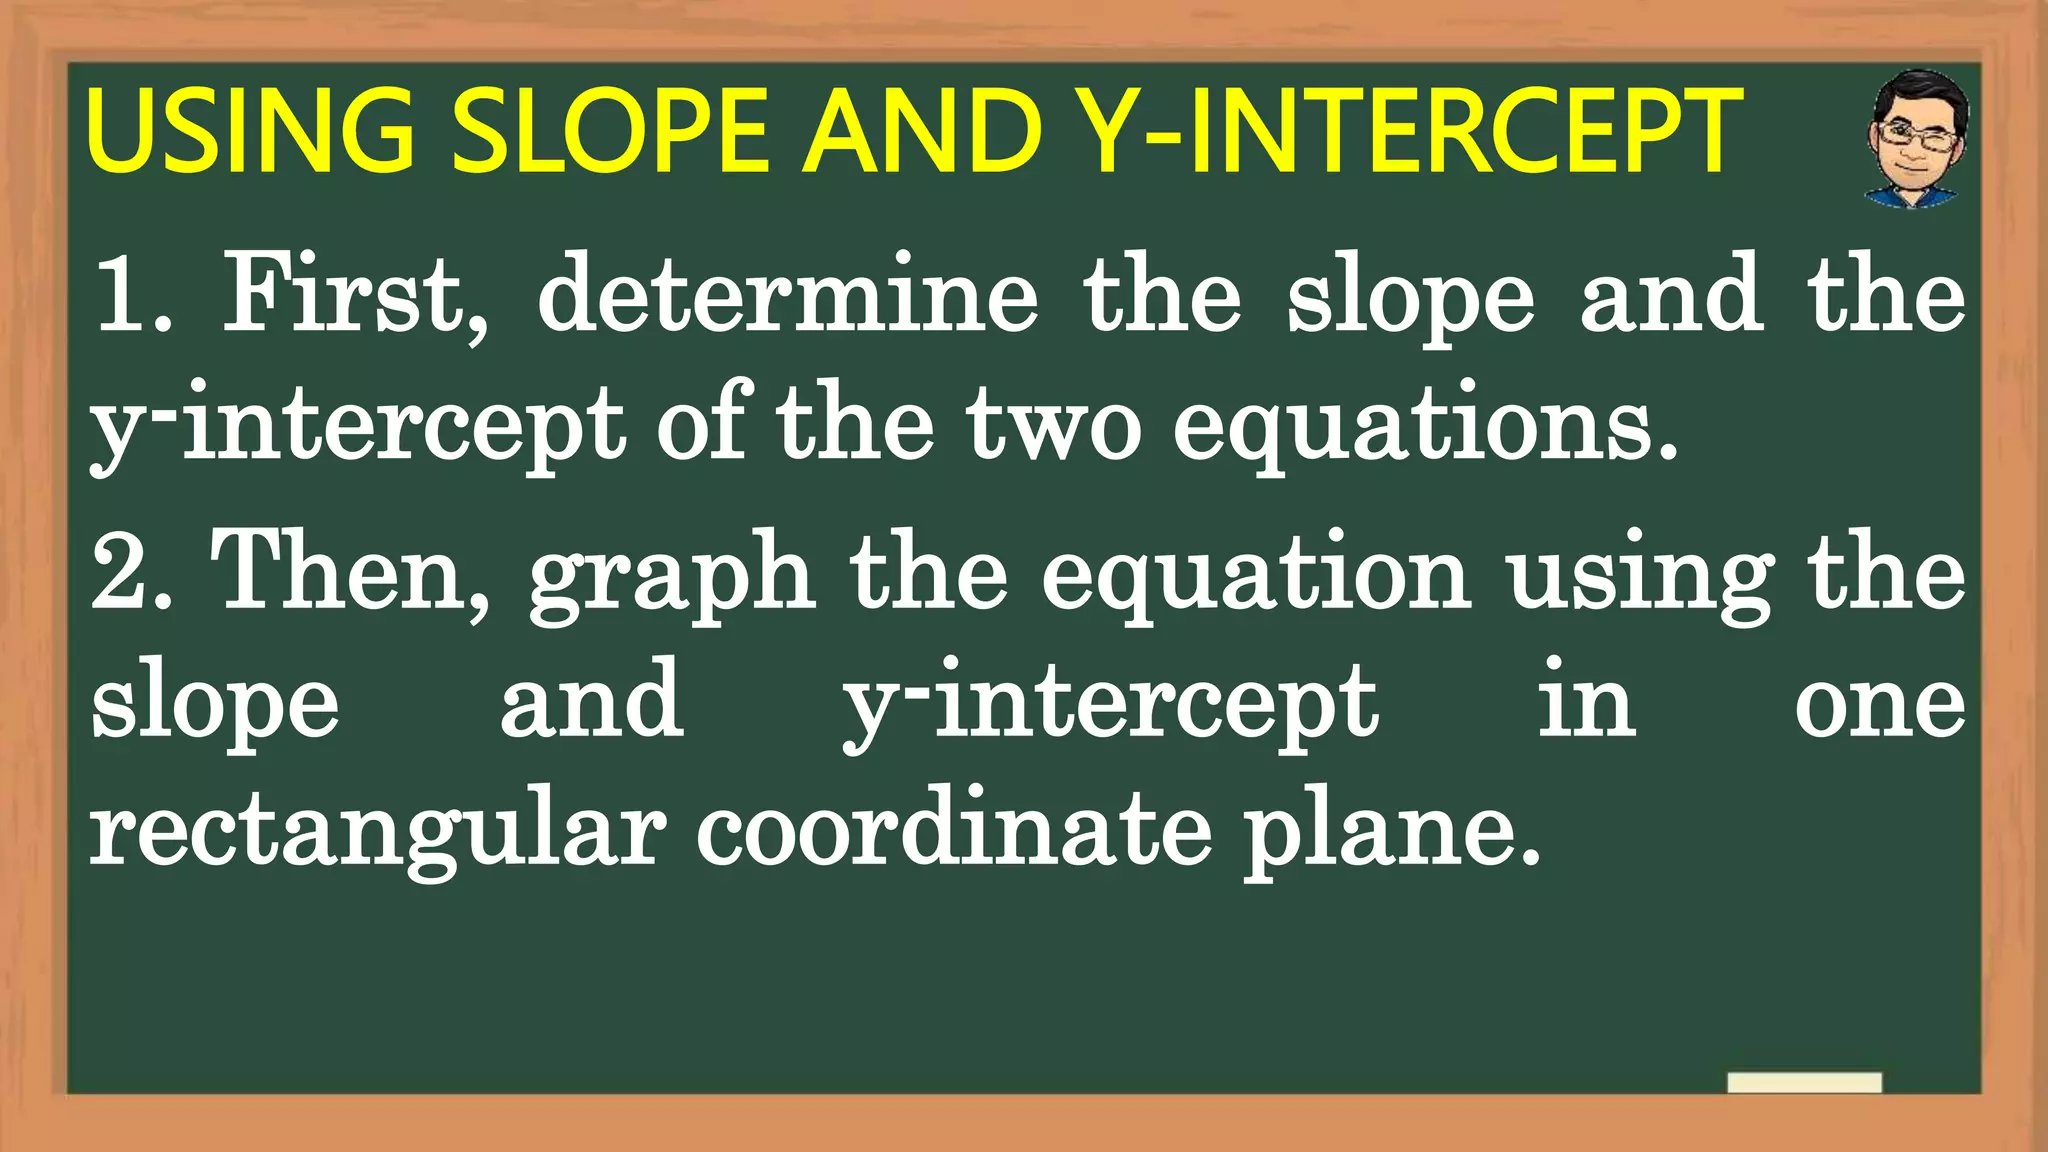
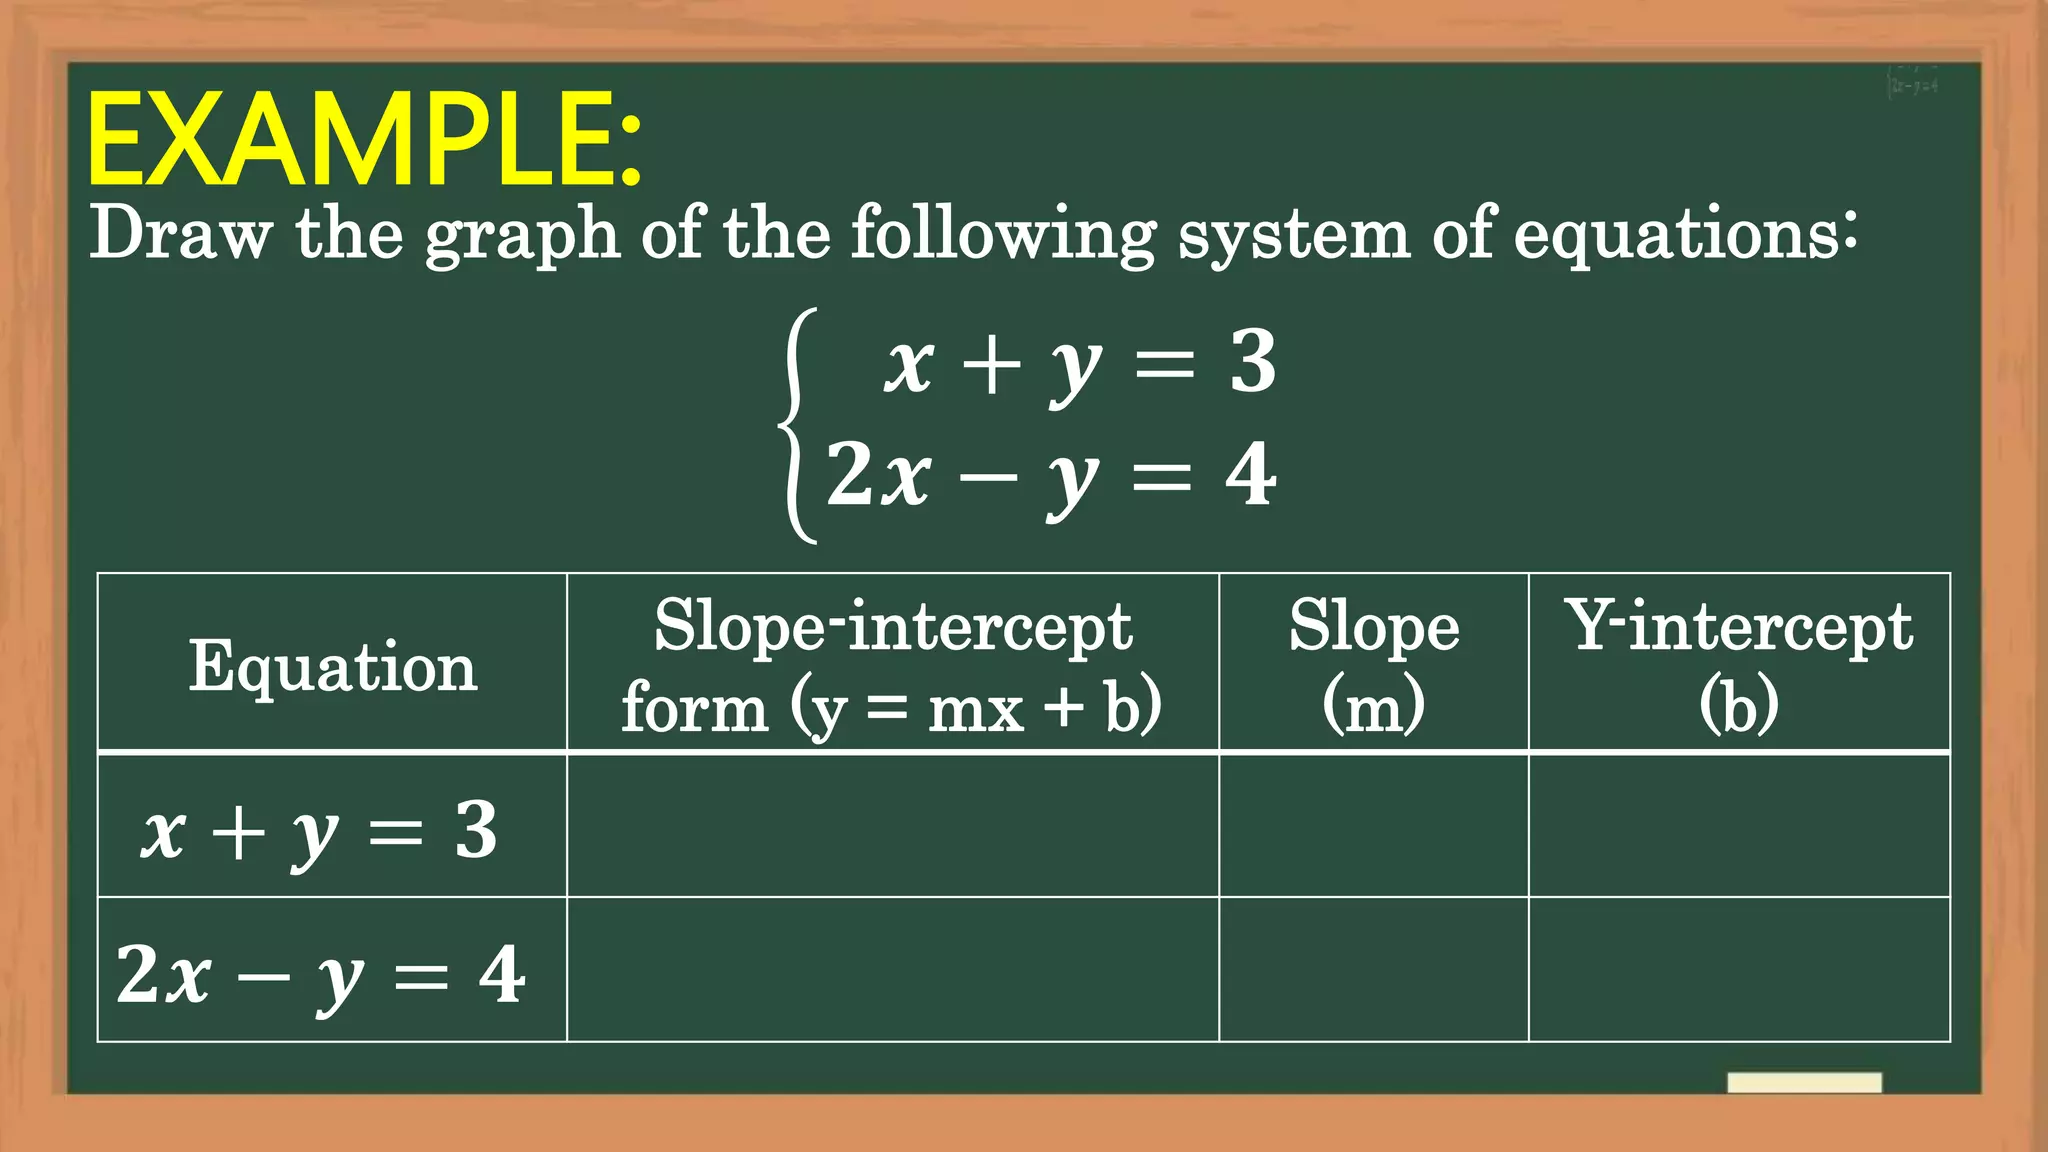
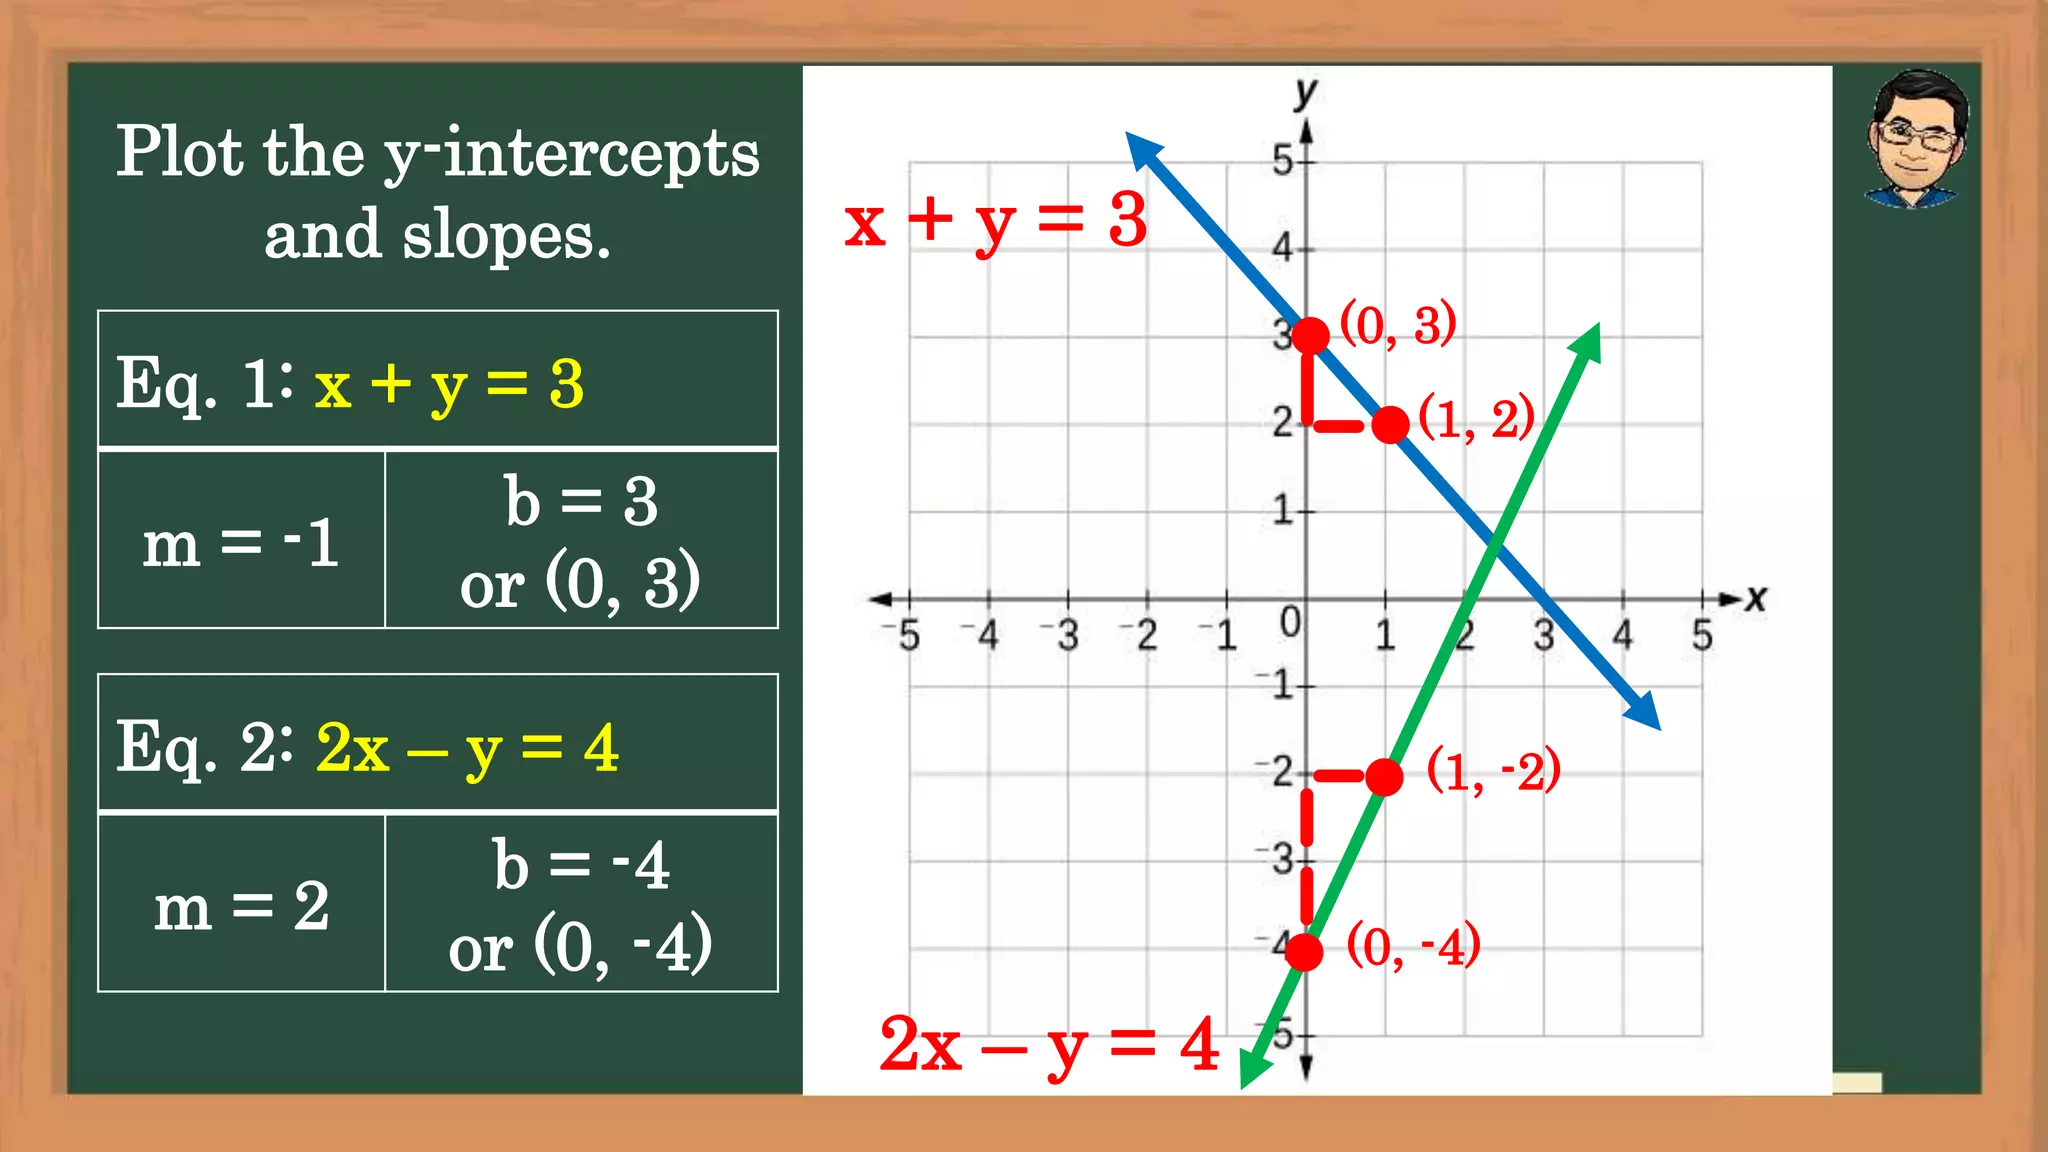
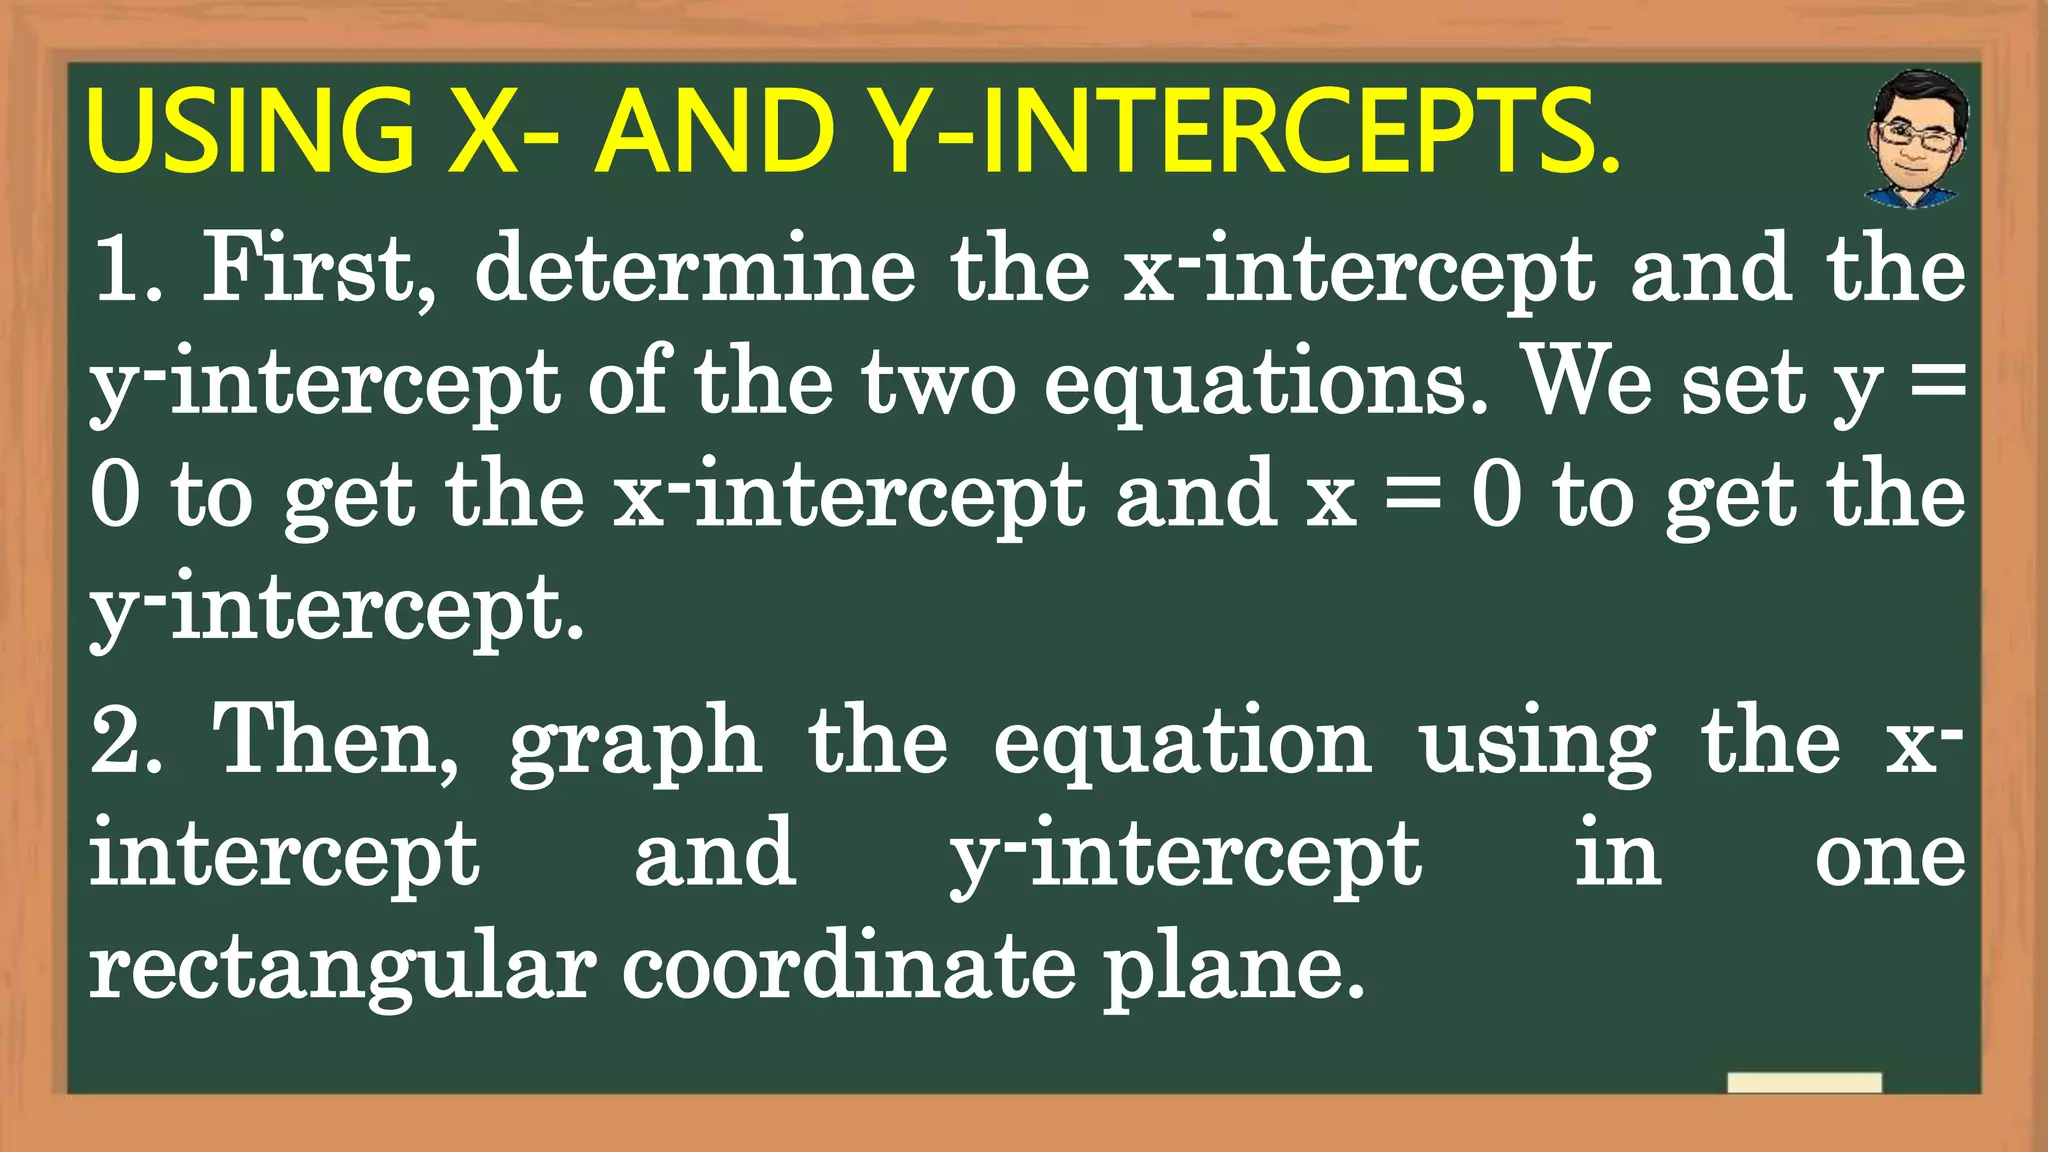
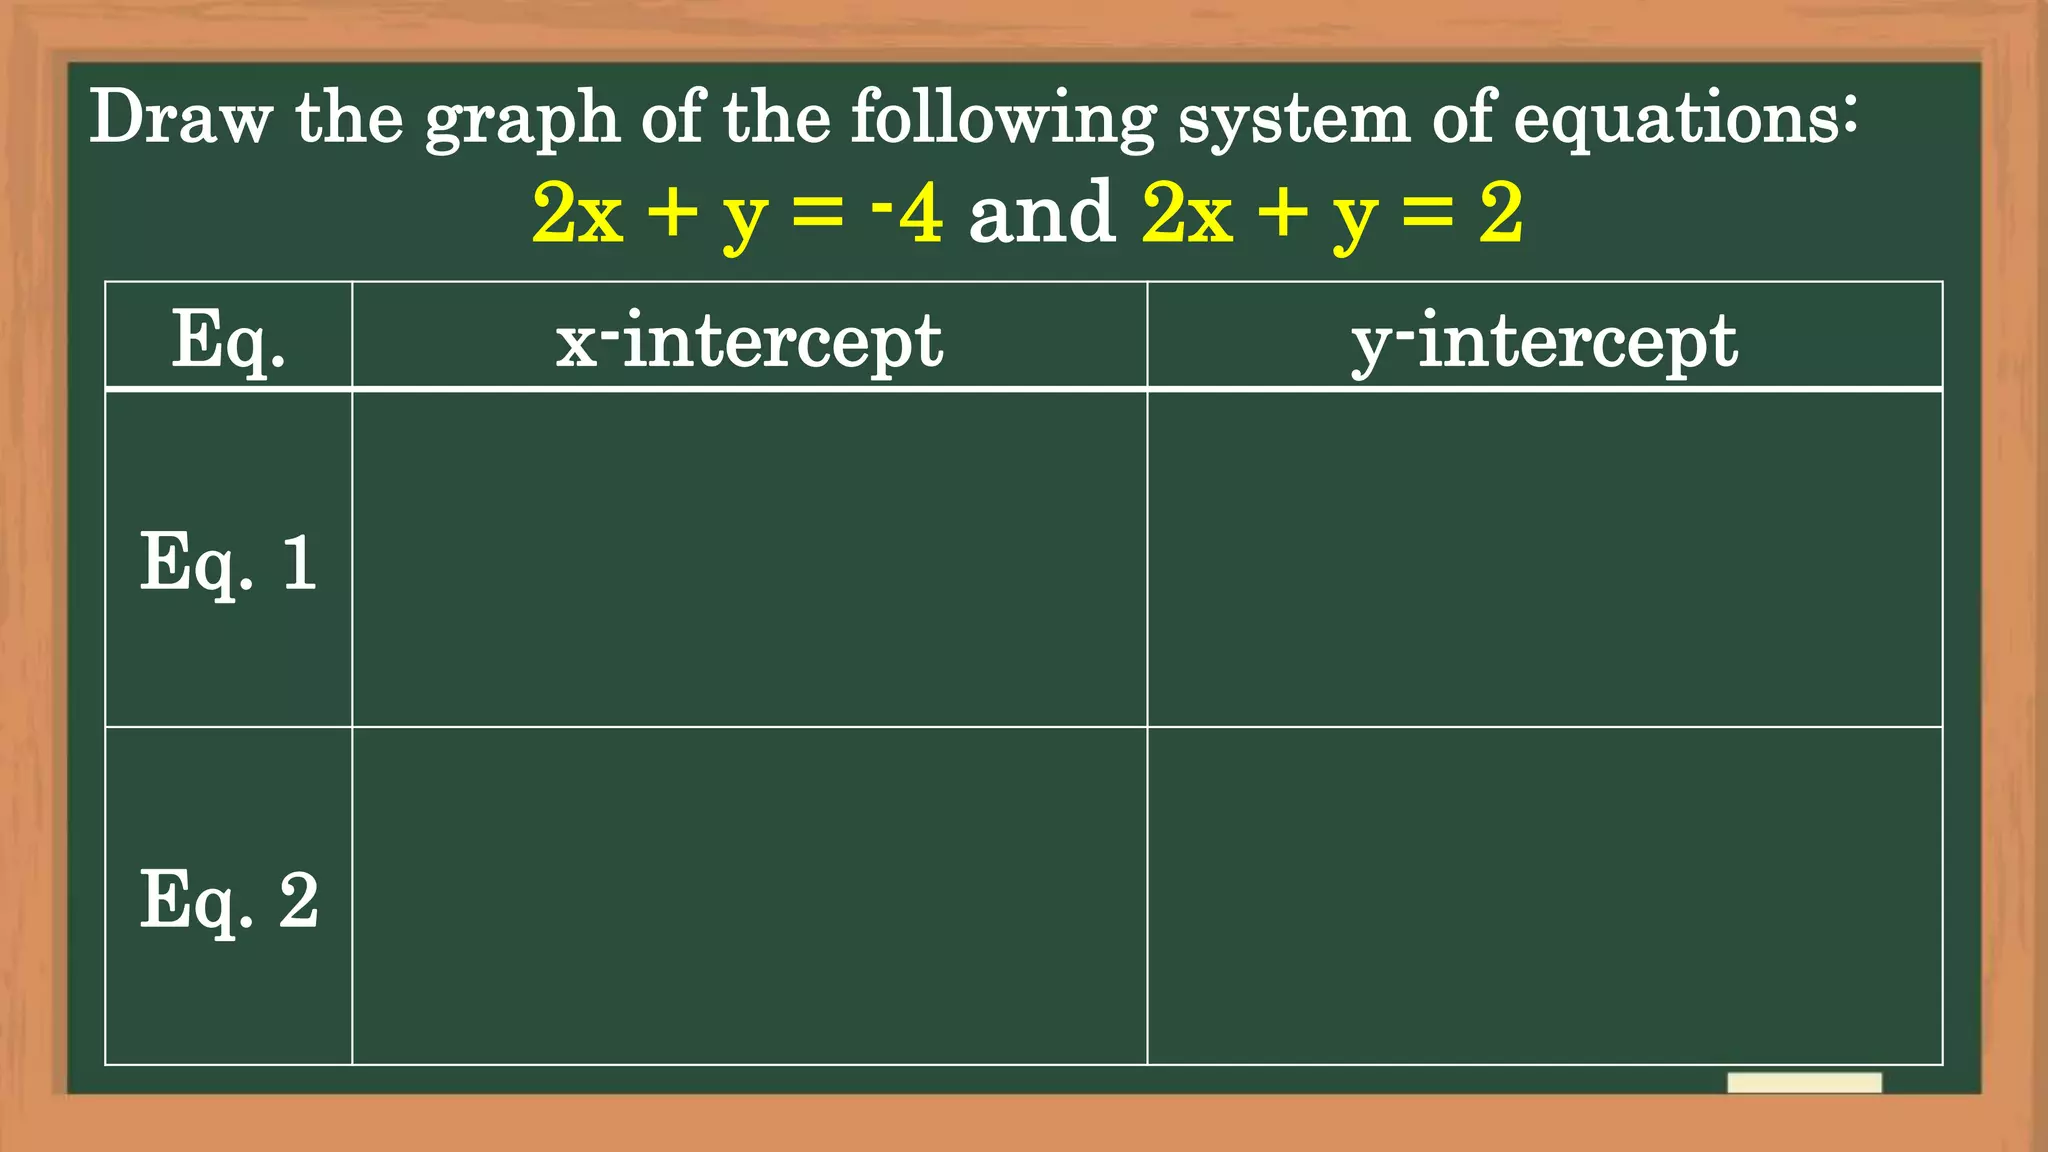
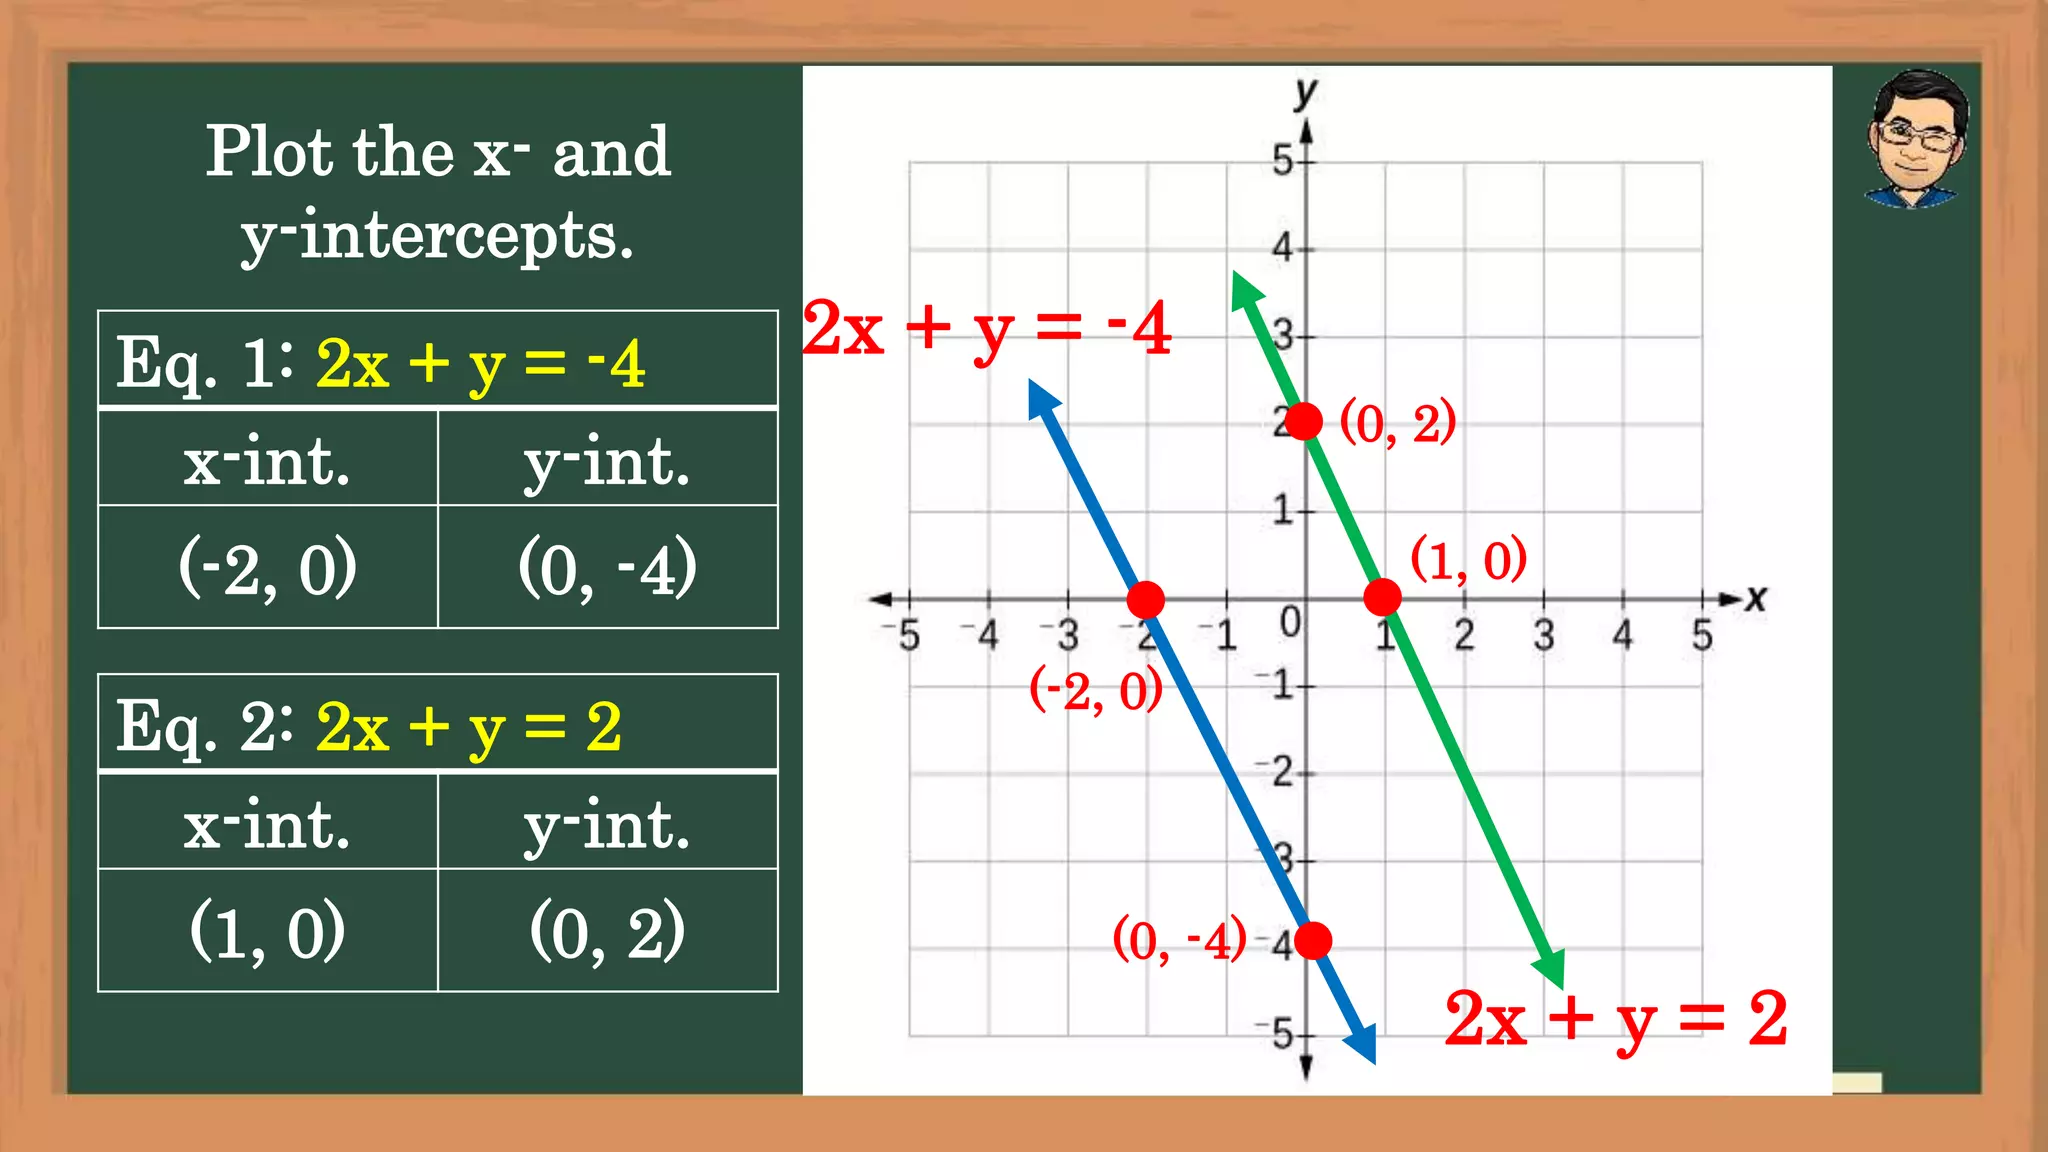
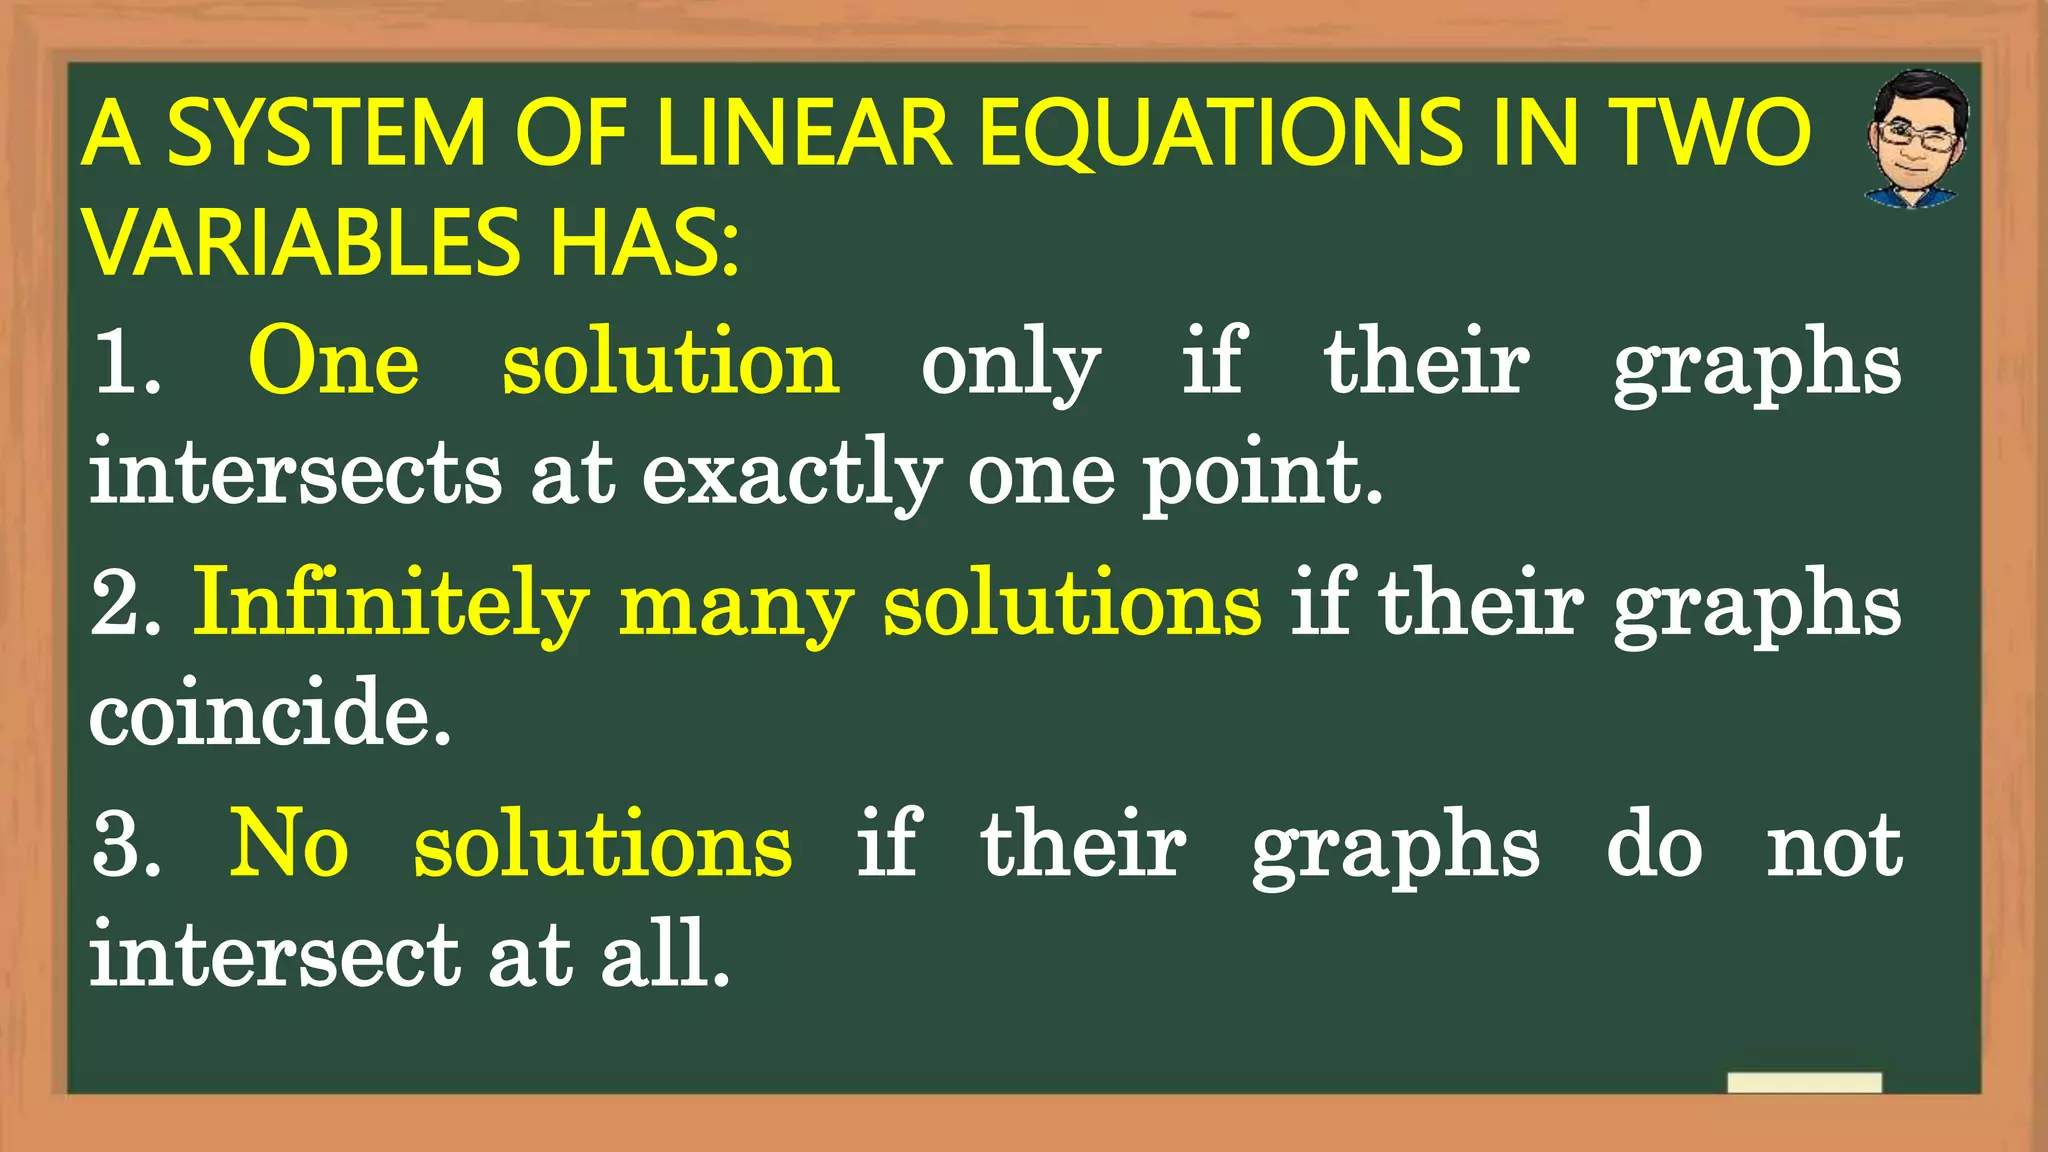
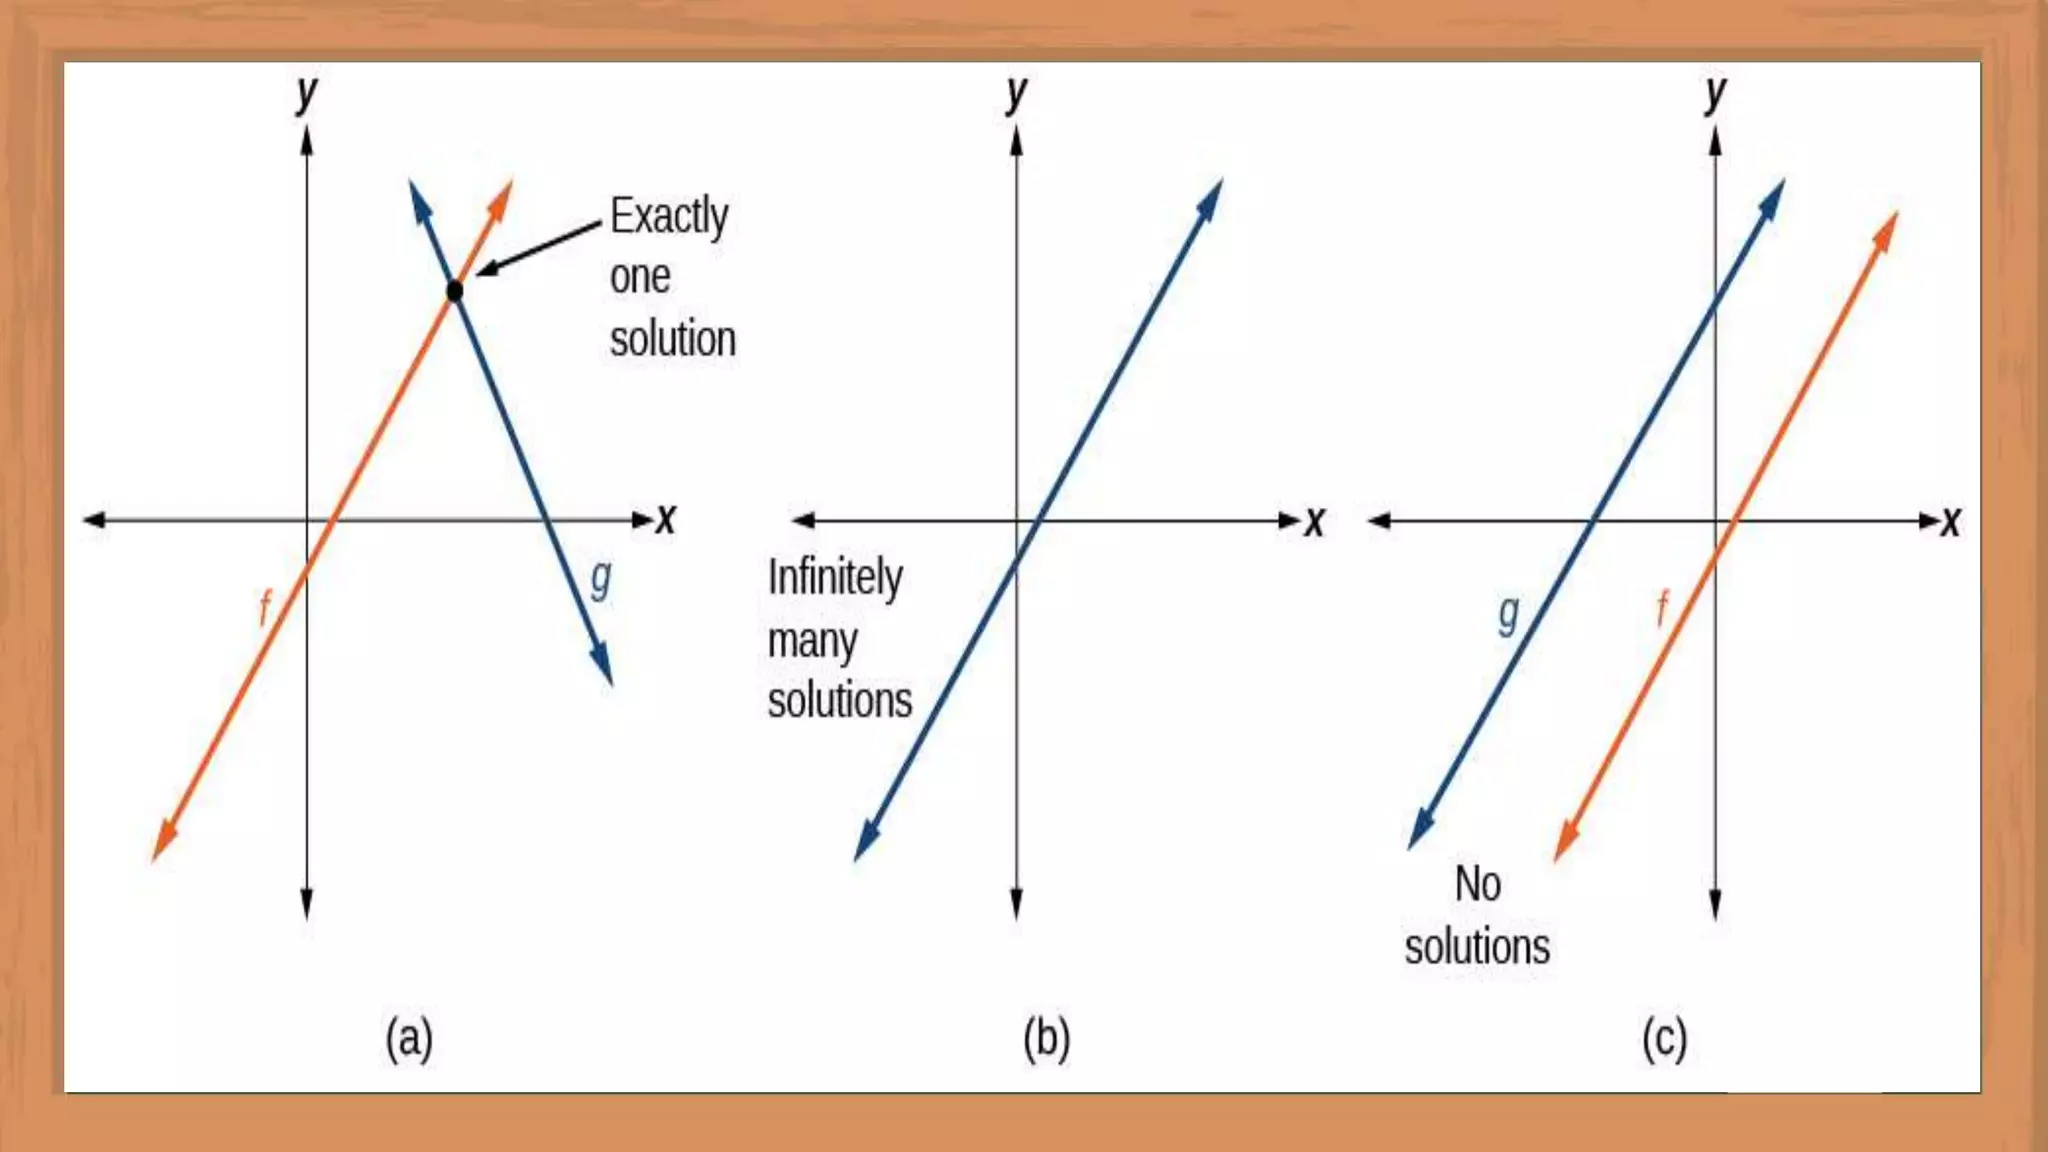
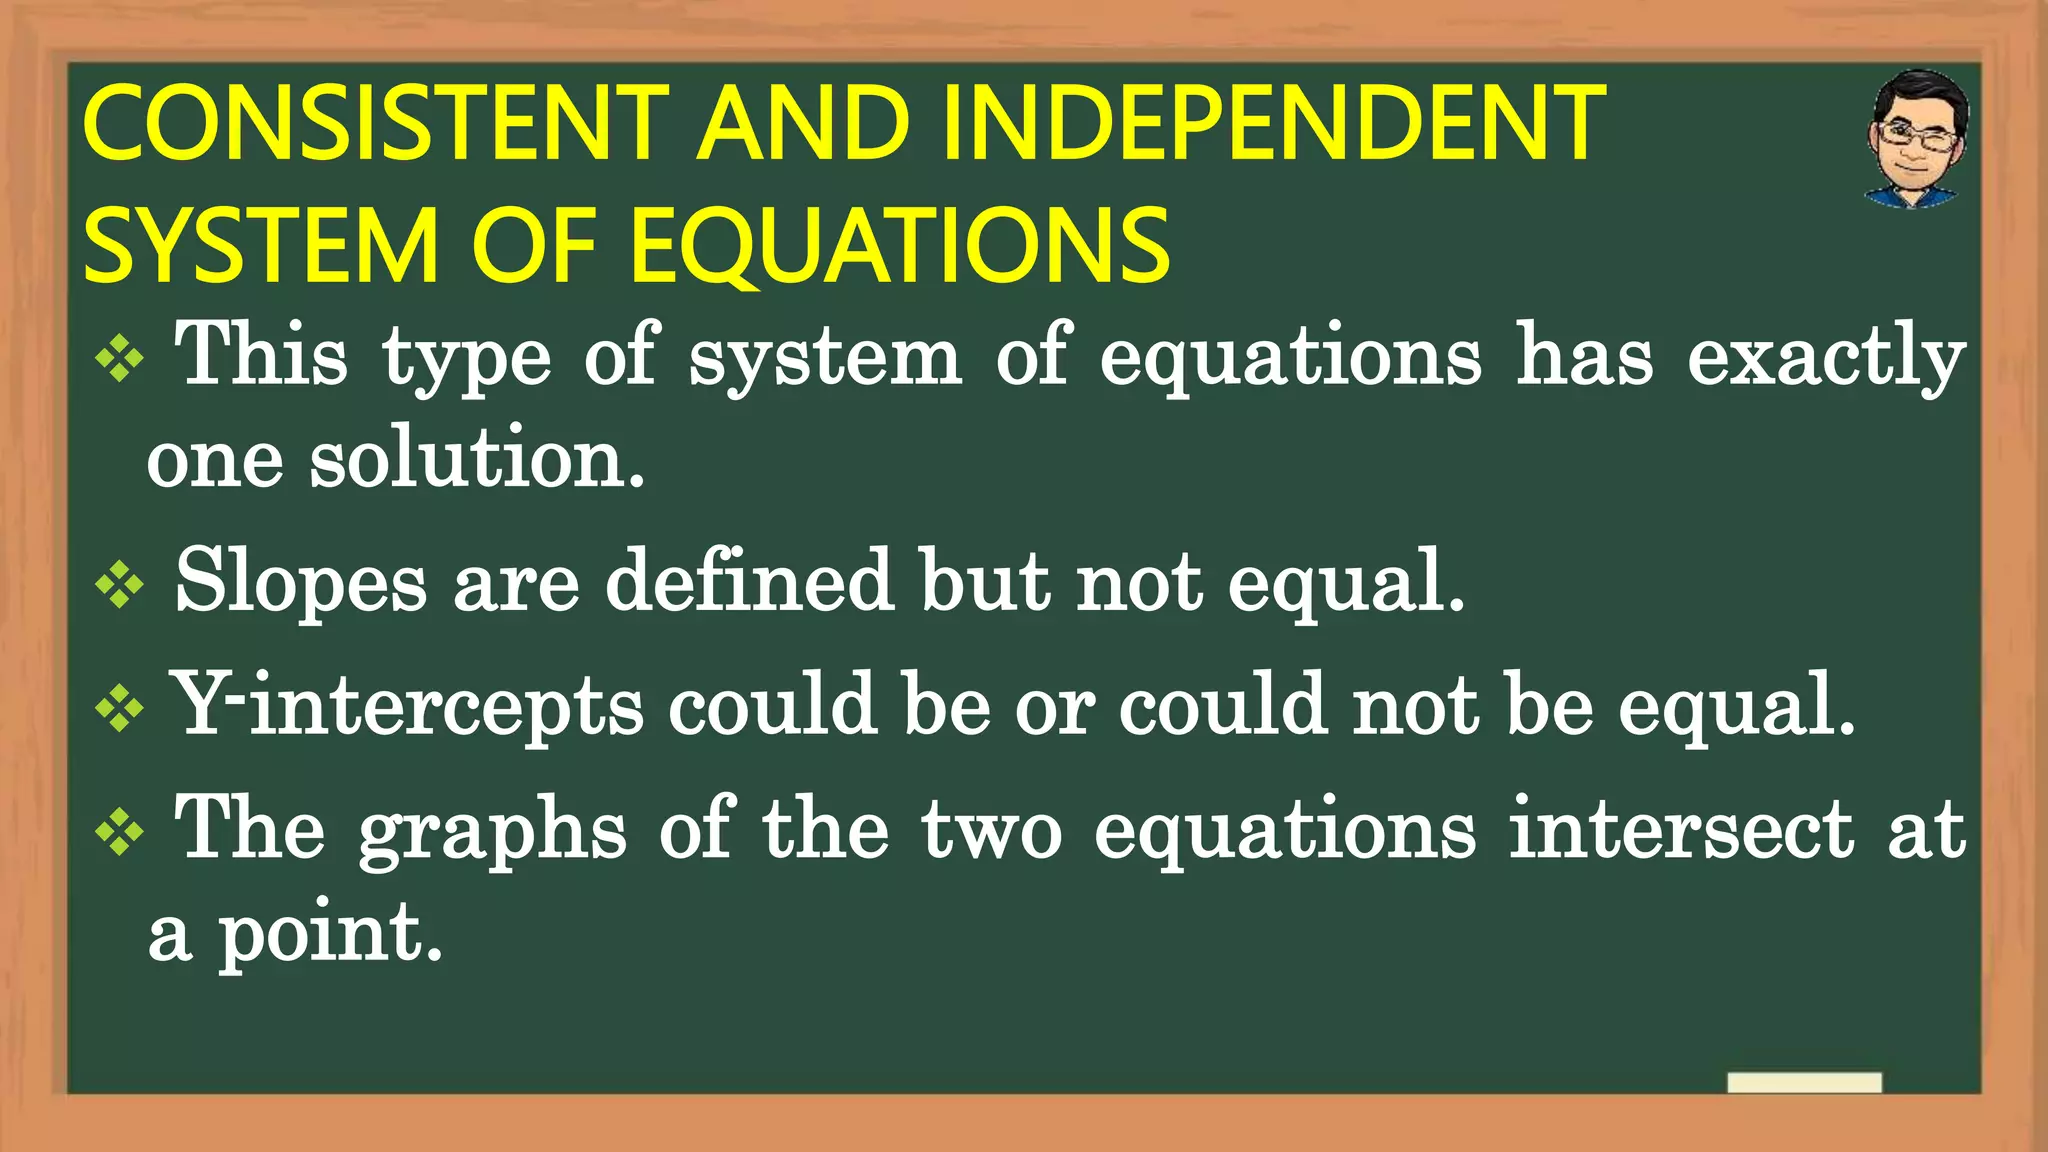
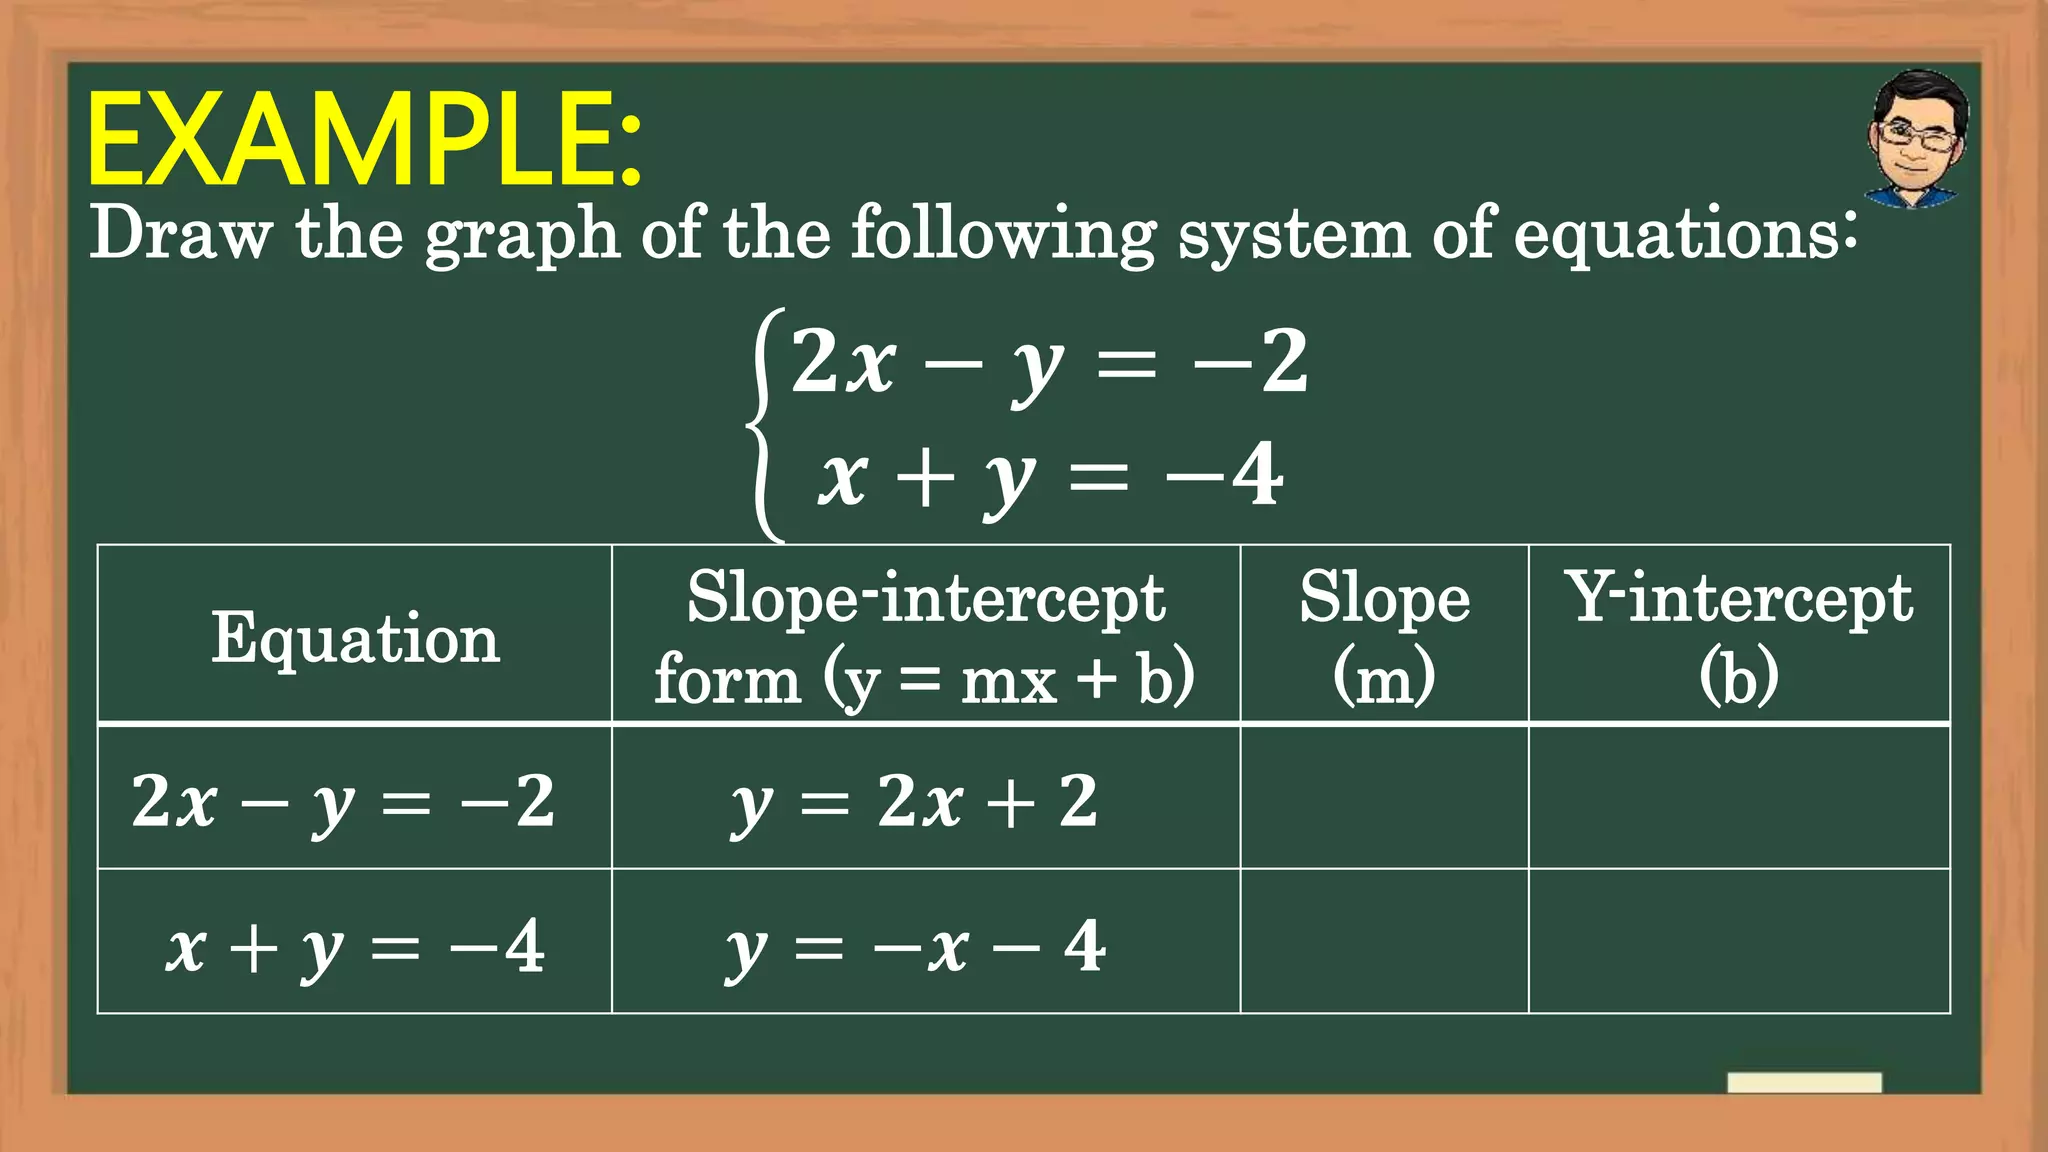
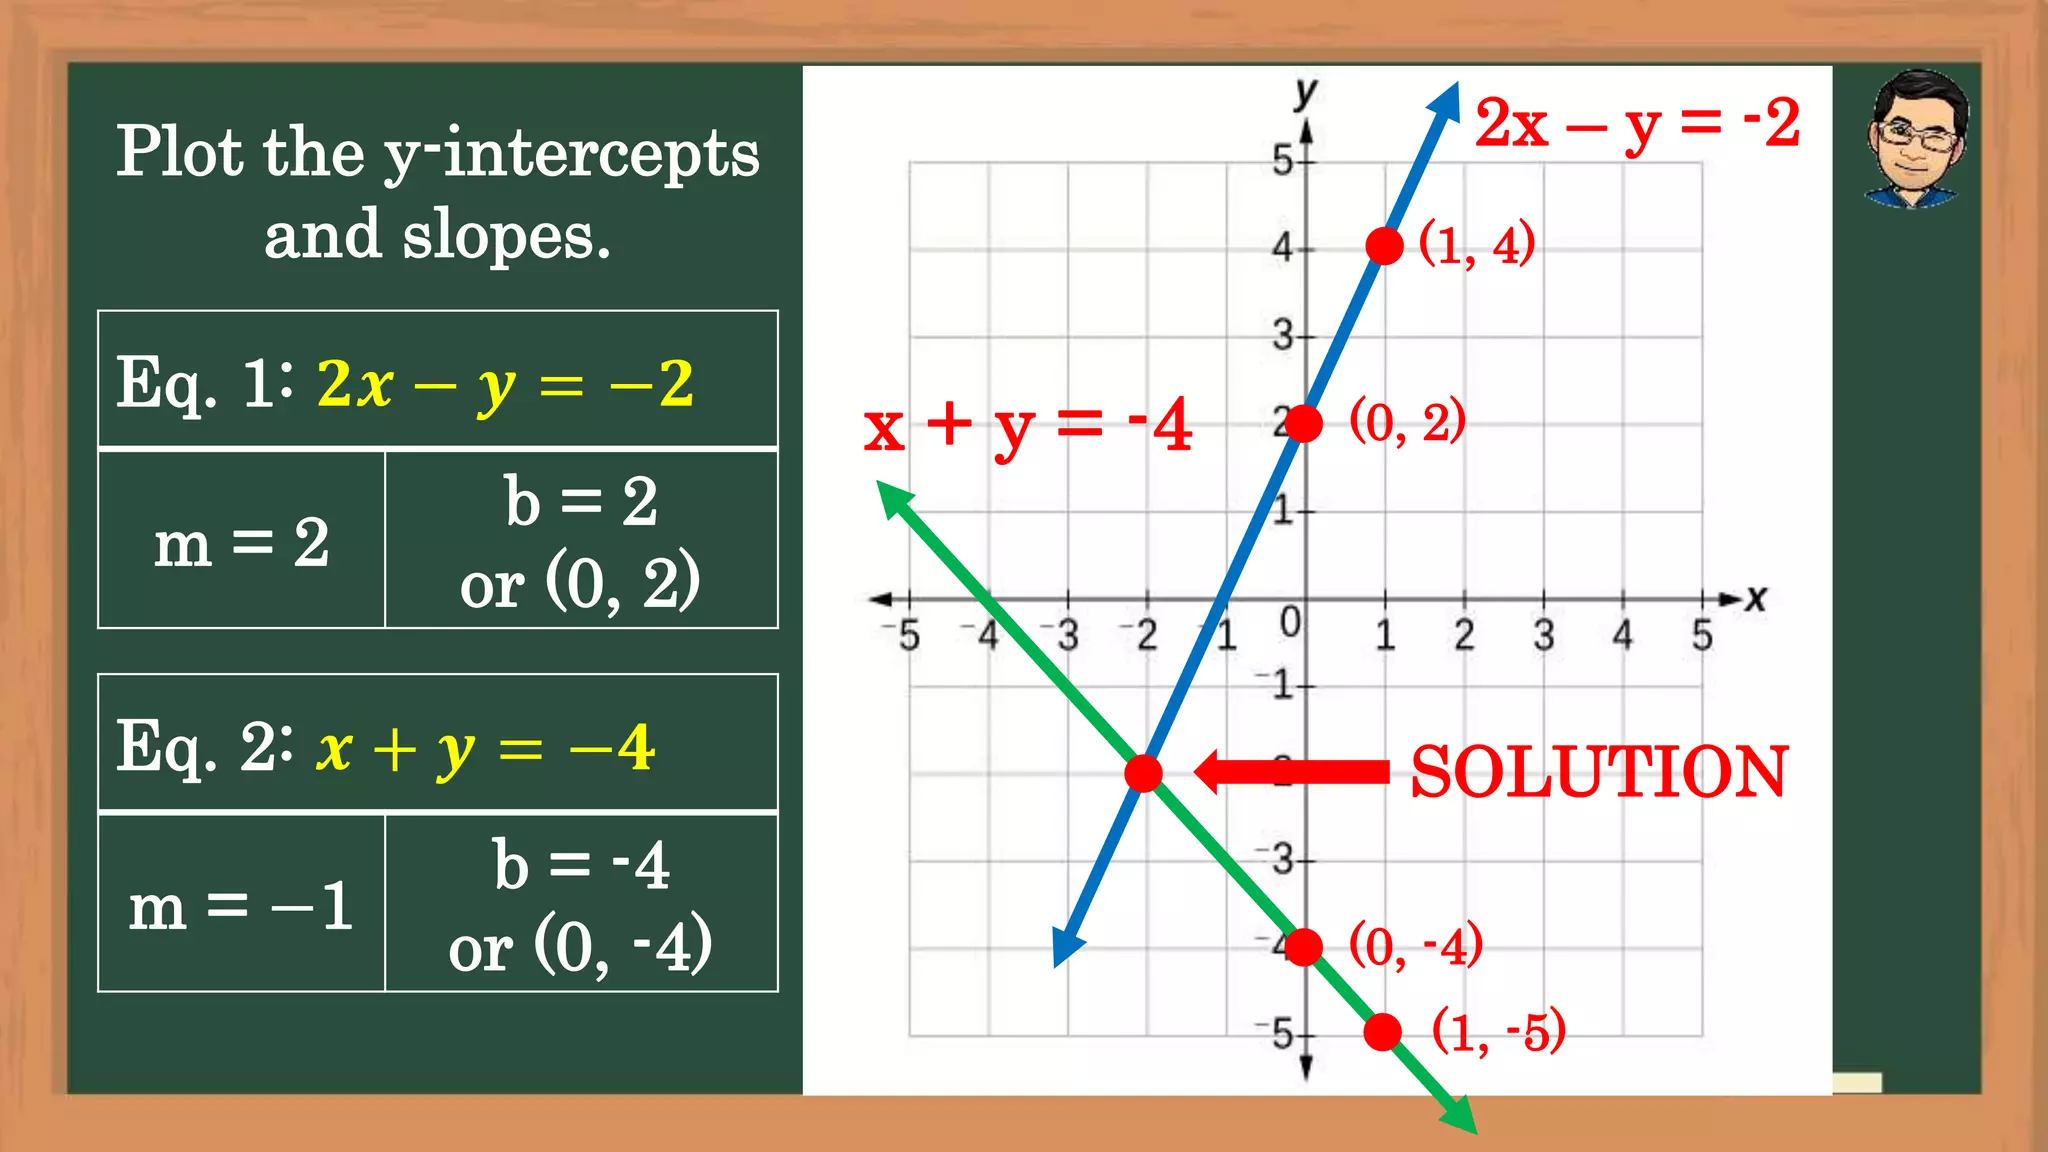
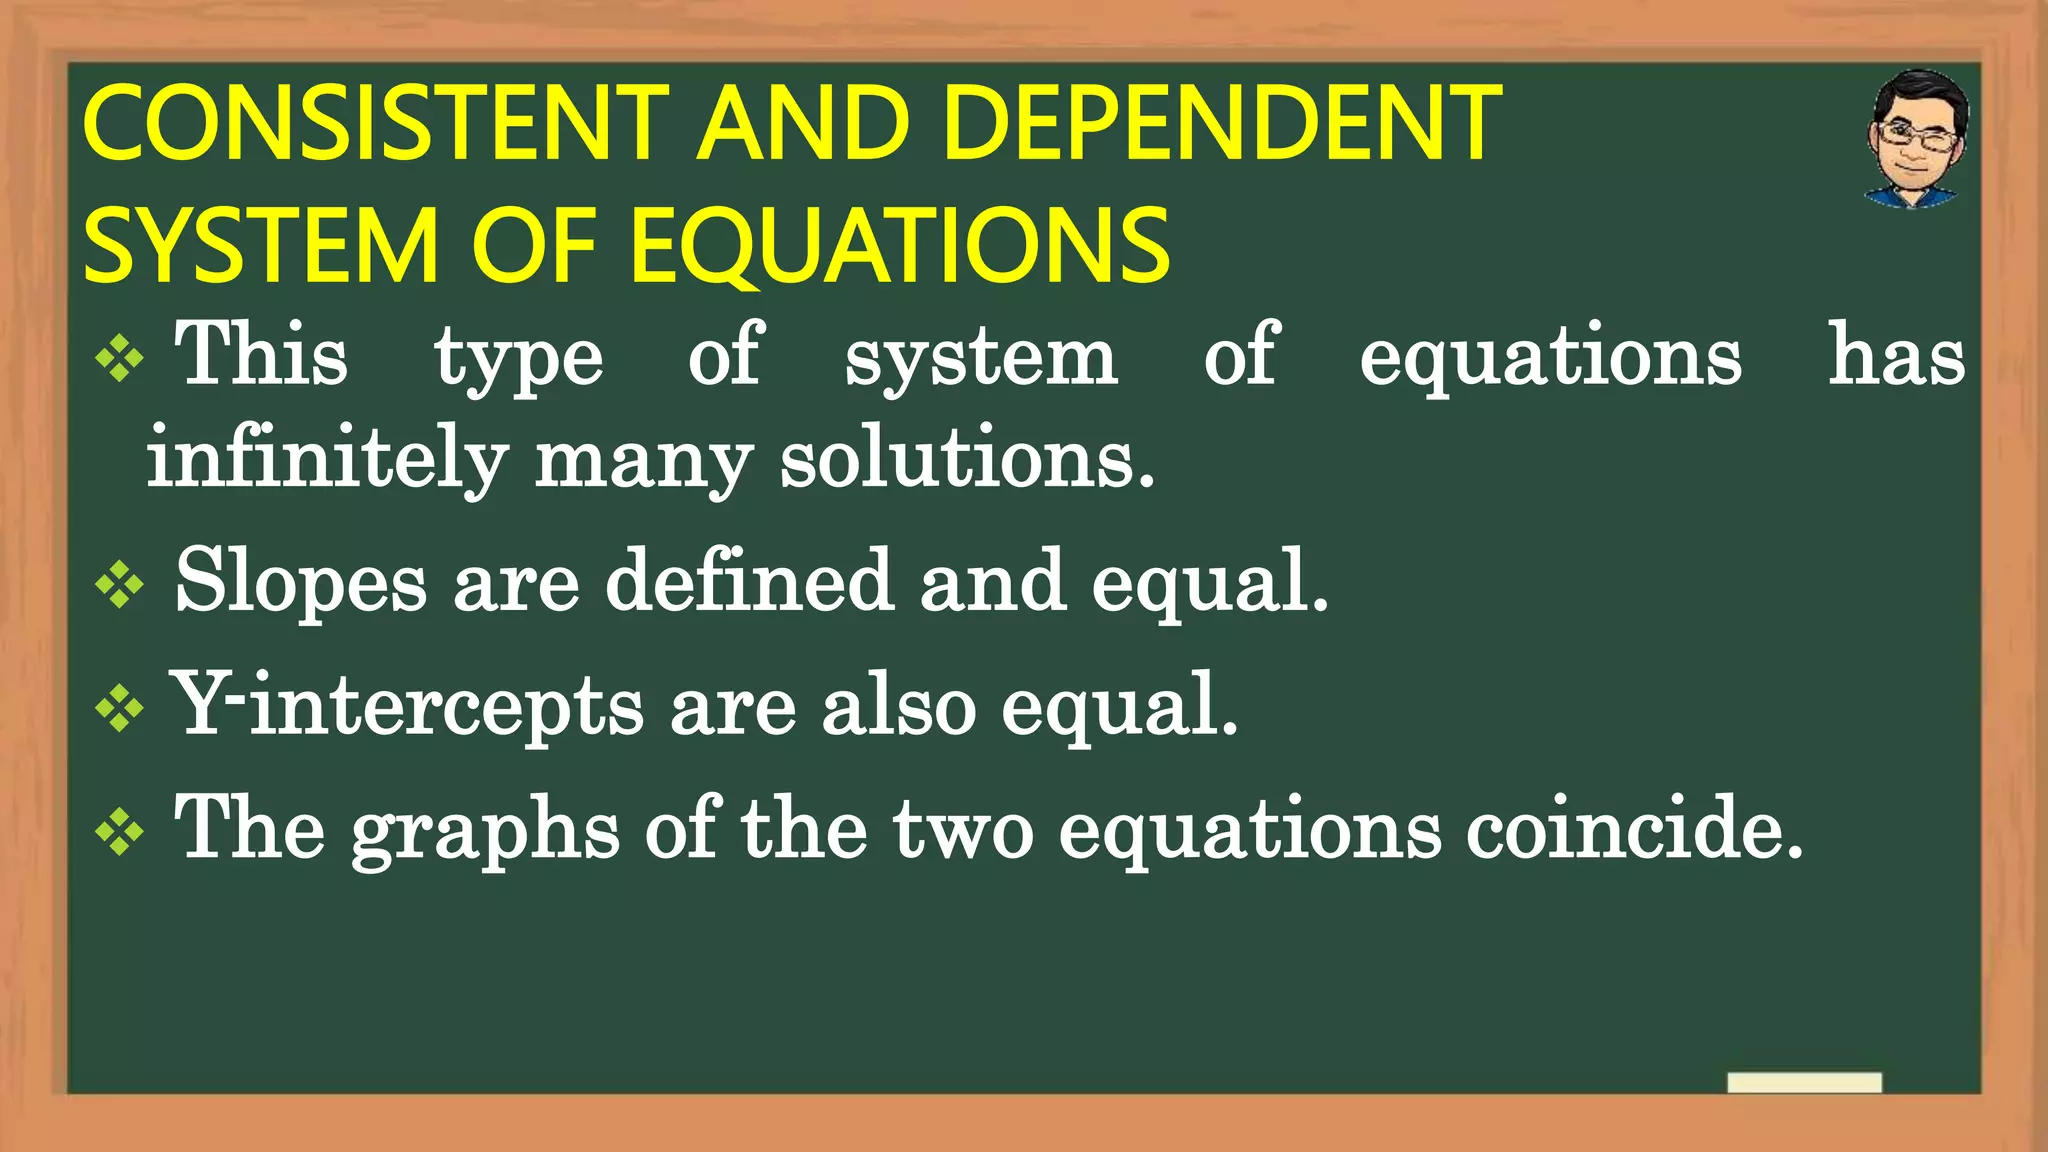
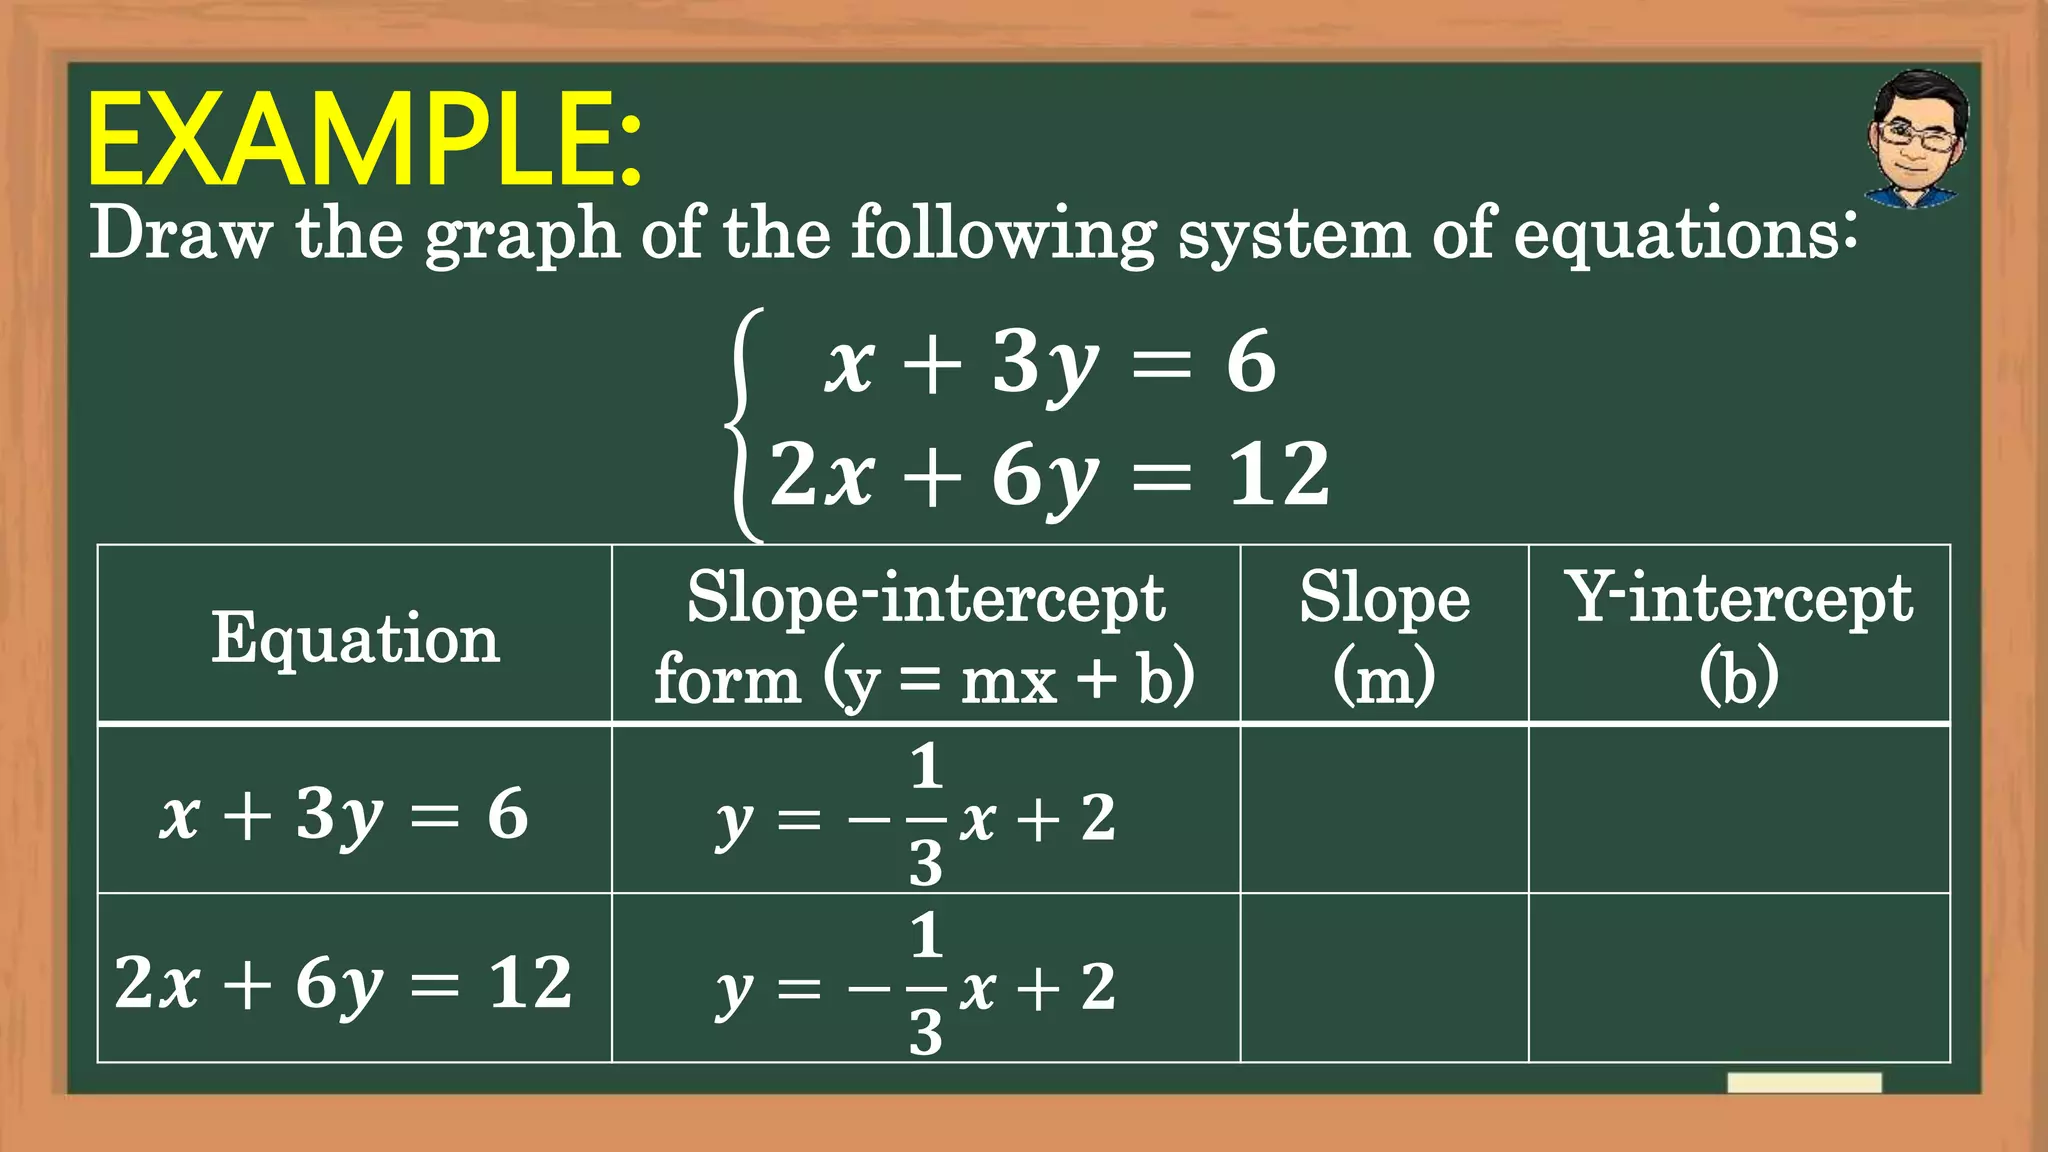
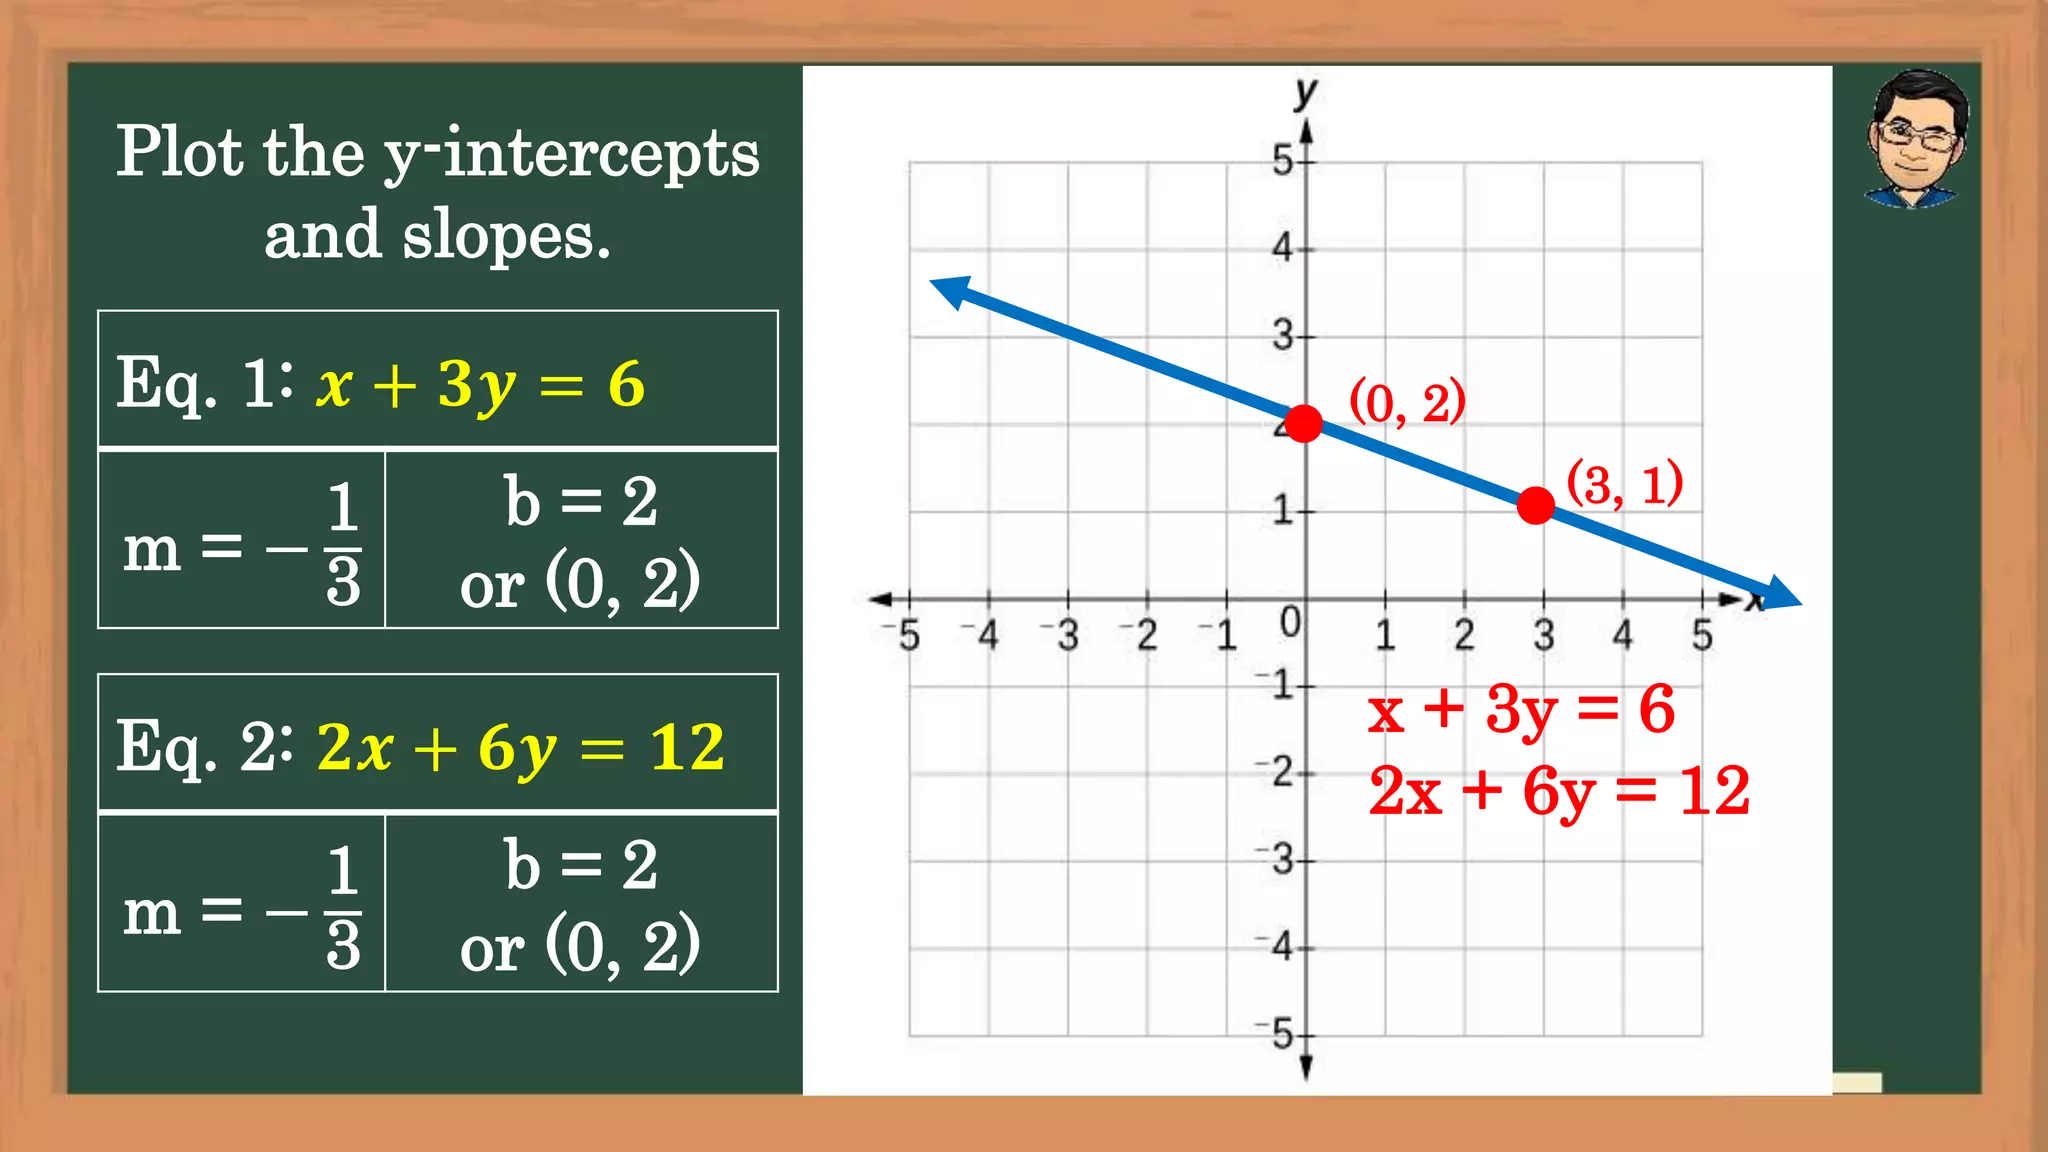
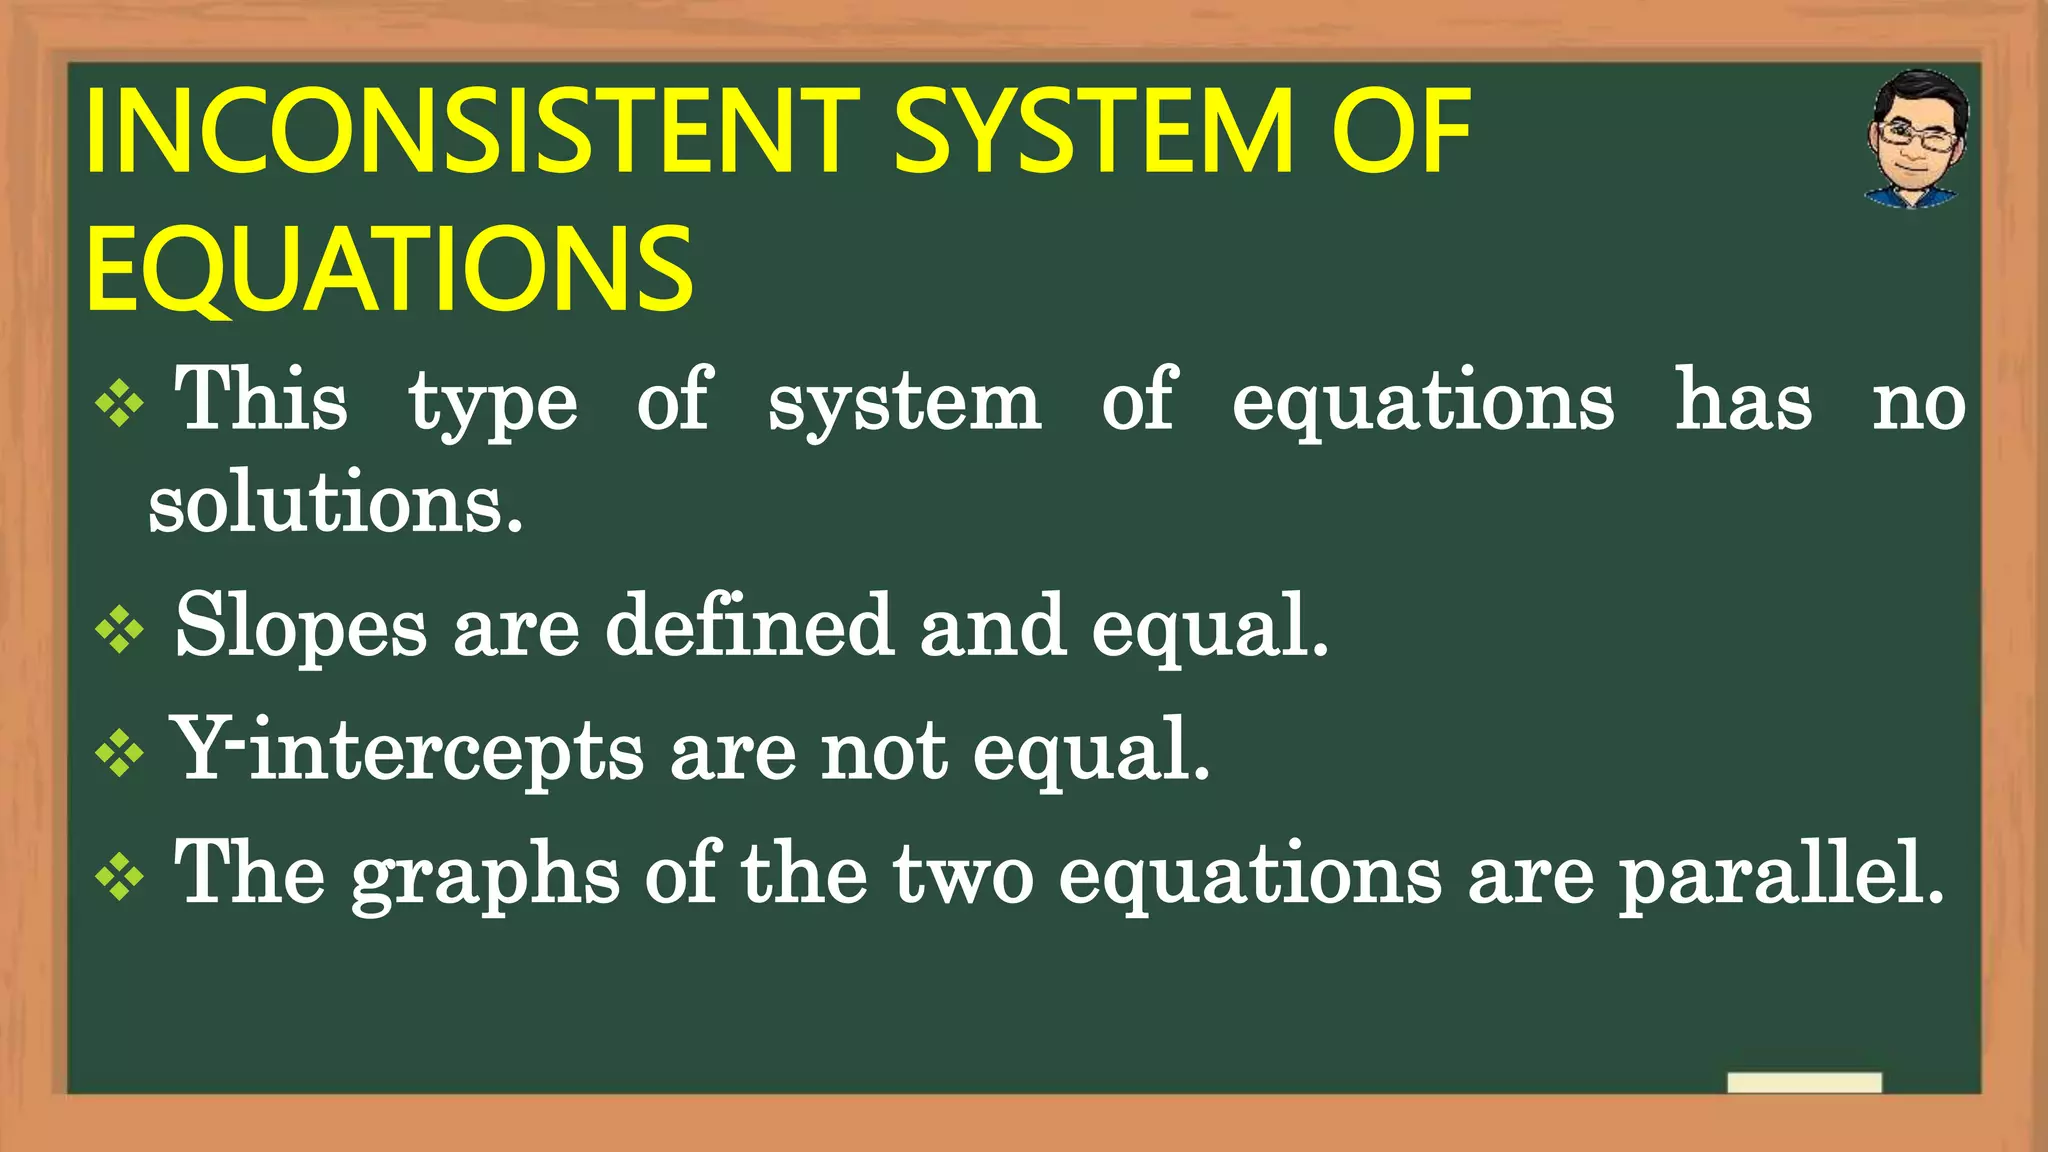
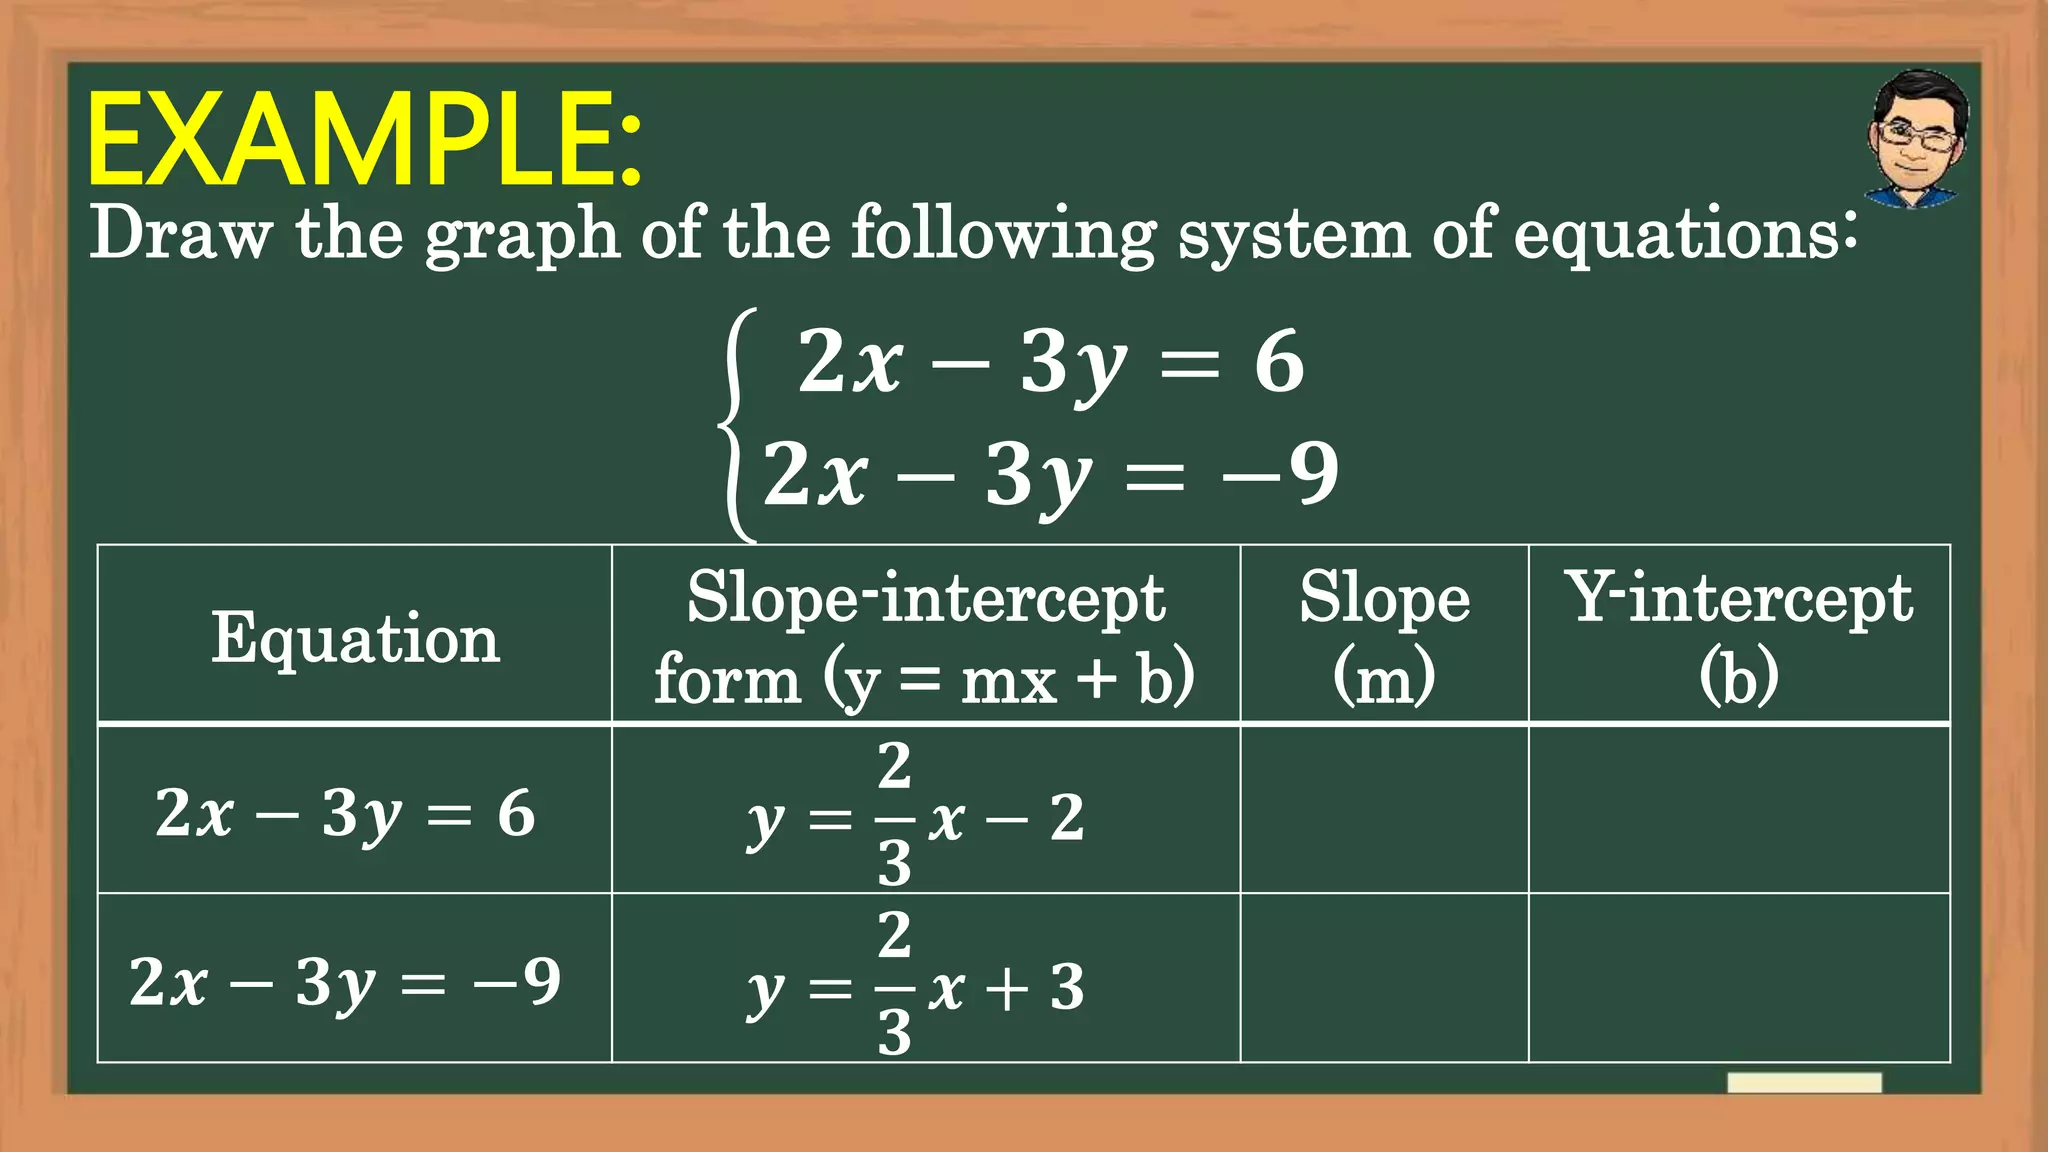
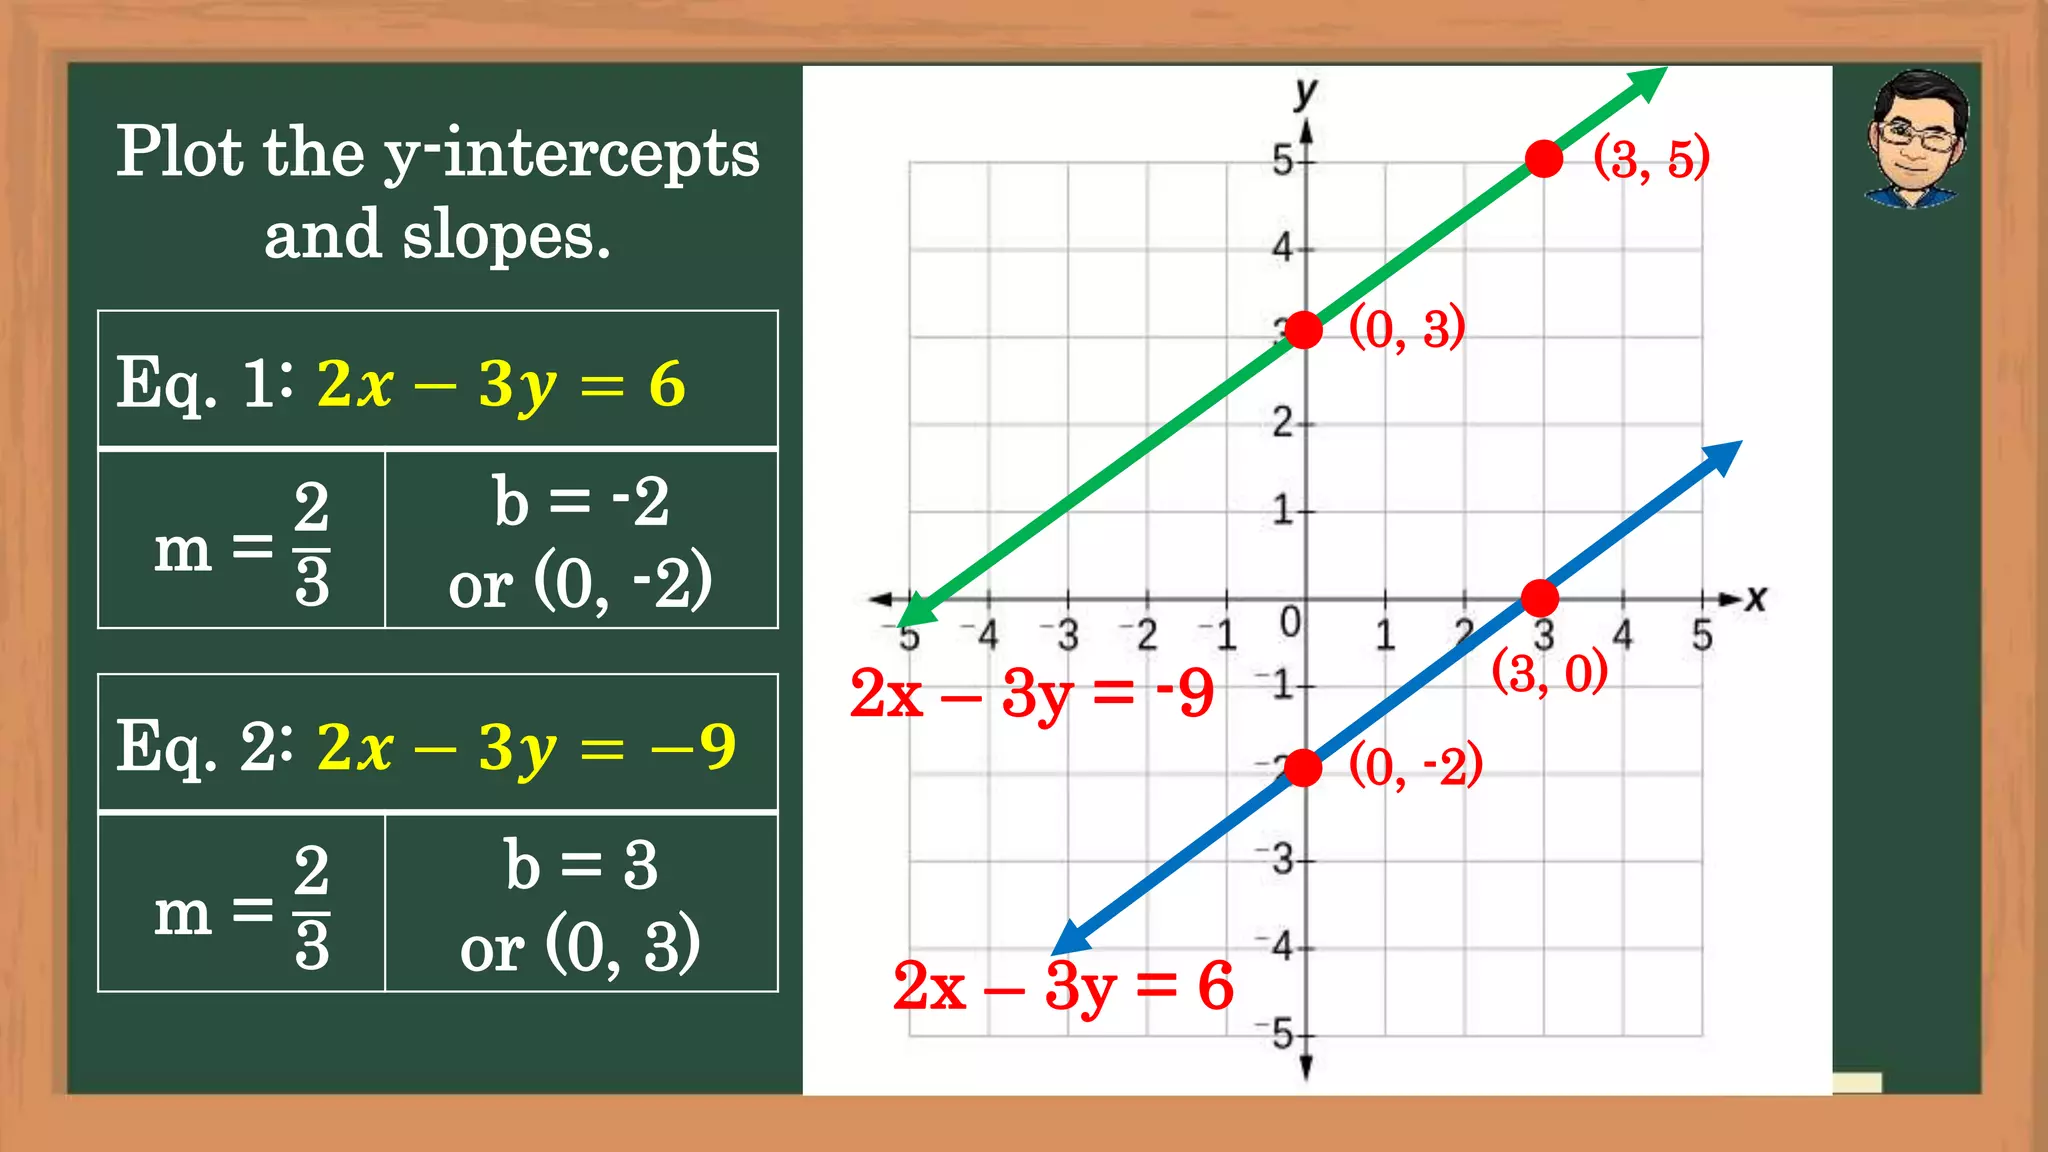
GRAPHS THE SYSTEMS OF LINEAR EQUATIONS IN TWO VARIABLES
Presiding Officer Training module 2024 lok sabha elections
Β
Graphing Systems of Linear Equations
1.
2. LESSON OBJECTIVES:
ο΅ Graph systems of linear equations in two
variables using slope and y-intercept and x-
and y-intercepts methods.
ο΅ Categorize a given system of linear
equations in two variables has graphs that
are parallel, intersecting, and coinciding.
3. USING SLOPE AND Y-INTERCEPT
1. First, determine the slope and the
y-intercept of the two equations.
2. Then, graph the equation using the
slope and y-intercept in one
rectangular coordinate plane.
4. EXAMPLE:
Draw the graph of the following system of equations:
π + π = π
ππ β π = π
Equation
Slope-intercept
form (y = mx + b)
Slope
(m)
Y-intercept
(b)
π + π = π
ππ β π = π
5. Plot the y-intercepts
and slopes.
Eq. 1: x + y = 3
m = -1
b = 3
or (0, 3)
Eq. 2: 2x β y = 4
m = 2
b = -4
or (0, -4)
(0, 3)
(1, 2)
x + y = 3
(0, -4)
(1, -2)
2x β y = 4
6. USING X- AND Y-INTERCEPTS.
1. First, determine the x-intercept and the
y-intercept of the two equations. We set y =
0 to get the x-intercept and x = 0 to get the
y-intercept.
2. Then, graph the equation using the x-
intercept and y-intercept in one
rectangular coordinate plane.
7. Draw the graph of the following system of equations:
2x + y = -4 and 2x + y = 2
Eq. x-intercept y-intercept
Eq. 1
Eq. 2
8. Plot the x- and
y-intercepts.
Eq. 1: 2x + y = -4
x-int. y-int.
(-2, 0) (0, -4)
Eq. 2: 2x + y = 2
x-int. y-int.
(1, 0) (0, 2)
(-2, 0)
(0, 2)
2x + y = 2
(0, -4)
(1, 0)
2x + y = -4
9. A SYSTEM OF LINEAR EQUATIONS IN TWO
VARIABLES HAS:
1. One solution only if their graphs
intersects at exactly one point.
2. Infinitely many solutions if their graphs
coincide.
3. No solutions if their graphs do not
intersect at all.
10.
11. CONSISTENT AND INDEPENDENT
SYSTEM OF EQUATIONS
οΆ This type of system of equations has exactly
one solution.
οΆ Slopes are defined but not equal.
οΆ Y-intercepts could be or could not be equal.
οΆ The graphs of the two equations intersect at
a point.
12. EXAMPLE:
Draw the graph of the following system of equations:
ππ β π = βπ
π + π = βπ
Equation
Slope-intercept
form (y = mx + b)
Slope
(m)
Y-intercept
(b)
ππ β π = βπ π = ππ + π
π + π = β4 π = βπ β π
13. Plot the y-intercepts
and slopes.
Eq. 1: ππ β π = βπ
m = 2
b = 2
or (0, 2)
Eq. 2: π + π = βπ
m = β1
b = -4
or (0, -4)
(0, 2)
(1, 4)
2x β y = -2
(1, -5)
(0, -4)
x + y = -4
SOLUTION
14. CONSISTENT AND DEPENDENT
SYSTEM OF EQUATIONS
οΆ This type of system of equations has
infinitely many solutions.
οΆ Slopes are defined and equal.
οΆ Y-intercepts are also equal.
οΆ The graphs of the two equations coincide.
15. EXAMPLE:
Draw the graph of the following system of equations:
π + ππ = π
ππ + ππ = ππ
Equation
Slope-intercept
form (y = mx + b)
Slope
(m)
Y-intercept
(b)
π + ππ = π π = β
π
π
π + π
ππ + ππ = ππ π = β
π
π
π + π
16. Plot the y-intercepts
and slopes.
Eq. 1: π + ππ = π
m = β
1
3
b = 2
or (0, 2)
Eq. 2: ππ + ππ = ππ
m = β
1
3
b = 2
or (0, 2)
(0, 2)
(3, 1)
x + 3y = 6
2x + 6y = 12
17. INCONSISTENT SYSTEM OF
EQUATIONS
οΆ This type of system of equations has no
solutions.
οΆ Slopes are defined and equal.
οΆ Y-intercepts are not equal.
οΆ The graphs of the two equations are parallel.
18. EXAMPLE:
Draw the graph of the following system of equations:
ππ β ππ = π
ππ β ππ = βπ
Equation
Slope-intercept
form (y = mx + b)
Slope
(m)
Y-intercept
(b)
ππ β ππ = π π =
π
π
π β π
ππ β ππ = βπ π =
π
π
π + π
19. Plot the y-intercepts
and slopes.
Eq. 1: ππ β ππ = π
m =
2
3
b = -2
or (0, -2)
Eq. 2: ππ β ππ = βπ
m =
2
3
b = 3
or (0, 3)
(0, -2)
(3, 0)
2x β 3y = 6
(3, 5)
(0, 3)
2x β 3y = -9