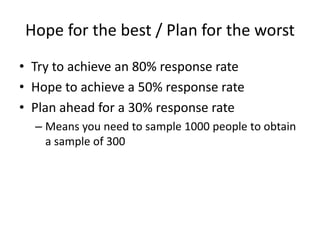
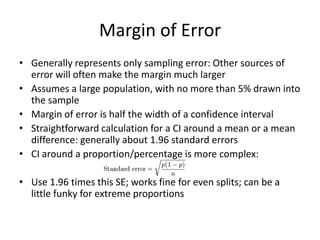
Sample Size ConsiderationsCARMA Internet Research ModuleJeff Stanton
Key ConsiderationsSample size versus response rate – planning for the number of usable data points you will actually obtainAttrition – Repeated measures, panel designs, and diary studies all lose participants over timeStatistical power – ability to draw inferences from the sample obtainedMargin of error – to the extent that the resulting statistics must be projectable to the larger population
May 15-17, 2008Internet Data Collection Methods (Day 2-3)Response Rate Reminder70%65%60%55%50%45%40%19751995Academic Surveys
Hope for the best / Plan for the worstTry to achieve an 80% response rateHope to achieve a 50% response ratePlan ahead for a 30% response rateMeans you need to sample 1000 people to obtain a sample of 300
Bad DataUnproctored, anonymous self report instruments generally have a higher percentage of:Unusual outliersMissing dataCarelessly entered dataIntentionally sabotaged dataAnother aspect of dealing with nonresponse is to anticipate, prepare for, and deal with item level data losses
Attrition
The Best Articles on Statistical PowerCohen, J. (1992). "A power primer." Psychological bulletin 112(1): 155-159.Cohen, J. (1992). "Statistical power analysis." Current Directions in Psychological Science: 98-101.Kraemer, H. and S. Thiemann (1987). How many subjects?: Statistical power analysis in research, Sage Publications, Inc.
May 15-17, 2008Internet Data Collection Methods (Day 2-8)Sample Size “Guestimates”(With apologies to Jacob Cohen)
May 15-17, 2008Internet Data Collection Methods (Day 2-9)Estimating Effect Size(Also with apologies to Jacob Cohen)Mean differences, calibrated in standard deviations: Large = .8+, Medium = .5, Small = .2Multiple regression, size of R-squared: Large =.35+, Medium = .15, Small = .02Chi-square, calibrated in the difference between null and alternate population proportions: Large = . 50, Medium = .30, Small = .10
Margin of ErrorGenerally represents only sampling error: Other sources of error will often make the margin much largerAssumes a large population, with no more than 5% drawn into the sampleMargin of error is half the width of a confidence intervalStraightforward calculation for a CI around a mean or a mean difference: generally about 1.96 standard errorsCI around a proportion/percentage is more complex:Use 1.96 times this SE; works fine for even splits; can be a little funky for extreme proportions
Margin of Error Calculatorshttp://www.raosoft.com/samplesize.htmlTrades off sample size and margin of errorhttp://www.surveysystem.com/sscalc.htmExplains terminologyhttp://faculty.vassar.edu/lowry/polls/calcs.htmlVarious tools for assessing poll datahttp://glass.ed.asu.edu/stats/analysis/rci.htmlConfidence intervals for correlationshttp://www.stat.tamu.edu/~jhardin/applets/signed/case11.htmlJava-based applet
An Overall Sampling PlanEstimate the expected effect size for the most important tests you plan to conductFor inferential testing, use power estimation tools to plan sample sizeFor projectability, use margin of error tools to plan sample sizeTake into account item level data loss due to bad dataTake attrition into account for longitudinal designsTake overall response rate into account for all types of designsDetermine overall initial sample size based on all of the factors listed above

Carma internet research module sample size considerations

  • 1.
    Sample Size ConsiderationsCARMAInternet Research ModuleJeff Stanton
  • 2.
    Key ConsiderationsSample sizeversus response rate – planning for the number of usable data points you will actually obtainAttrition – Repeated measures, panel designs, and diary studies all lose participants over timeStatistical power – ability to draw inferences from the sample obtainedMargin of error – to the extent that the resulting statistics must be projectable to the larger population
  • 3.
    May 15-17, 2008InternetData Collection Methods (Day 2-3)Response Rate Reminder70%65%60%55%50%45%40%19751995Academic Surveys
  • 4.
    Hope for thebest / Plan for the worstTry to achieve an 80% response rateHope to achieve a 50% response ratePlan ahead for a 30% response rateMeans you need to sample 1000 people to obtain a sample of 300
  • 5.
    Bad DataUnproctored, anonymousself report instruments generally have a higher percentage of:Unusual outliersMissing dataCarelessly entered dataIntentionally sabotaged dataAnother aspect of dealing with nonresponse is to anticipate, prepare for, and deal with item level data losses
  • 6.
  • 7.
    The Best Articleson Statistical PowerCohen, J. (1992). "A power primer." Psychological bulletin 112(1): 155-159.Cohen, J. (1992). "Statistical power analysis." Current Directions in Psychological Science: 98-101.Kraemer, H. and S. Thiemann (1987). How many subjects?: Statistical power analysis in research, Sage Publications, Inc.
  • 8.
    May 15-17, 2008InternetData Collection Methods (Day 2-8)Sample Size “Guestimates”(With apologies to Jacob Cohen)
  • 9.
    May 15-17, 2008InternetData Collection Methods (Day 2-9)Estimating Effect Size(Also with apologies to Jacob Cohen)Mean differences, calibrated in standard deviations: Large = .8+, Medium = .5, Small = .2Multiple regression, size of R-squared: Large =.35+, Medium = .15, Small = .02Chi-square, calibrated in the difference between null and alternate population proportions: Large = . 50, Medium = .30, Small = .10
  • 10.
    Margin of ErrorGenerallyrepresents only sampling error: Other sources of error will often make the margin much largerAssumes a large population, with no more than 5% drawn into the sampleMargin of error is half the width of a confidence intervalStraightforward calculation for a CI around a mean or a mean difference: generally about 1.96 standard errorsCI around a proportion/percentage is more complex:Use 1.96 times this SE; works fine for even splits; can be a little funky for extreme proportions
  • 11.
    Margin of ErrorCalculatorshttp://www.raosoft.com/samplesize.htmlTrades off sample size and margin of errorhttp://www.surveysystem.com/sscalc.htmExplains terminologyhttp://faculty.vassar.edu/lowry/polls/calcs.htmlVarious tools for assessing poll datahttp://glass.ed.asu.edu/stats/analysis/rci.htmlConfidence intervals for correlationshttp://www.stat.tamu.edu/~jhardin/applets/signed/case11.htmlJava-based applet
  • 12.
    An Overall SamplingPlanEstimate the expected effect size for the most important tests you plan to conductFor inferential testing, use power estimation tools to plan sample sizeFor projectability, use margin of error tools to plan sample sizeTake into account item level data loss due to bad dataTake attrition into account for longitudinal designsTake overall response rate into account for all types of designsDetermine overall initial sample size based on all of the factors listed above