The document discusses visual design considerations for survey design, including:
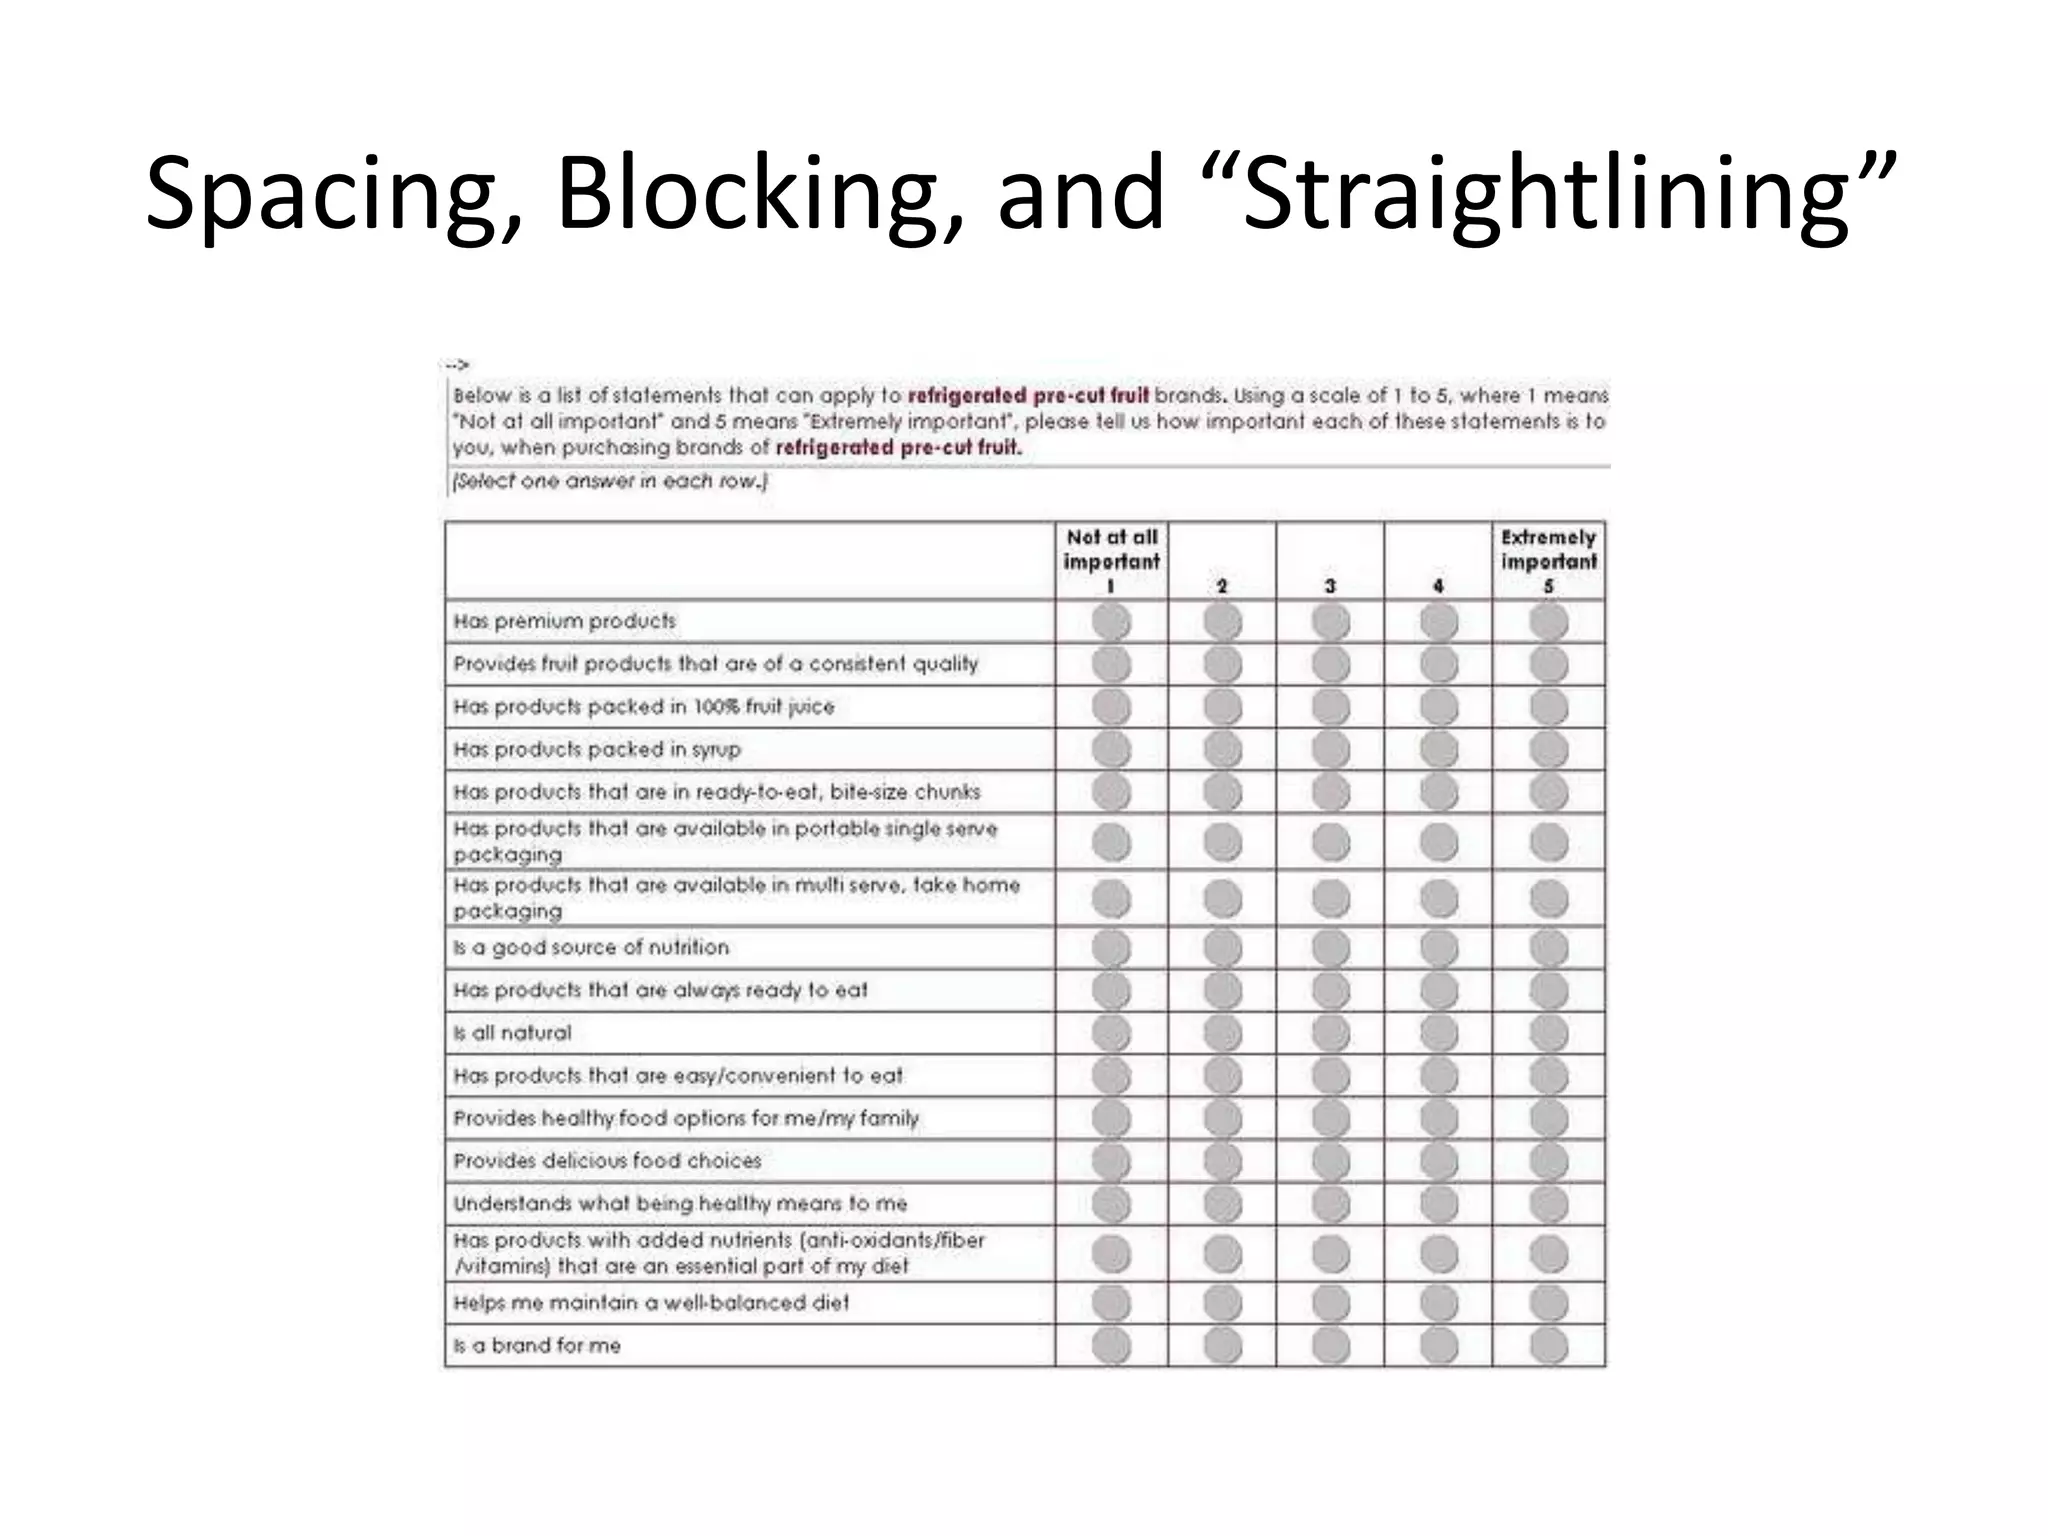
1) Goals of maximizing reward for participants while minimizing costs, reducing errors and biases.
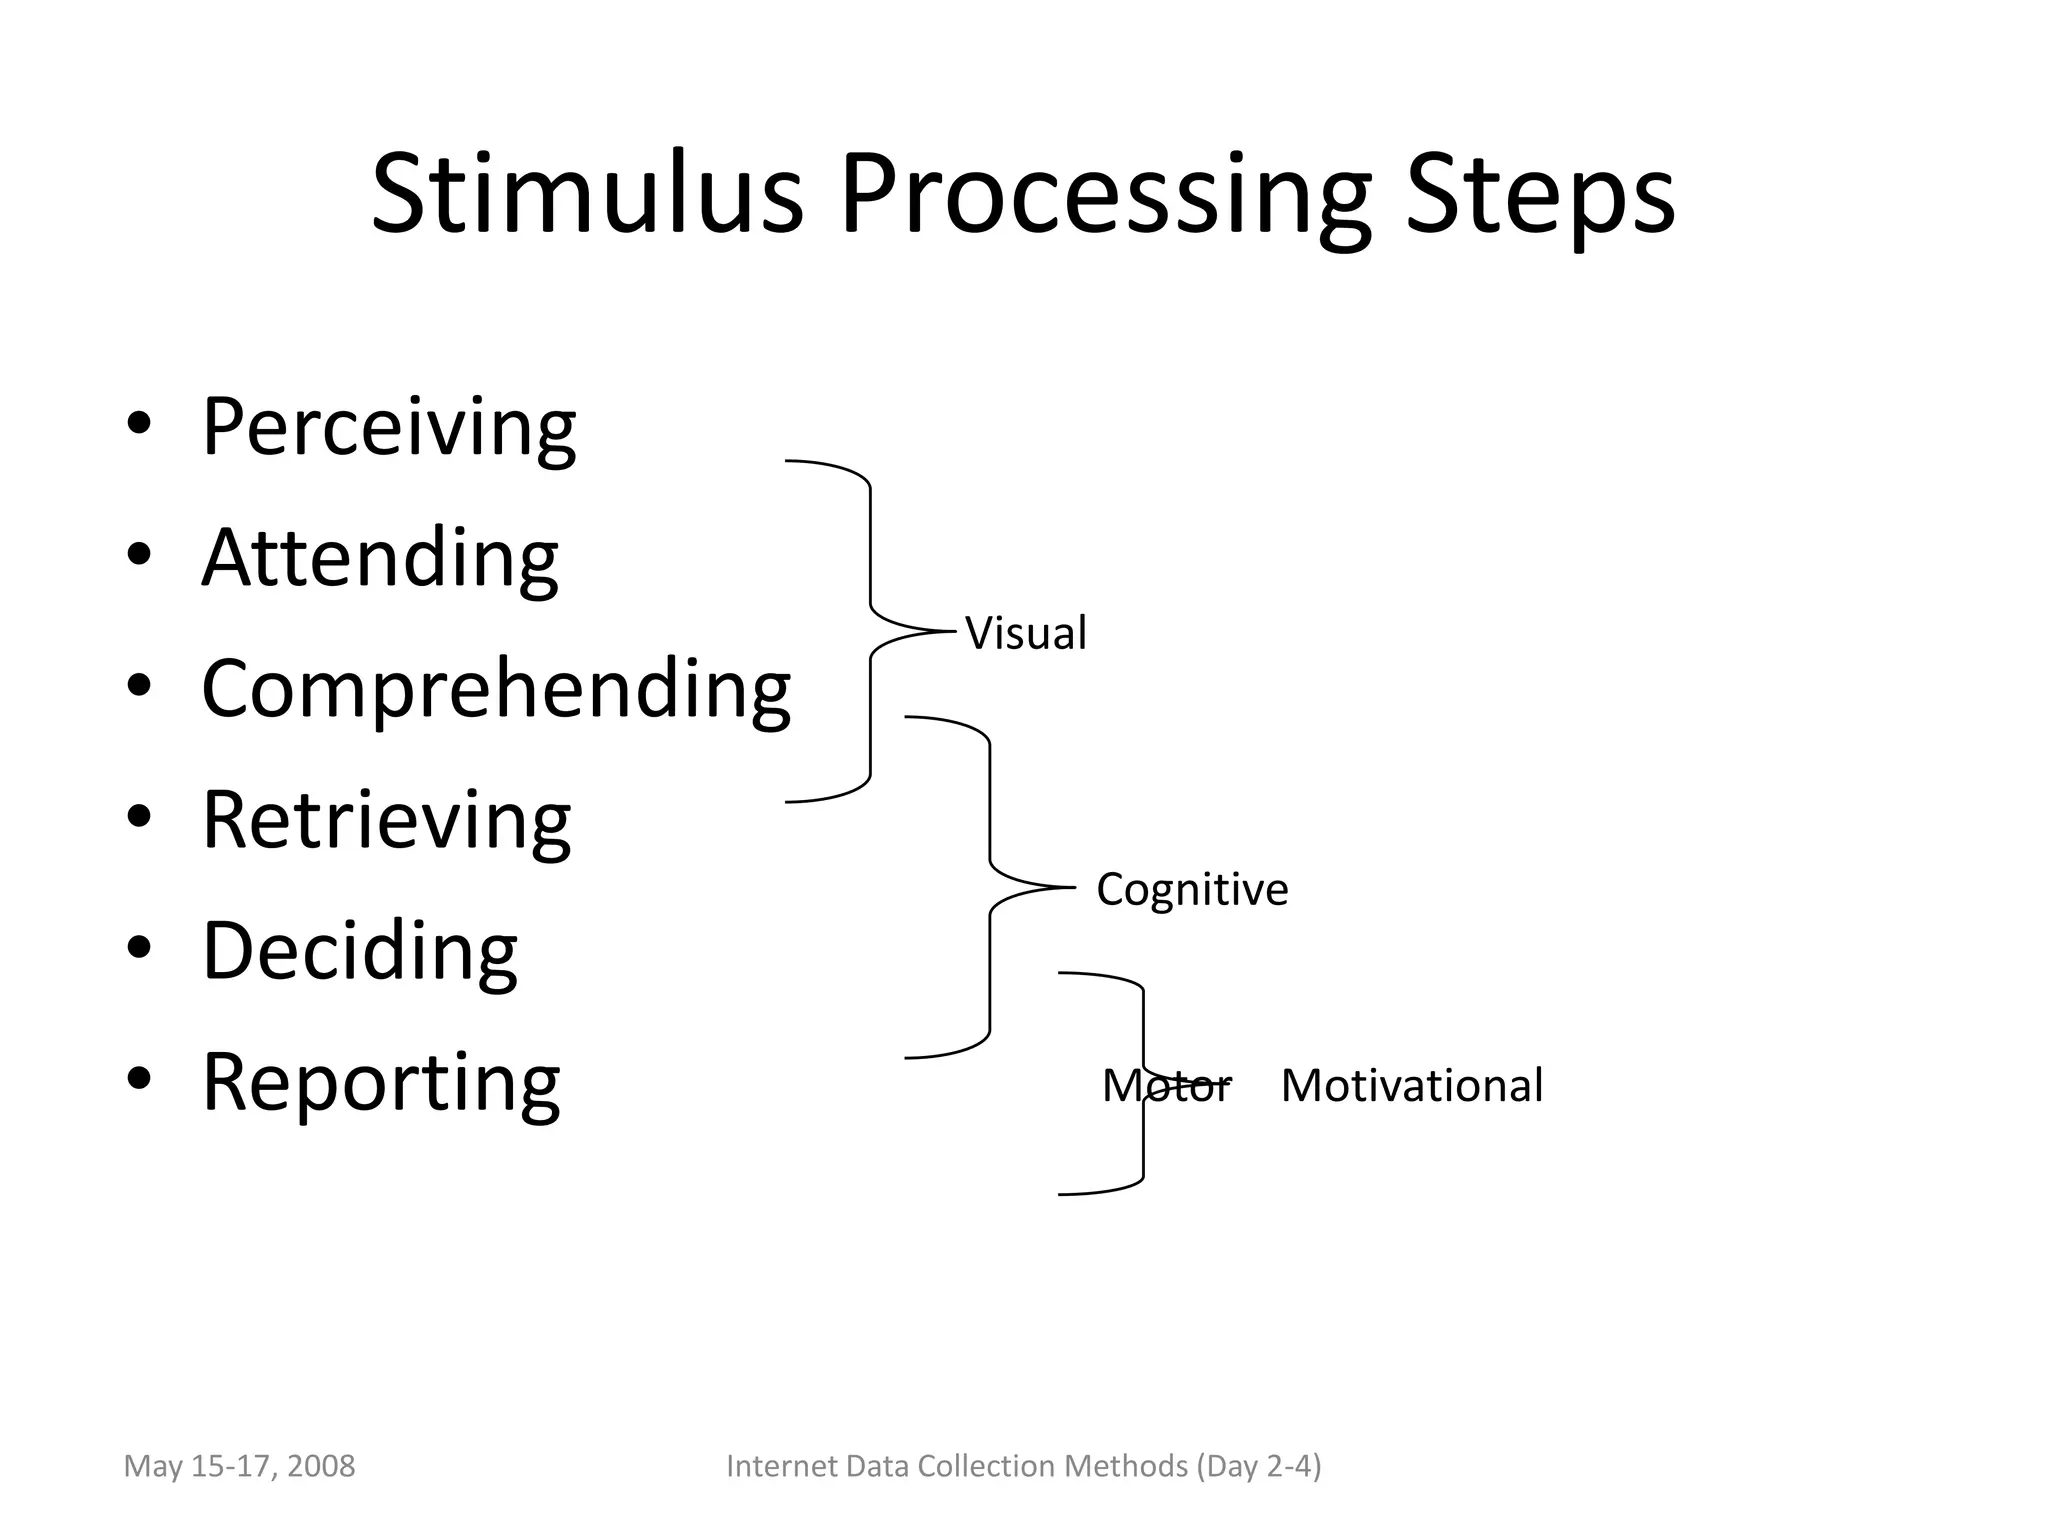
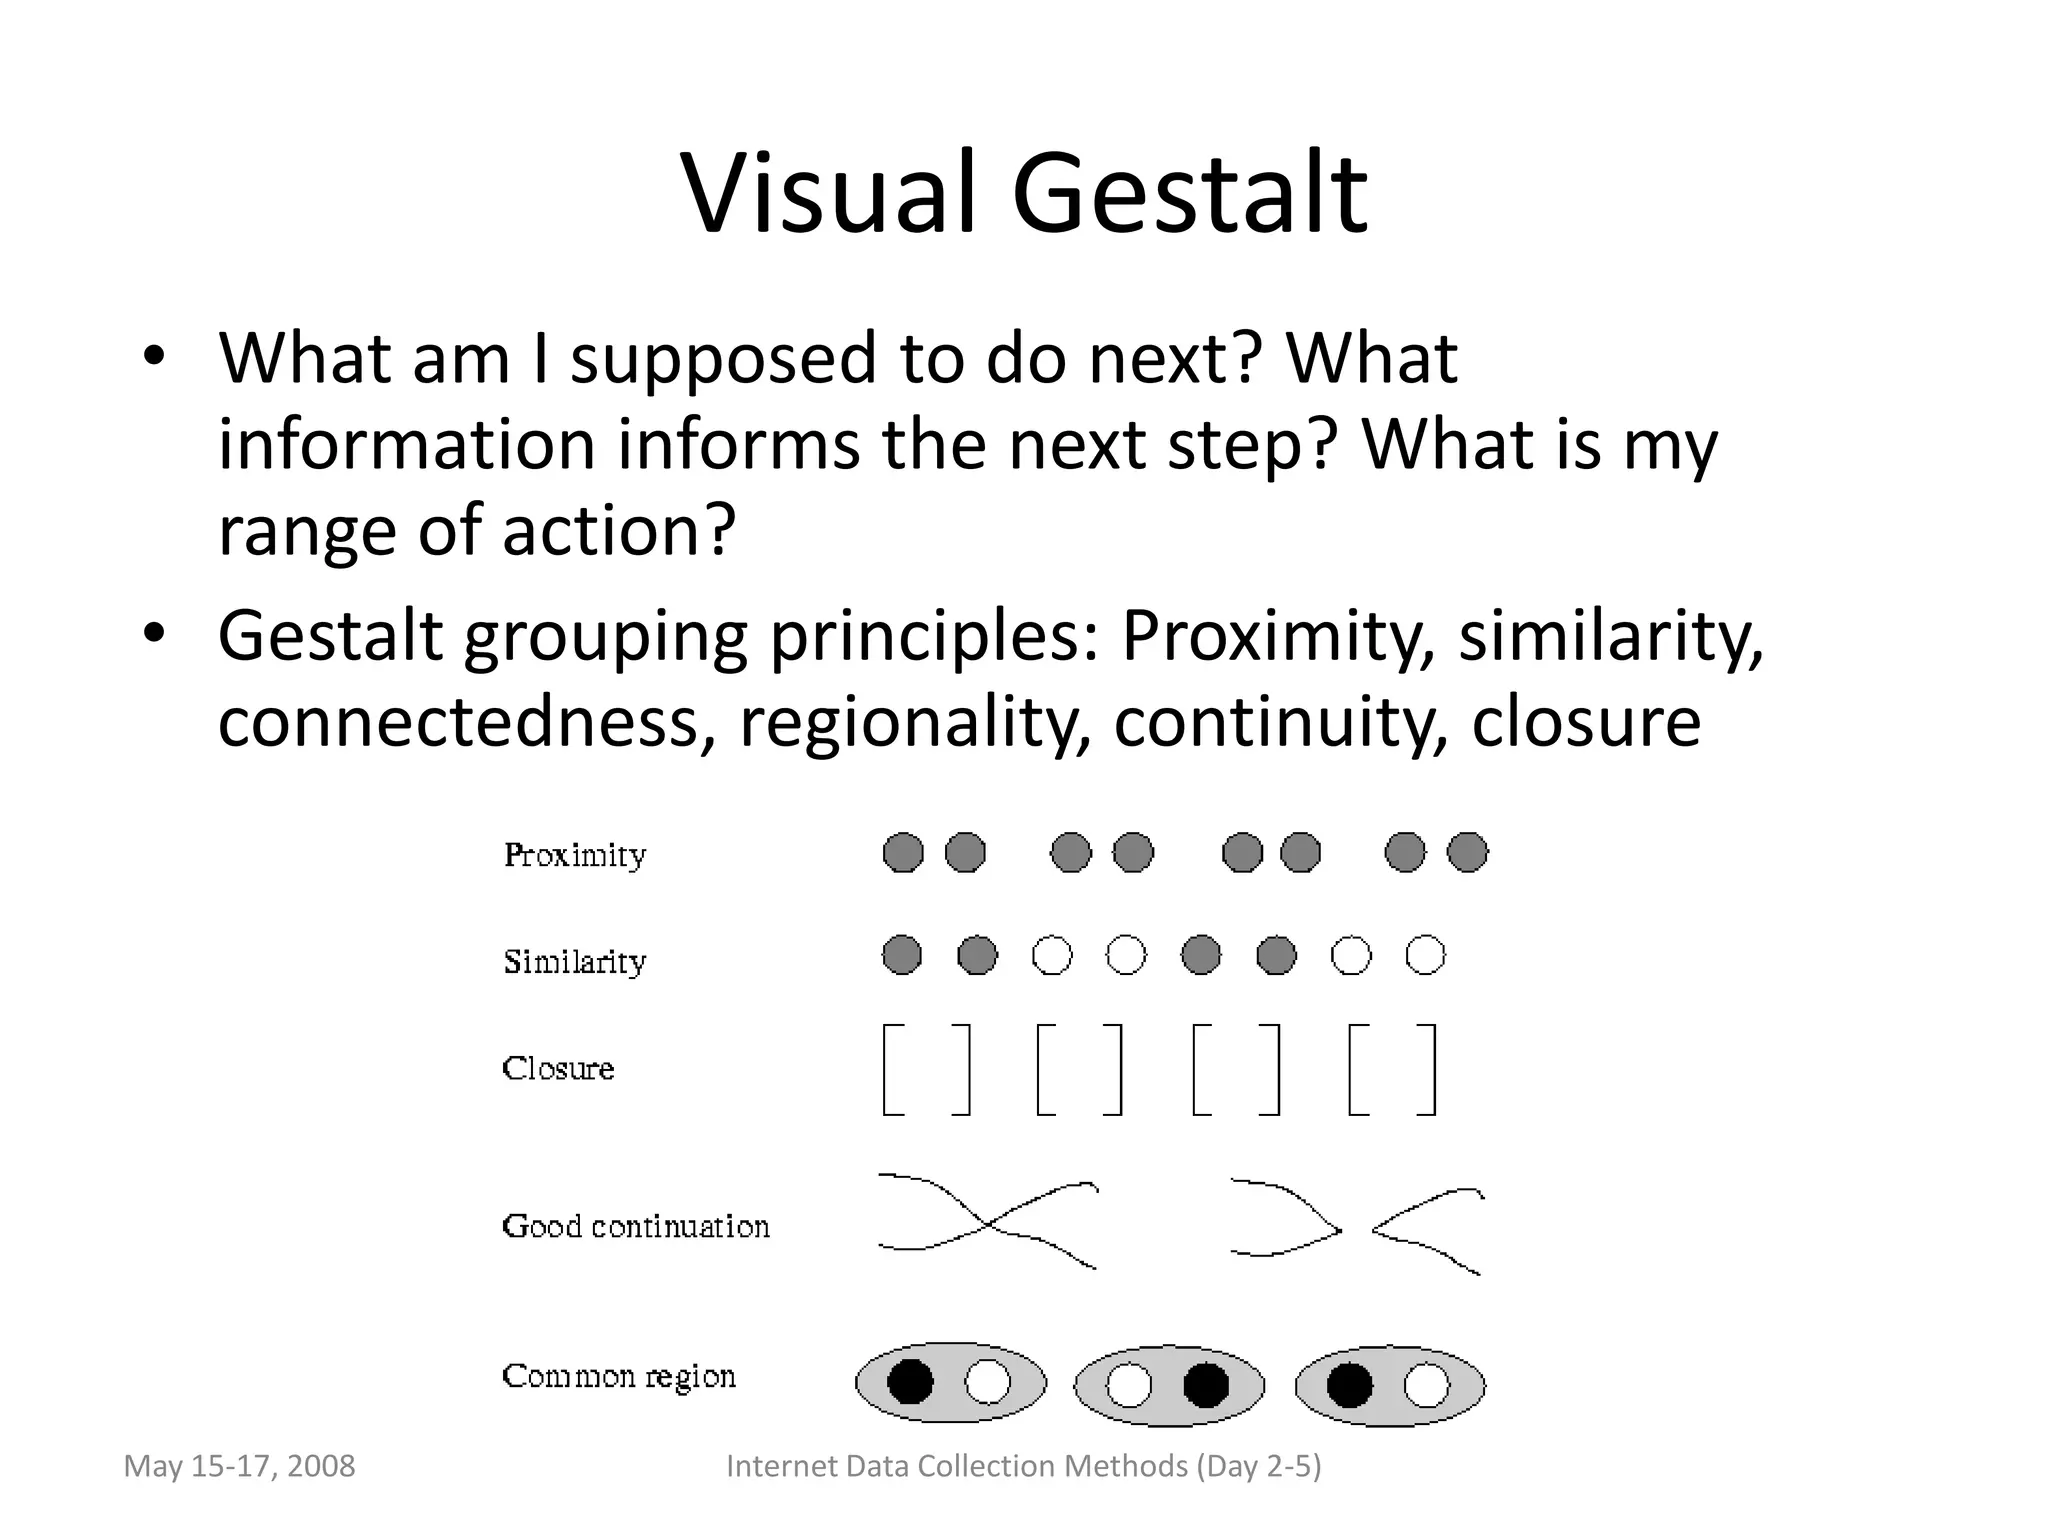
2) Cognitive and visual processing steps respondents go through.
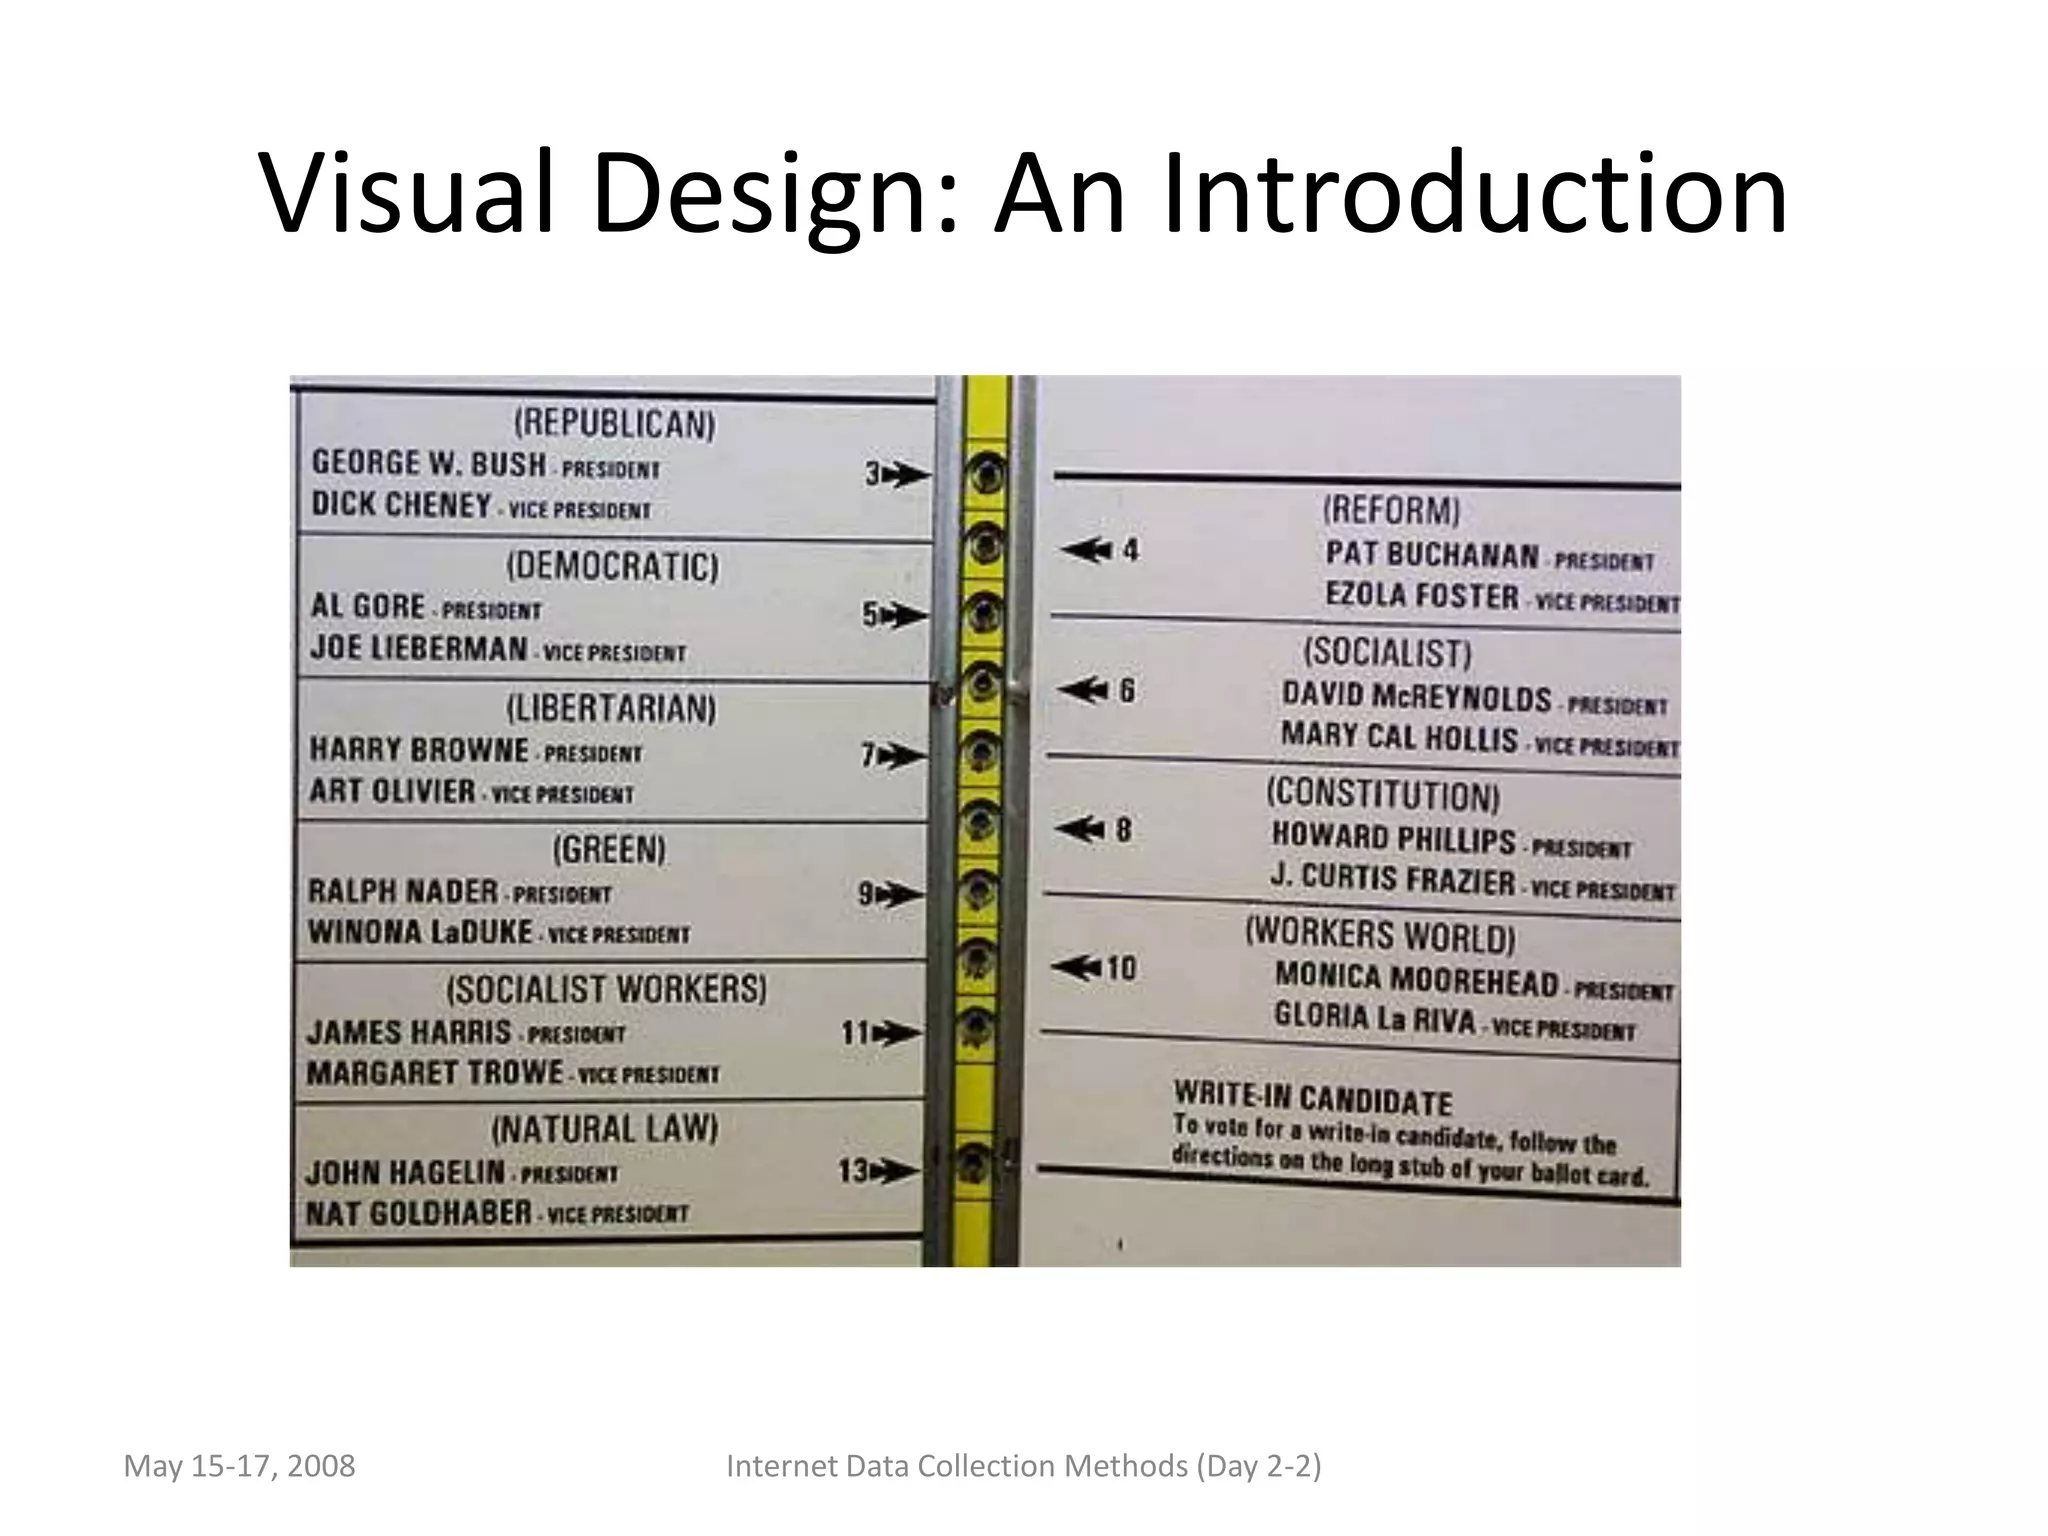
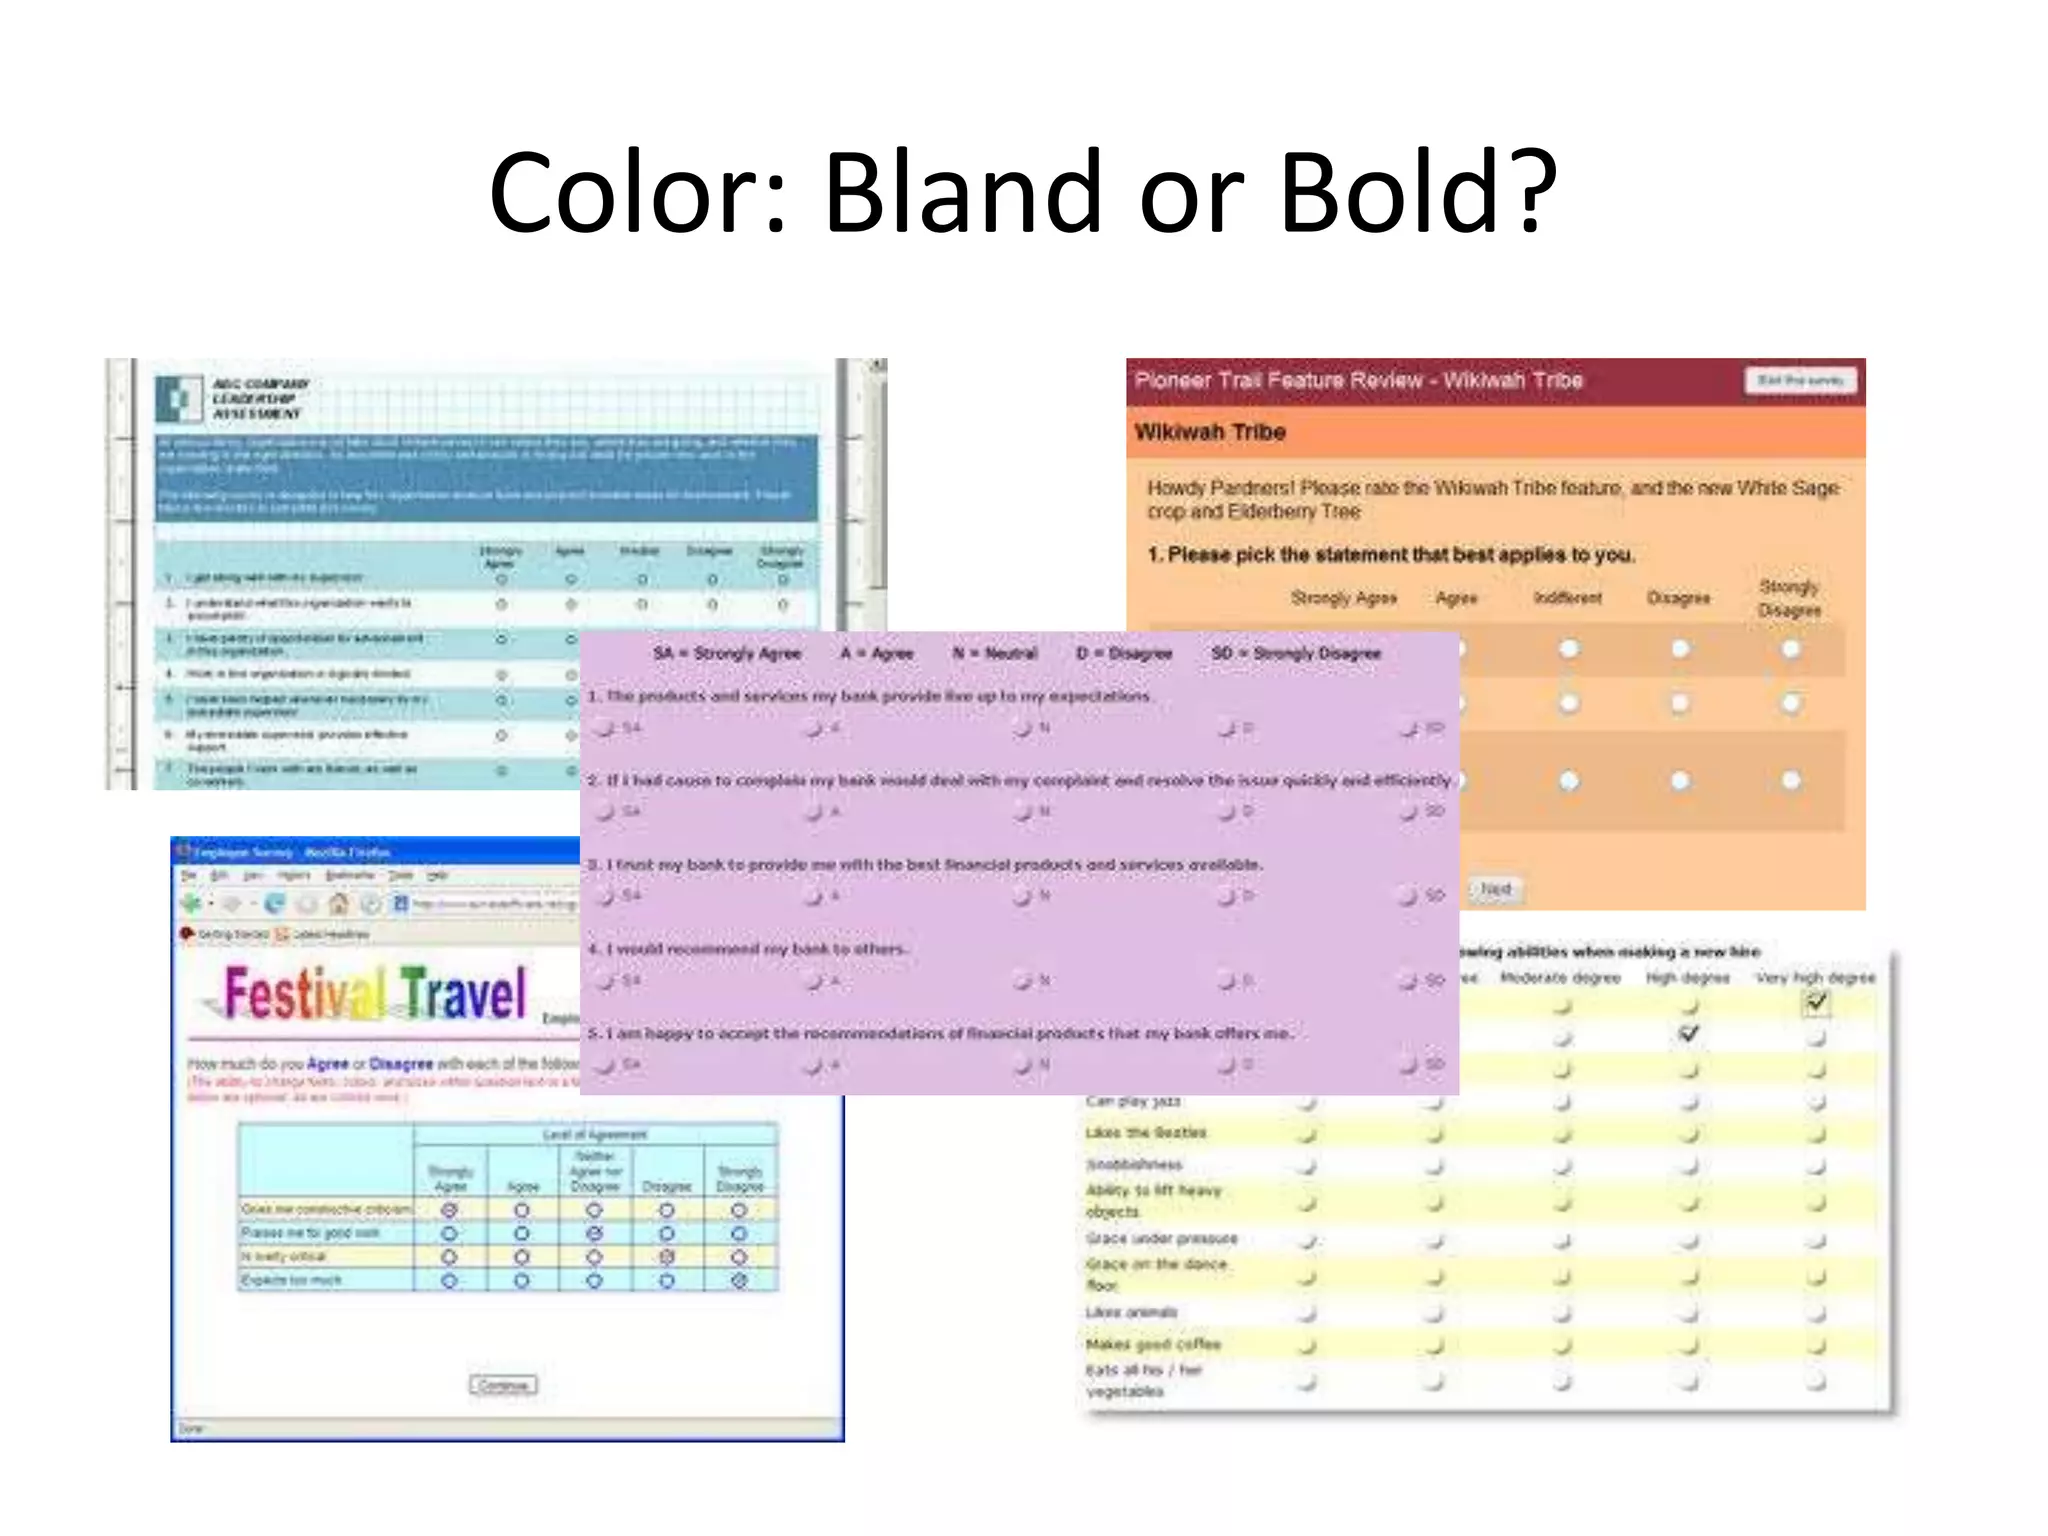
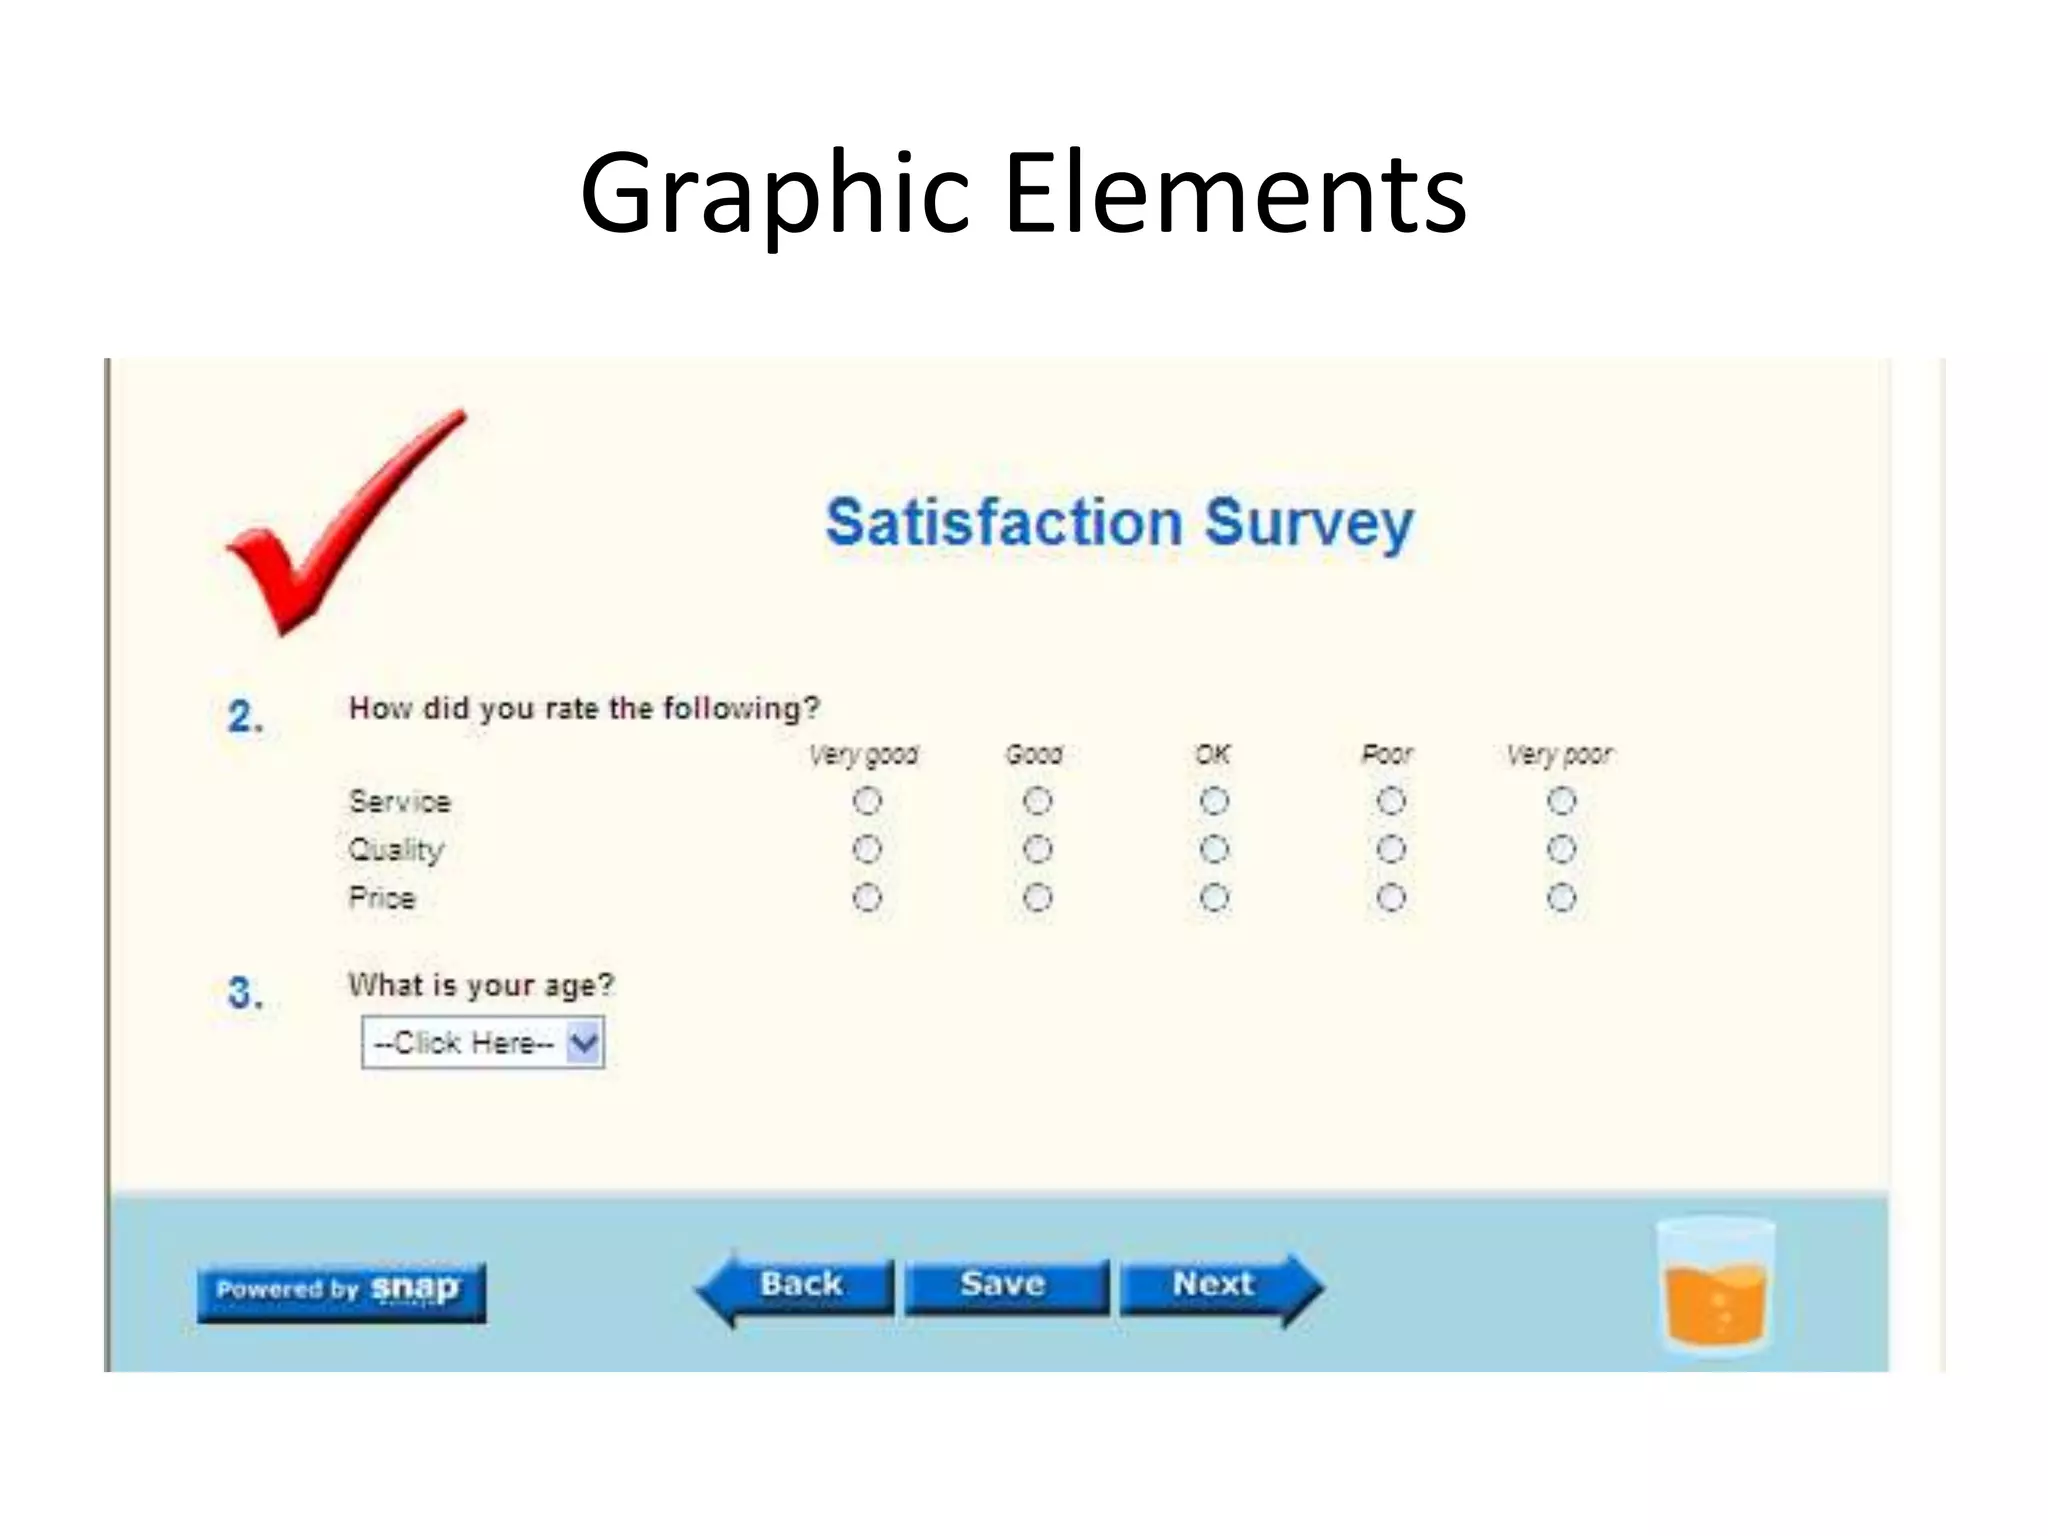
3) Ensuring clarity through proper use of formatting, fonts, colors, spacing and screen sizing for different devices.
4) Considering audiences that may have limited bandwidth.