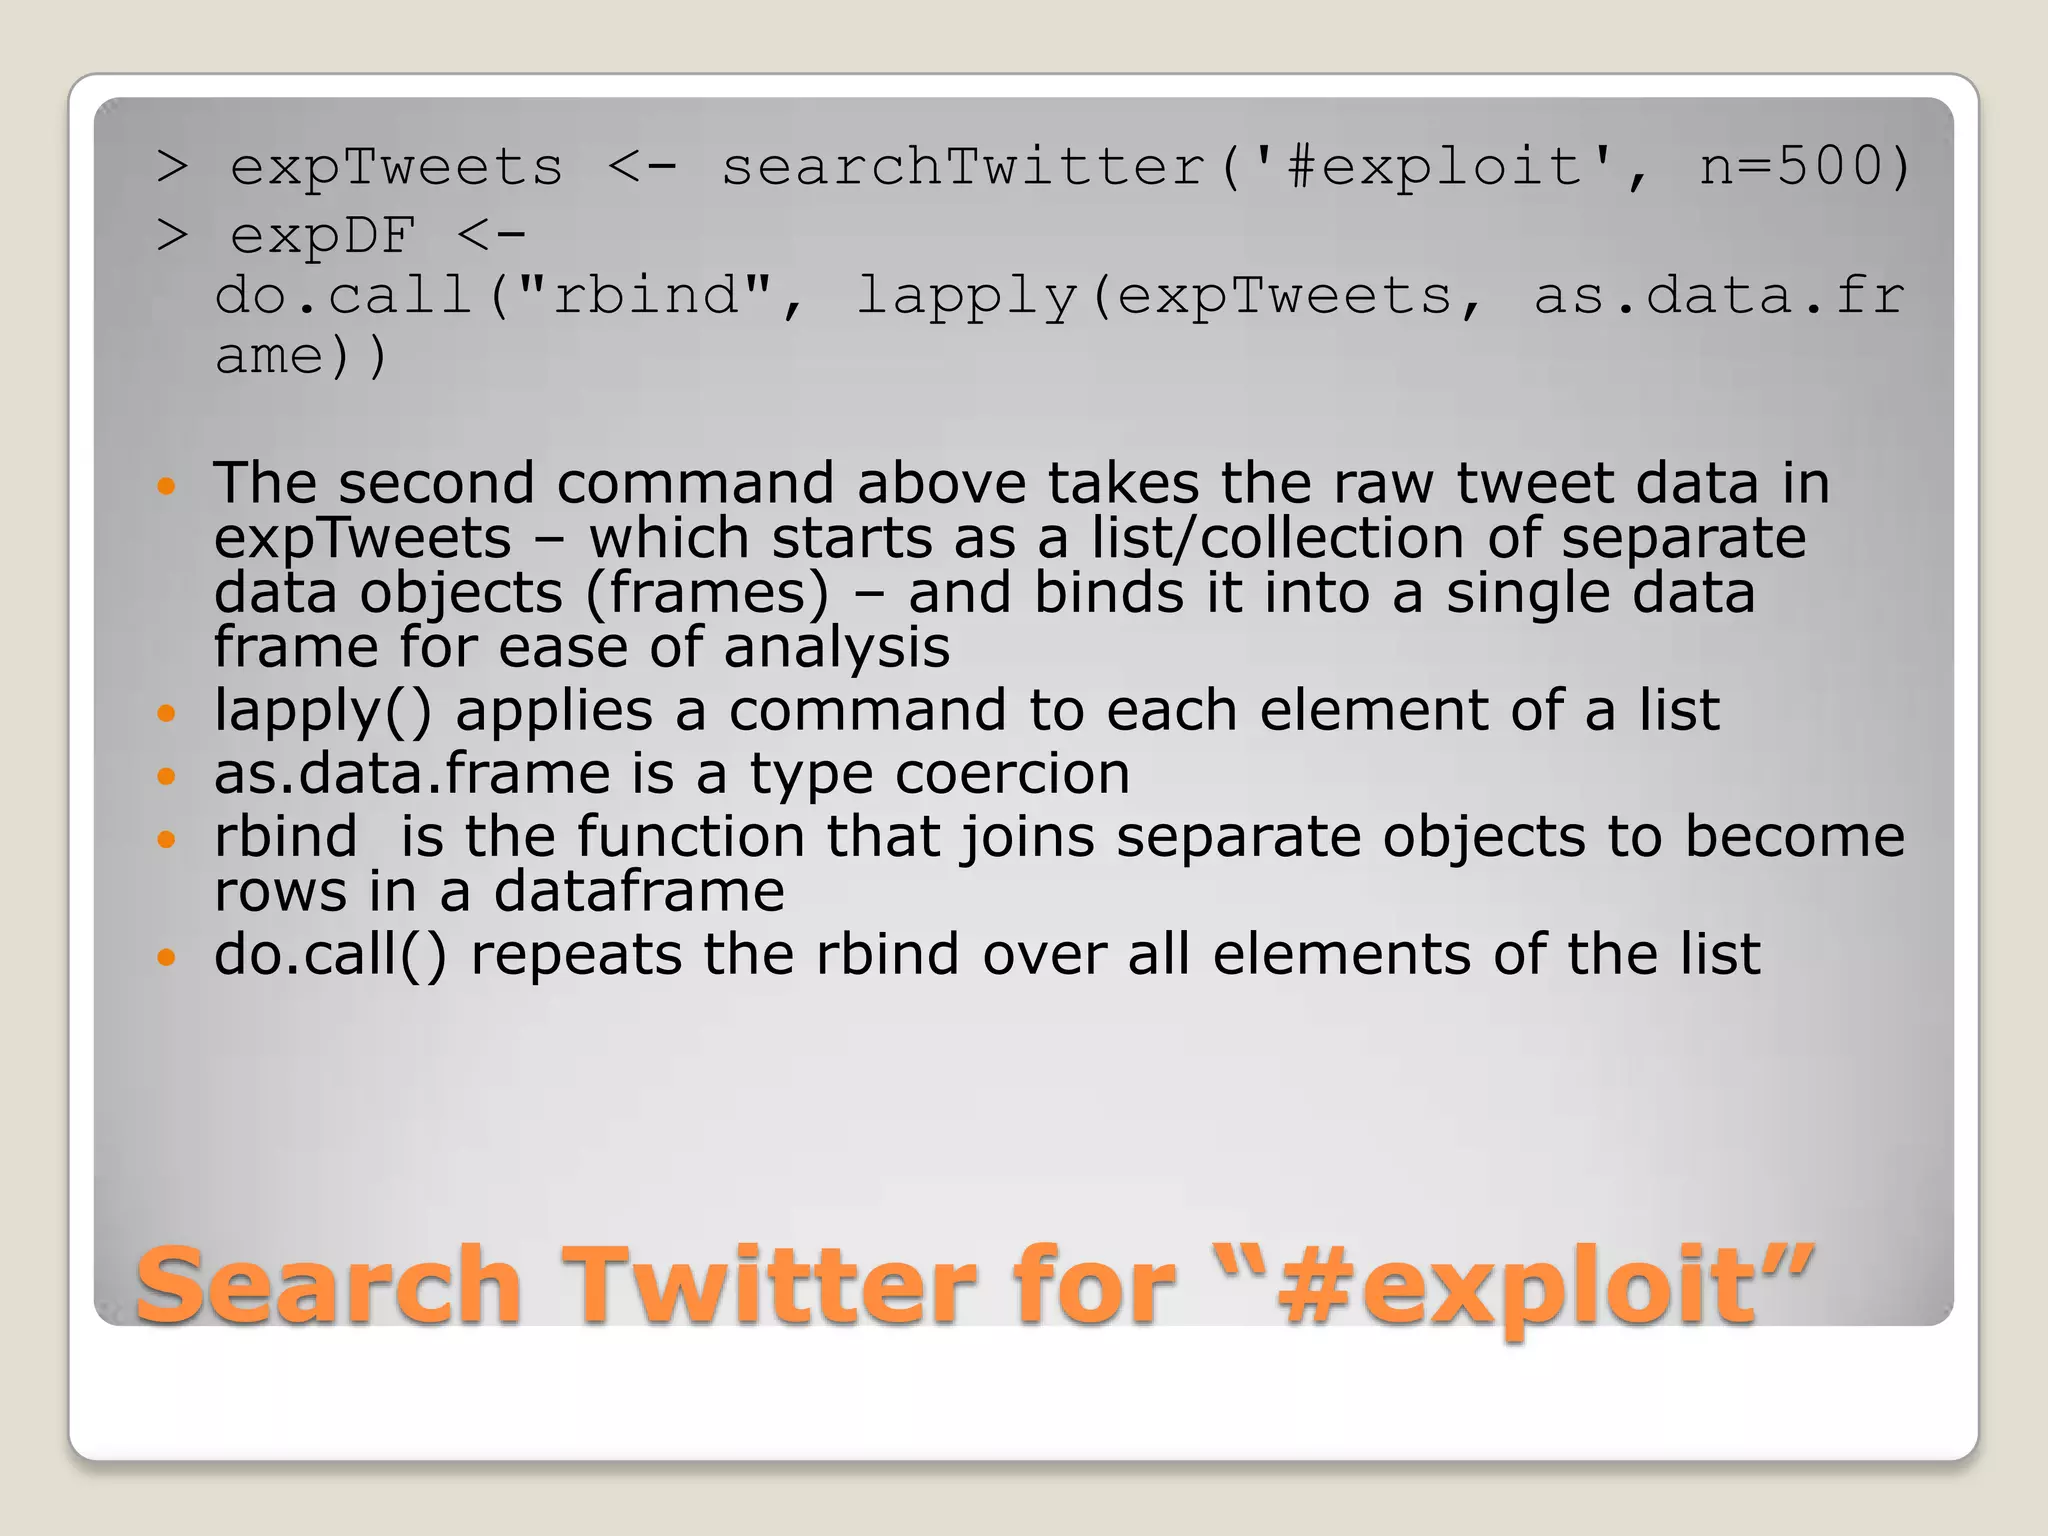
This document discusses using the open-source statistical software R to analyze security-related information from Twitter. It provides instructions on installing relevant R packages for accessing the Twitter API and searching for tweets containing specific keywords or hashtags. As an example, it searches for tweets with the hashtag "#exploit" and visualizes the results in a heatmap to show when during the day the tweets were posted.


![> head(expDF,1)
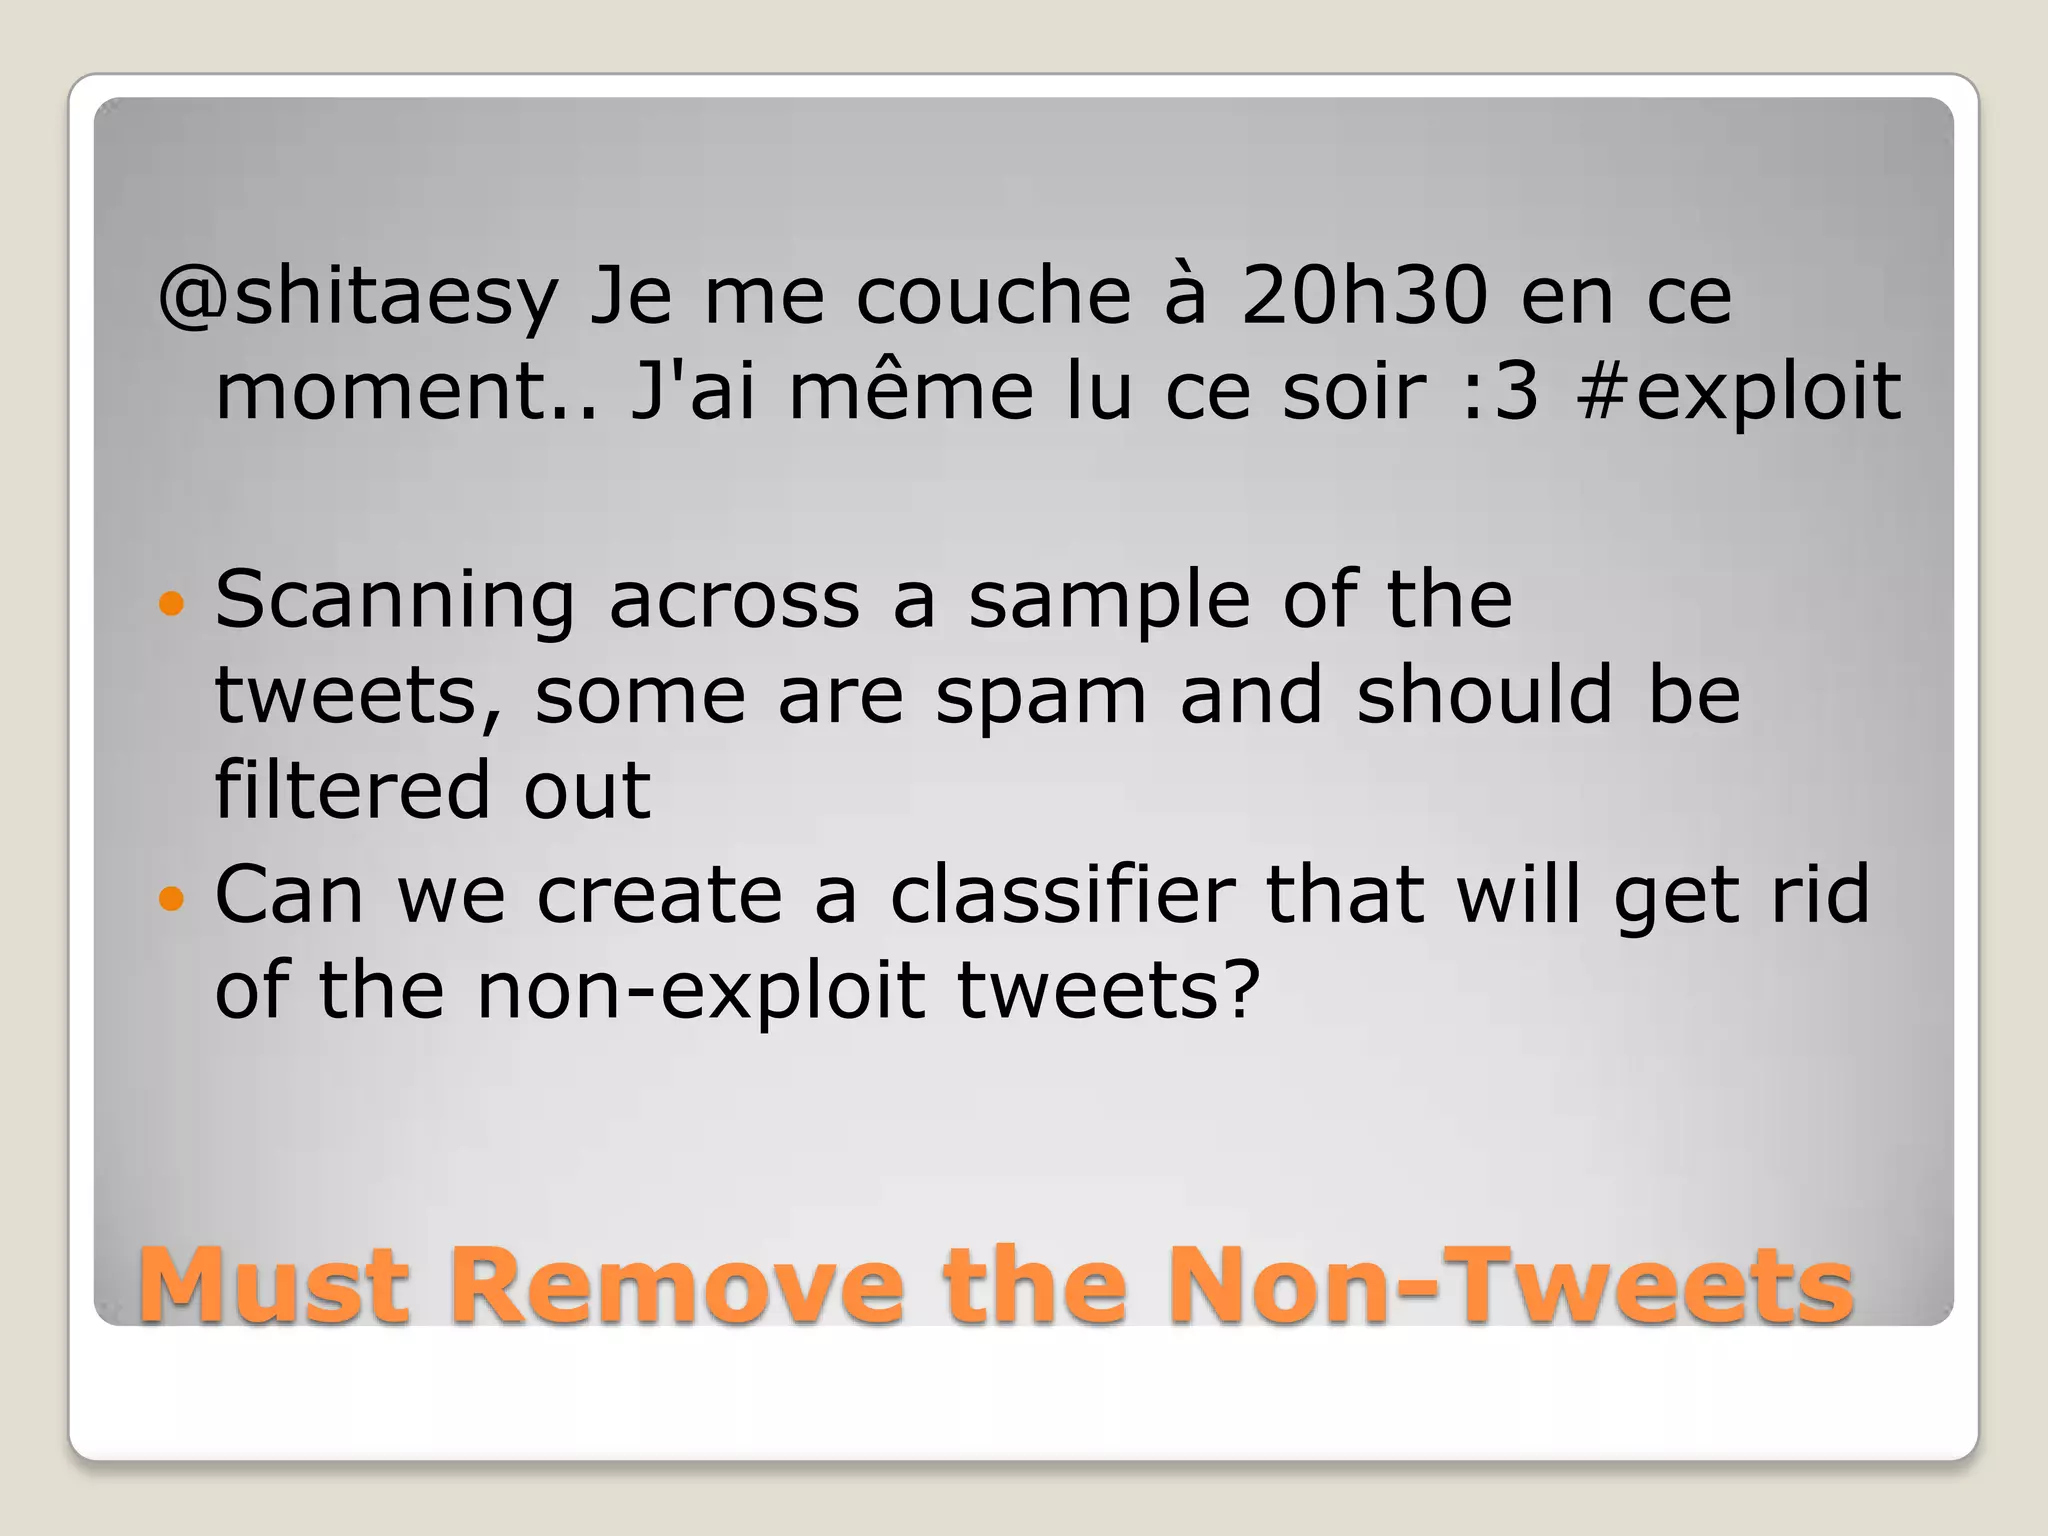
text: RT @hacktalkblog: New Exploit [webapps] - Wordpress Age
Verification Plugin http://t.co/O8wVjKca #Exploit
favorited: FALSE
replyToSN: NA
created: 2012-01-10 18:19:11
truncated: FALSE
replyToSID: <NA>
id: 156802281747124224
replyToUID: NA
statusSource: <a href="http://twitterfeed.com"
rel="nofollow">twitterfeed</a>
screenName: NotaThreat2u
A Preview of the Data](https://image.slidesharecdn.com/miningtweetsforsecurityinformation-120126152538-phpapp01/75/Mining-tweets-for-security-information-rev-2-10-2048.jpg)
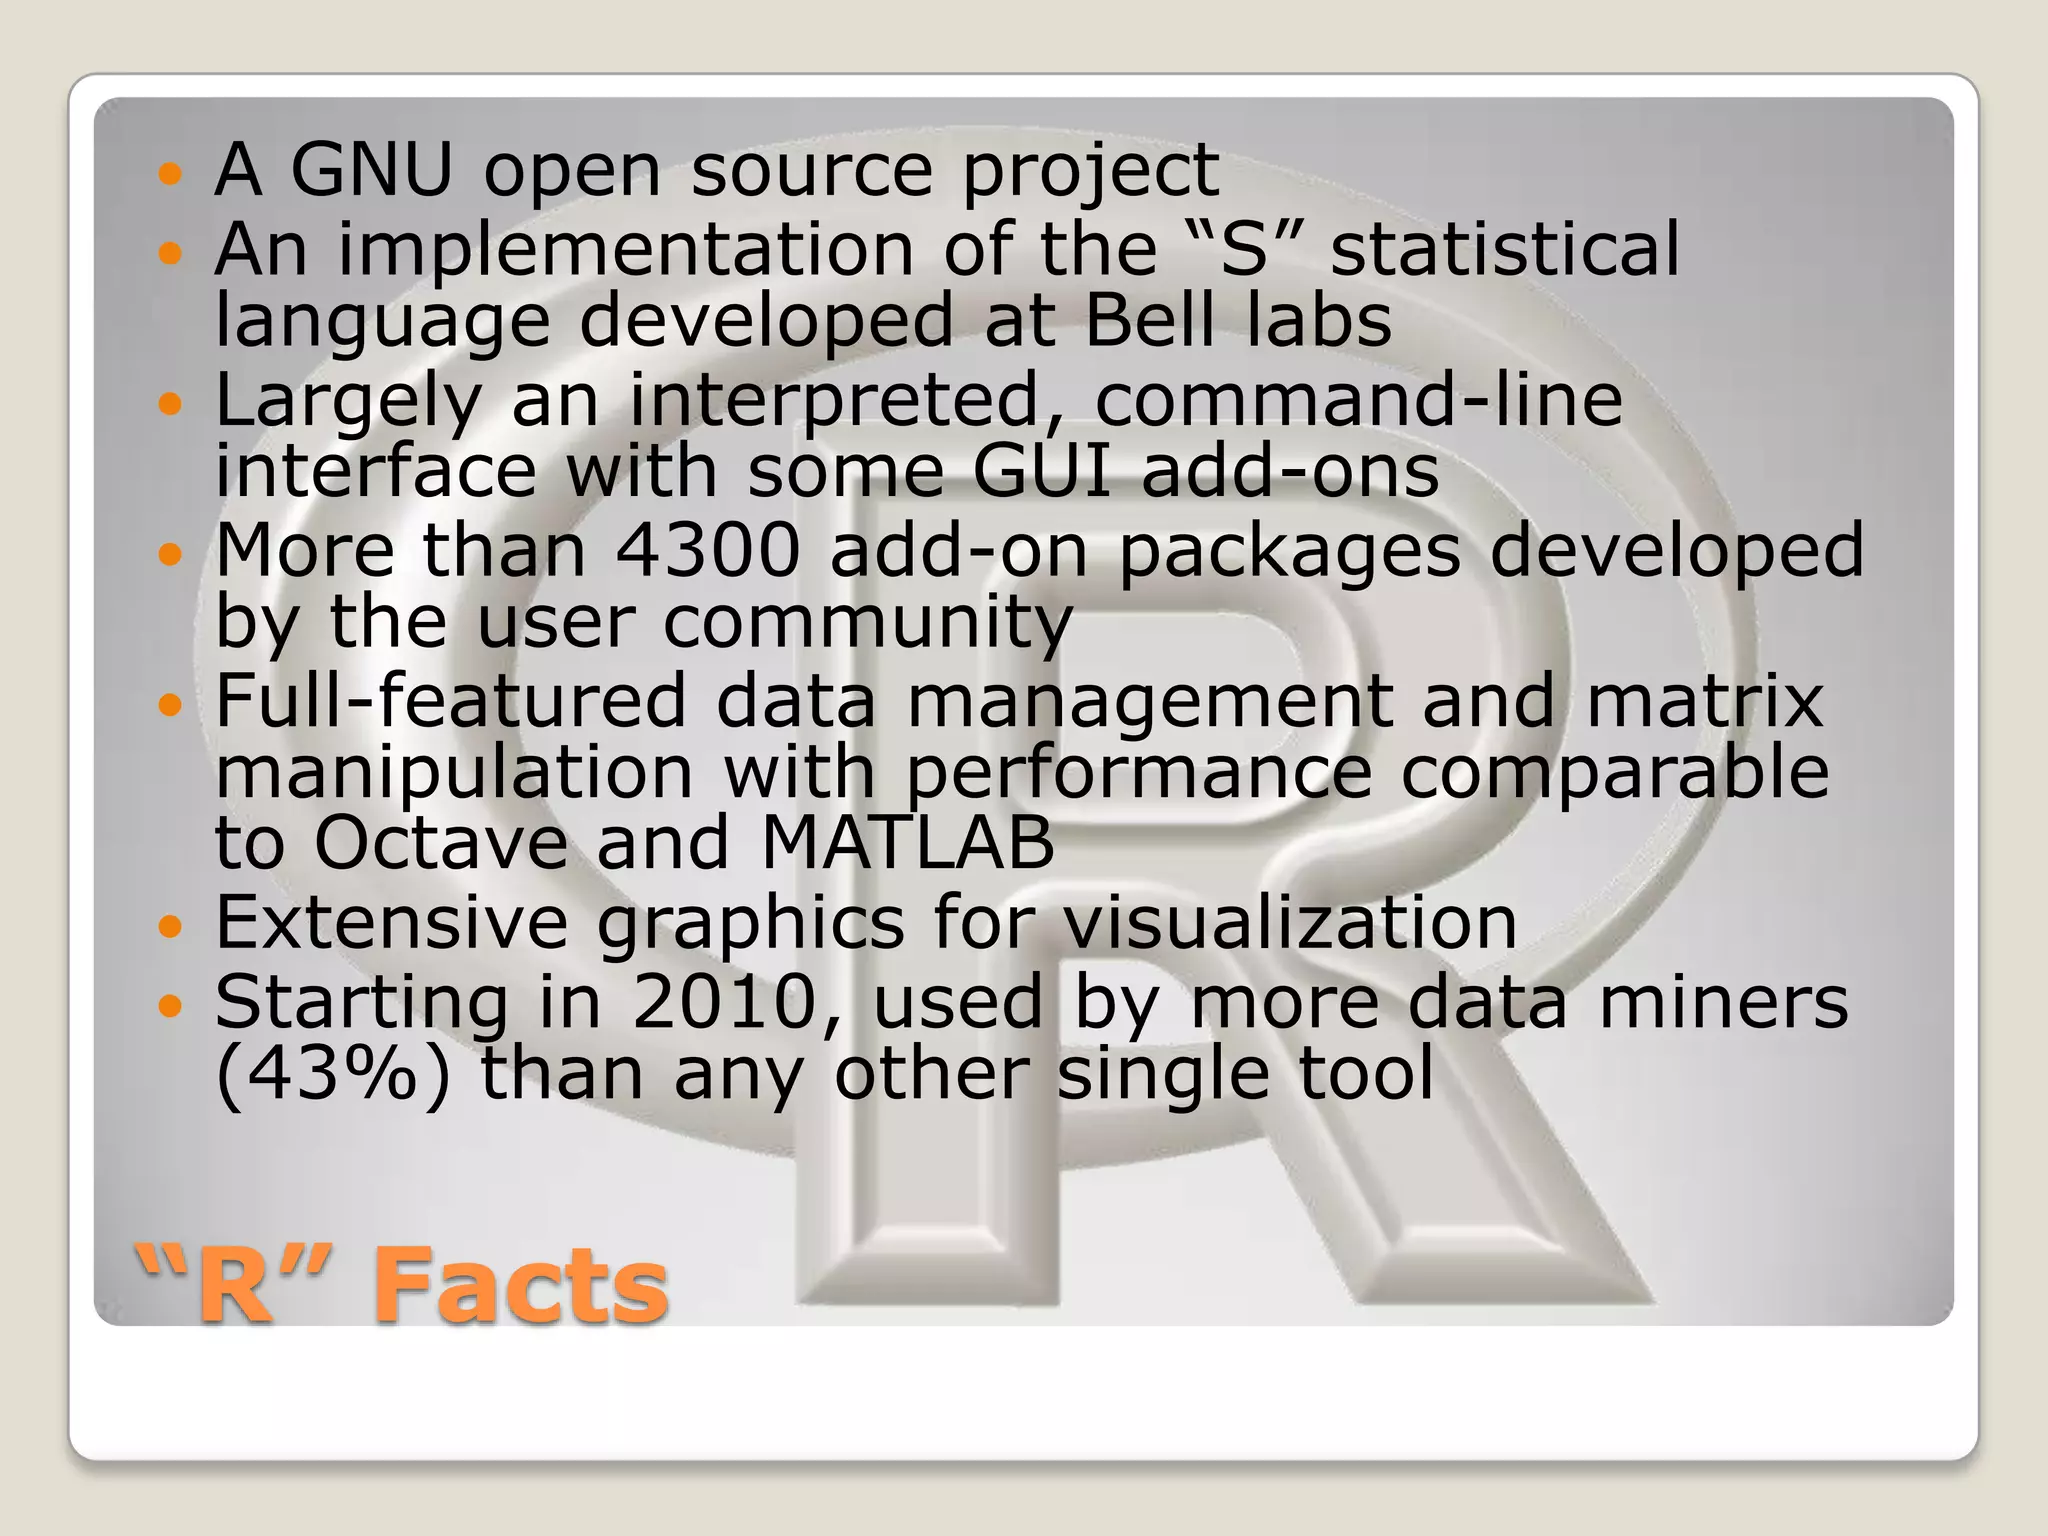
![> head(expDF$created,1)
Histogram of expDF$created
[1] "2012-01-10 18:19:11
UTC“
20
The created variable is
conveniently coded as a
15
POSIX time variable
Frequency
calibrated to UTC
10
>
hist(expDF$created, breaks=15,
5
freq=TRUE)
0
Shows a frequency
histogram (with about 15 13:50 18:00 22:10 02:20 06:30 10:40
break points) expDF$created
Nice spike at 18:00 UTC
(about 1pm EST)
Visualizing the Data: When Tweeted?
11](https://image.slidesharecdn.com/miningtweetsforsecurityinformation-120126152538-phpapp01/75/Mining-tweets-for-security-information-rev-2-11-2048.jpg)
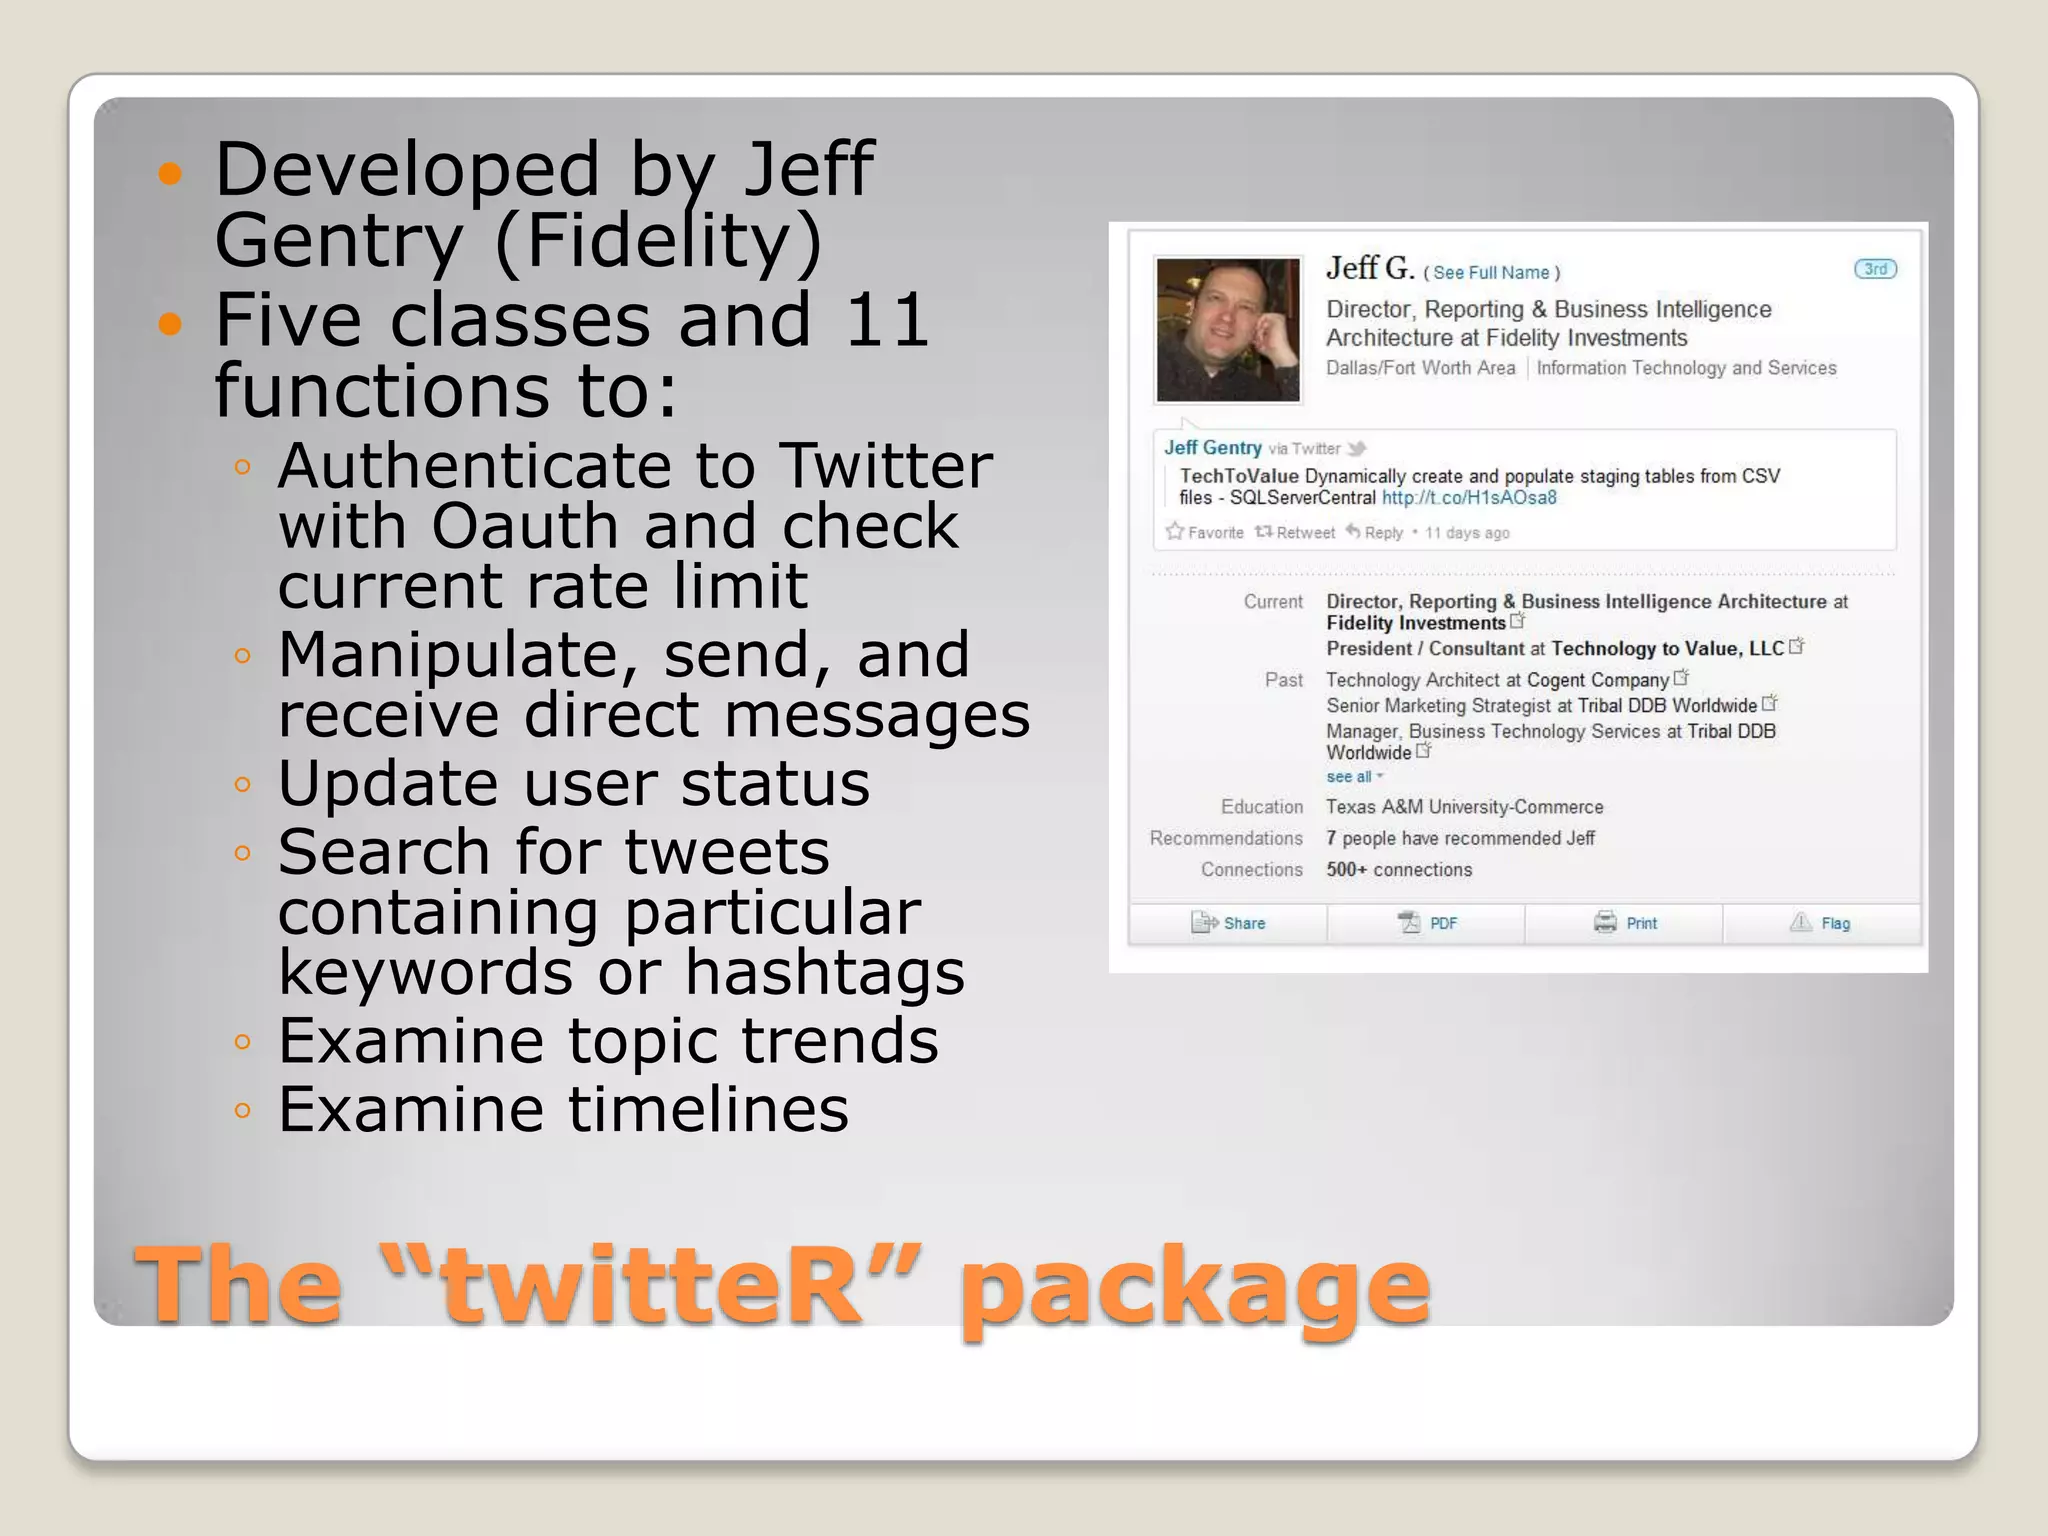
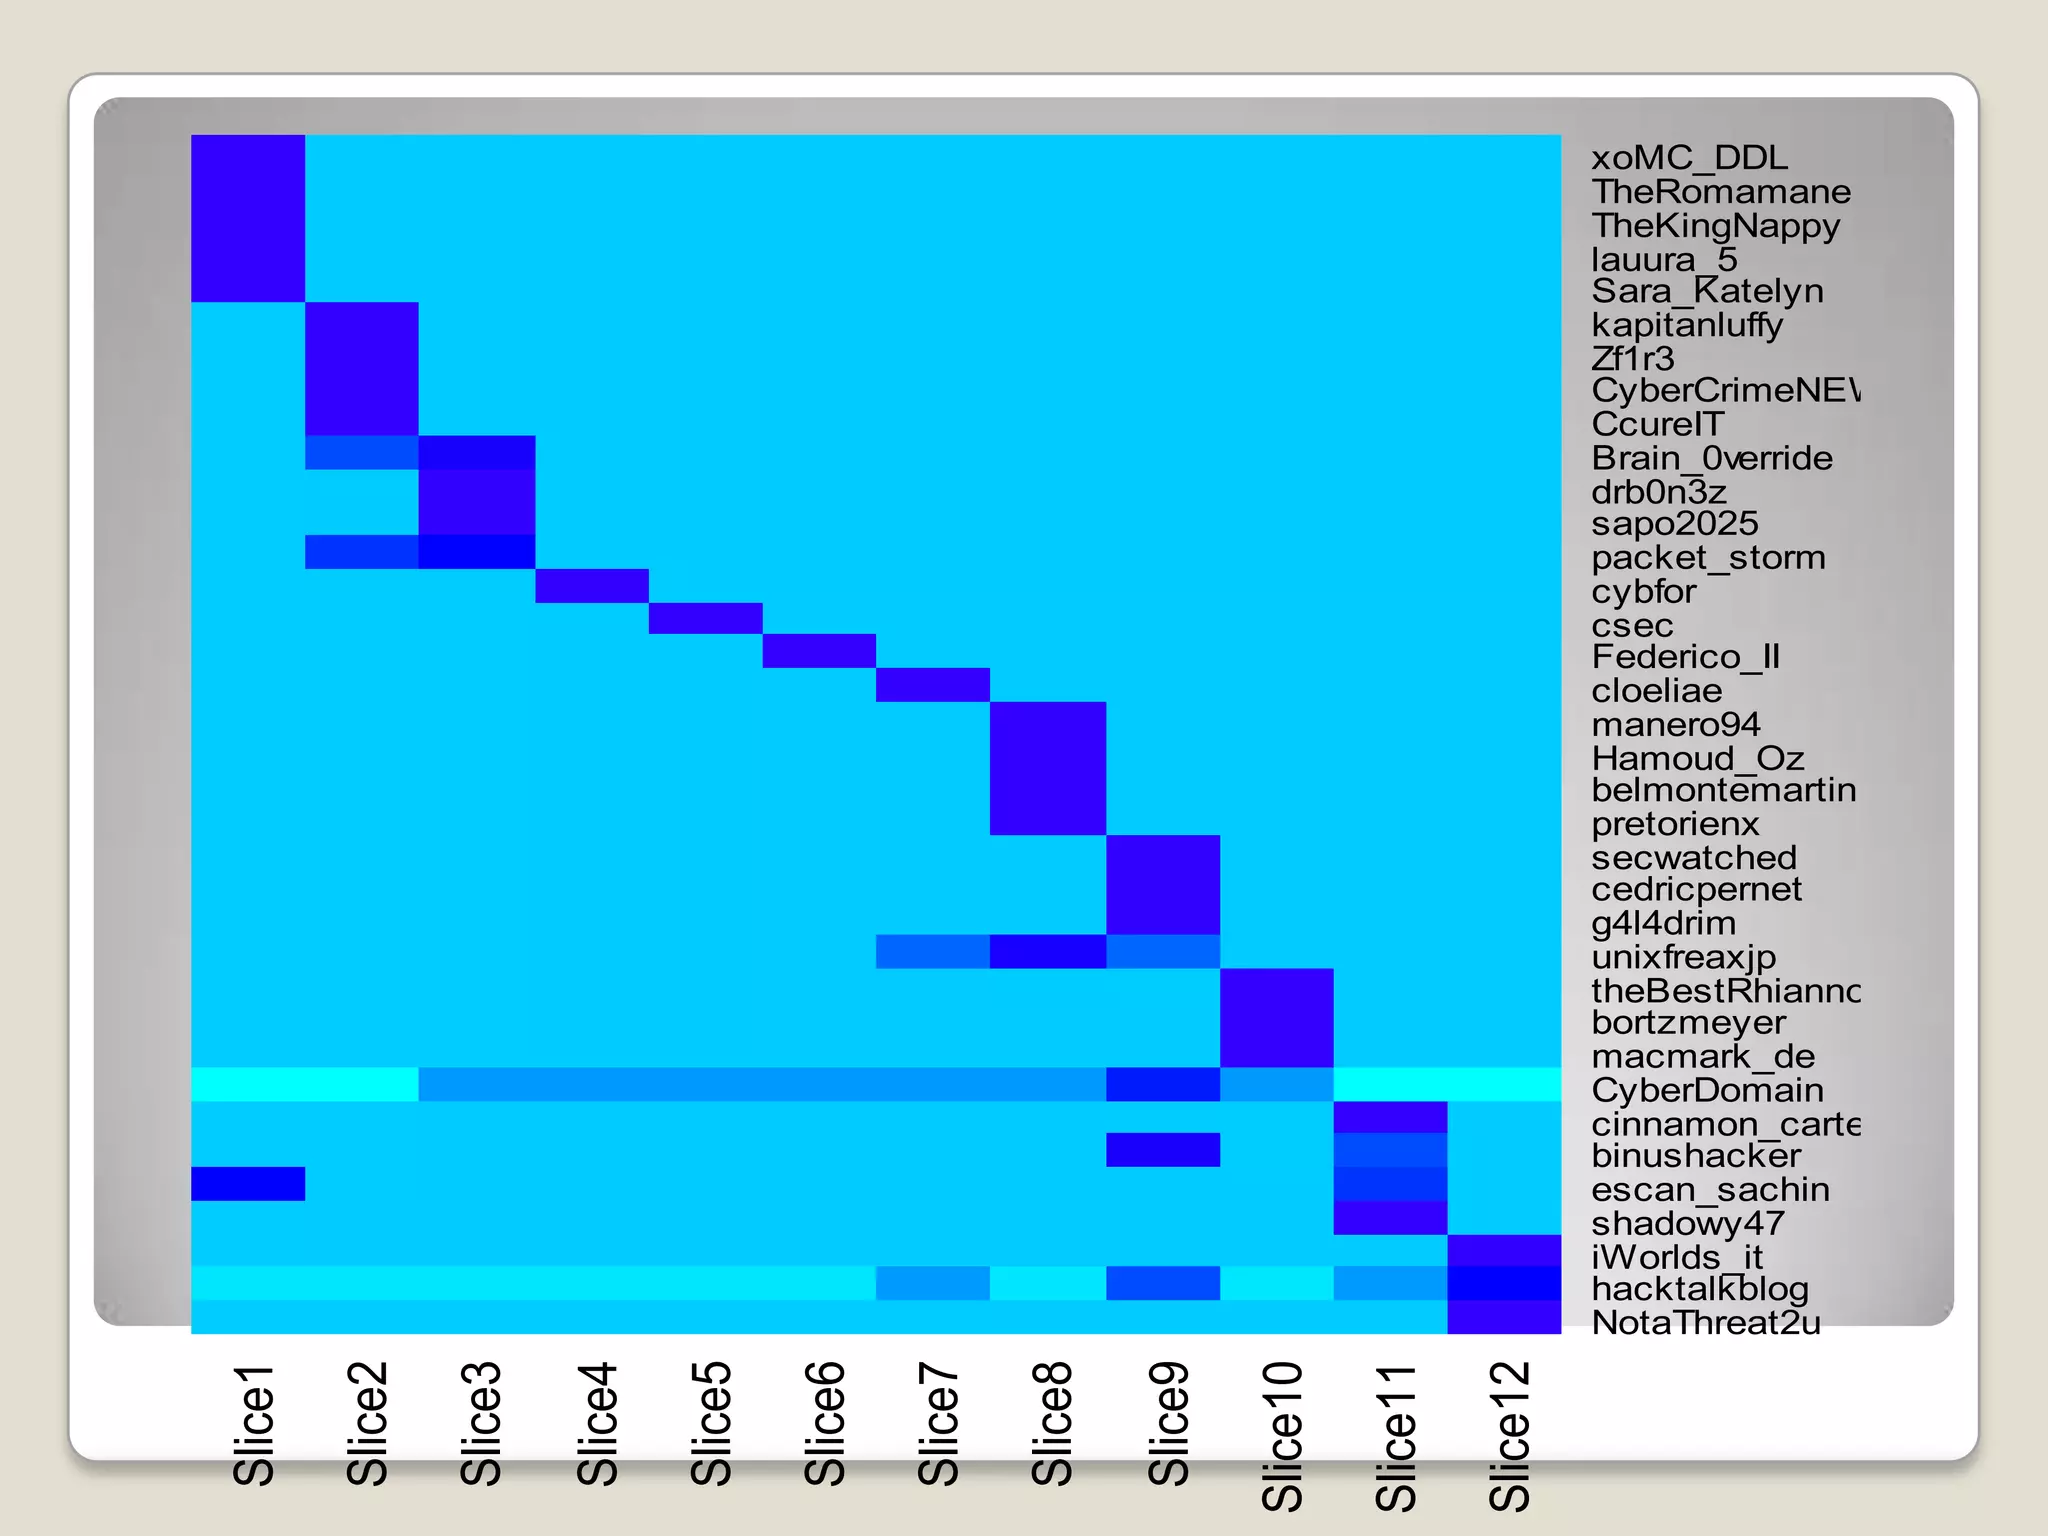
![# Total time between 1st and last tweet
elapsedTime = max(expDF$created) - min(expDF$created)
timeBin = floor(elapsedTime/11) # Make 11 bins
# Add a new variable with the bin designators
expDF$slice = floor((expDF$created -
min(expDF$created))/(as.integer(timeBin)*3600))
expSlices<-expDF[,c("screenName","slice")] # subset the data
expTable<-table(expSlices) # Count tweets in each slice
# Convert table data to matrix that heatmap() expects
expMatrix<-matrix(expTable,ncol=length(colnames(expTable)))
rownames(expMatrix)<-rownames(expTable)
colnames(expMatrix)<-paste('Slice',1:12)
heatmap(expMatrix,Rowv=NA,Colv=NA,
col=rainbow(max(expMatrix)+1,start=0.5,end=.7))
Prepare a Heatmap](https://image.slidesharecdn.com/miningtweetsforsecurityinformation-120126152538-phpapp01/75/Mining-tweets-for-security-information-rev-2-12-2048.jpg)
![library(stringr) # Provides easy string
functions
str_match(expDF$text, "^RT @") # Find RT @ at
beginning of each line
Regular expression matching any number of
alphanumeric characters or underscore:
[[:alnum:]_]*
str_match(expDF$text, "^RT @[[:alnum:]_]*") #
Matches the whole retweet screen name
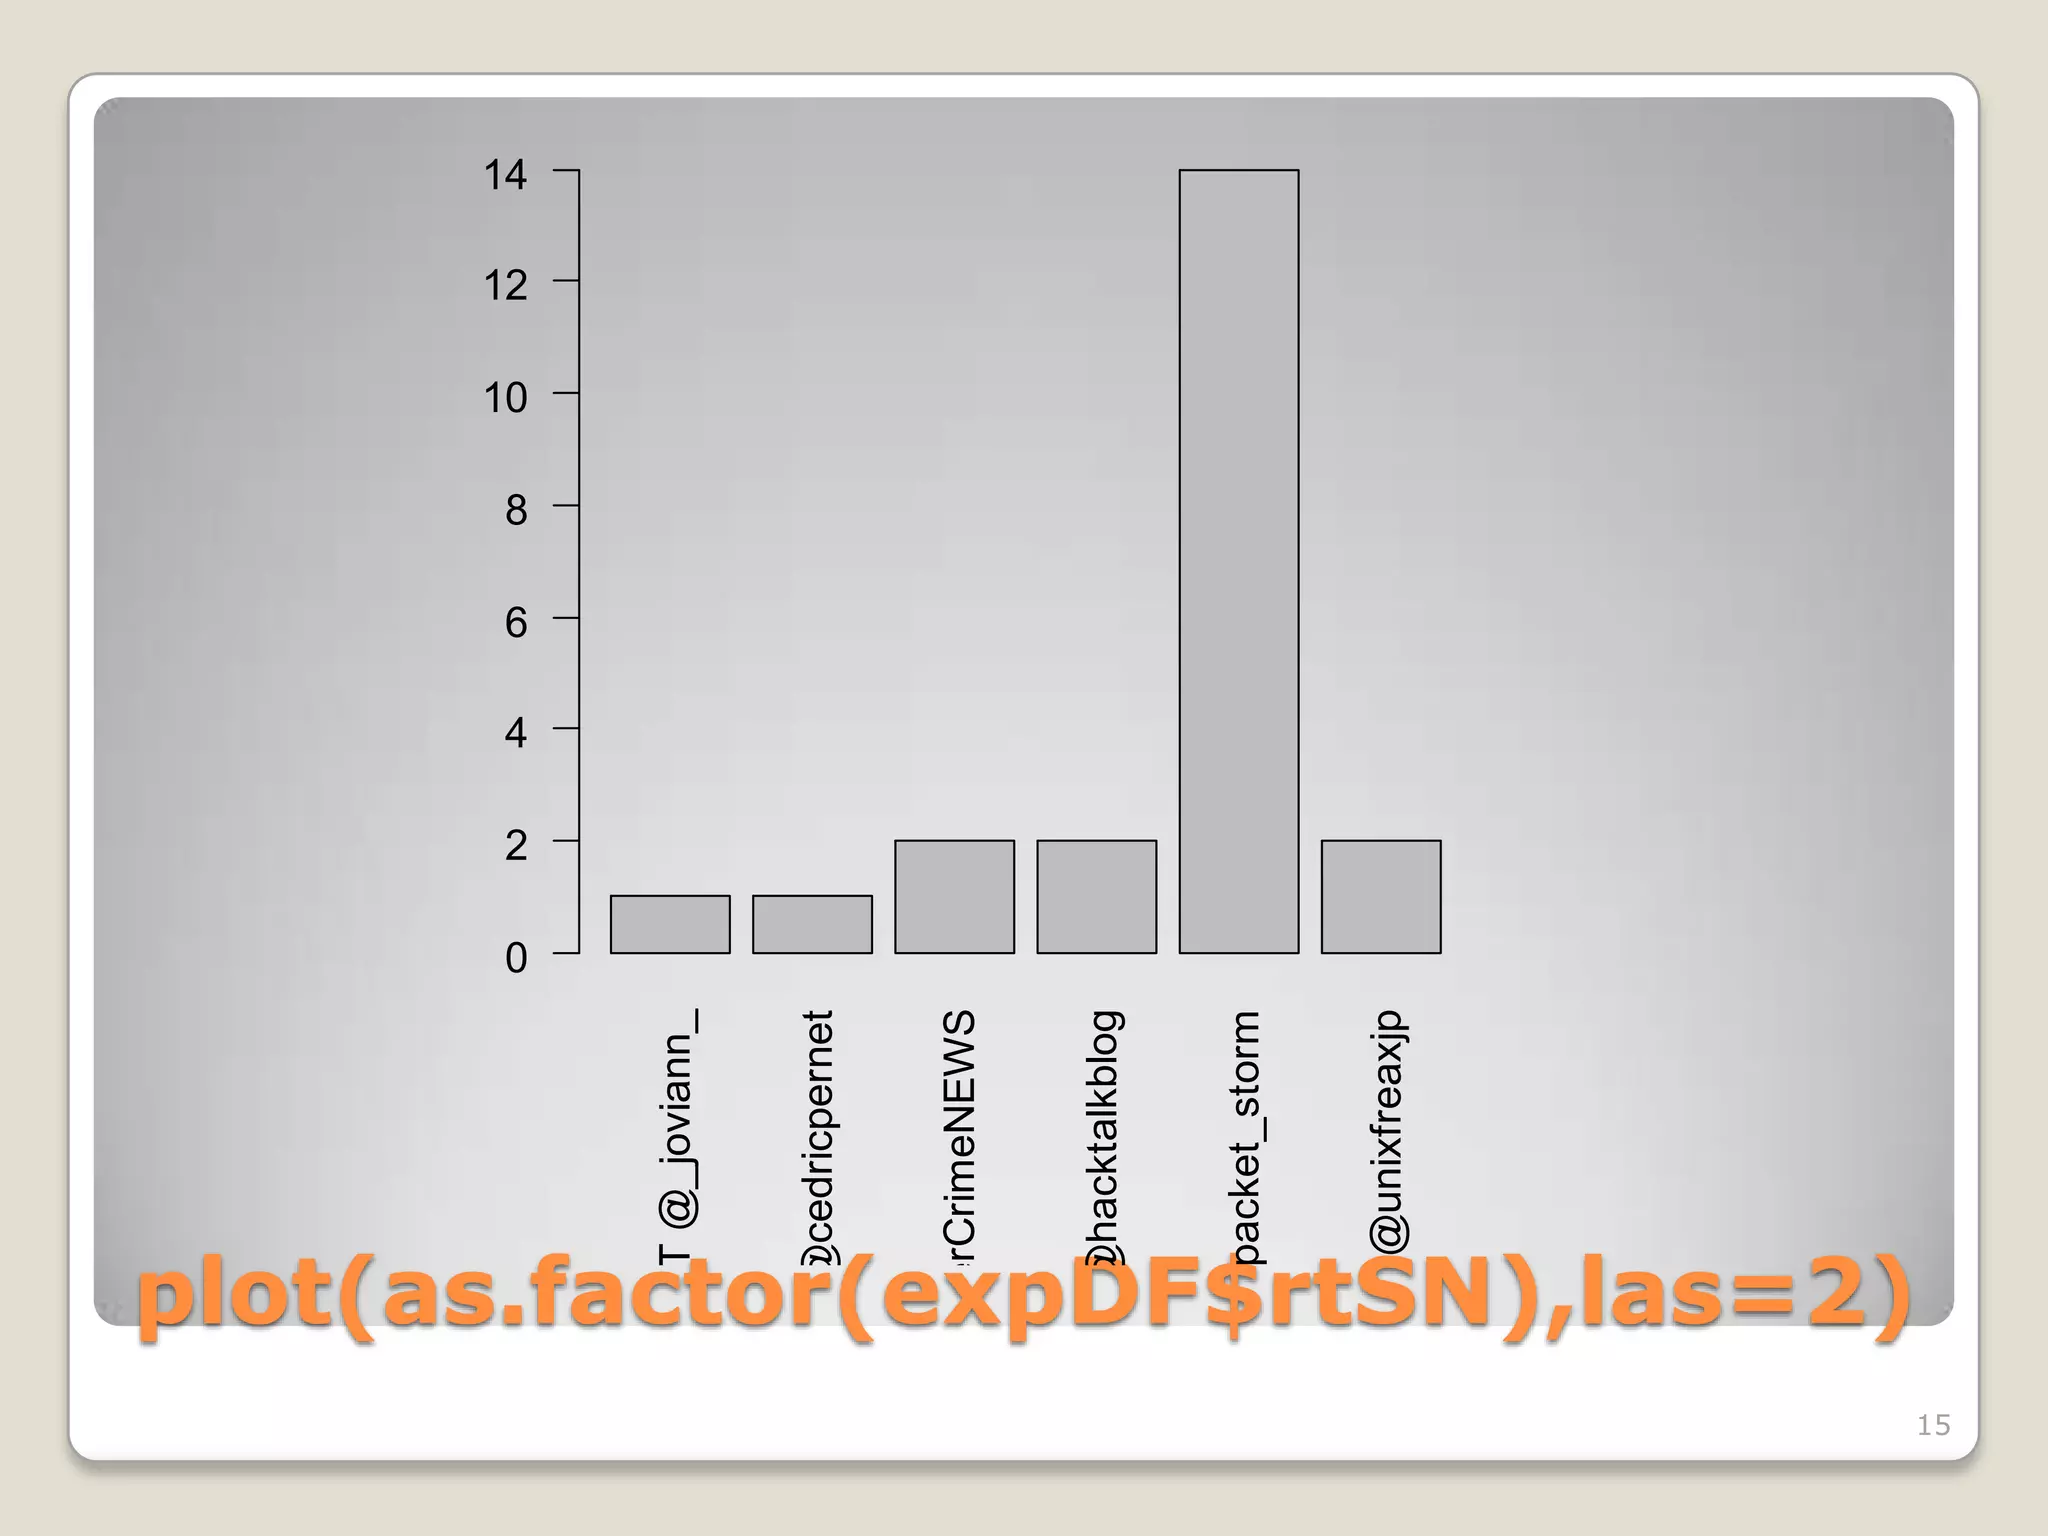
expDF$rtSN = str_match(expDF$text, "^RT
@[[:alnum:]_]*") # Adds a new variable
Do Some Parsing with Regex](https://image.slidesharecdn.com/miningtweetsforsecurityinformation-120126152538-phpapp01/75/Mining-tweets-for-security-information-rev-2-14-2048.jpg)
![exploitWords = strsplit(levels(expDF$text)," ")
exploitWords = unlist(exploitWords)
exploitWords = str_replace_all(exploitWords, "^RT @[[:alnum:]_]*","")
exploitWords = str_replace_all(exploitWords, "@[[:alnum:]_]*","")
exploitWords = str_replace_all(exploitWords, "#Exploit","")
exploitWords = str_replace_all(exploitWords, "#exploit","")
exploitWords = str_replace_all(exploitWords, "^http.*","")
exploitWords = str_replace_all(exploitWords, ":","")
exploitWords = str_replace_all(exploitWords, "_","")
exploitWords = str_replace_all(exploitWords, "-","")
exploitWords = tolower(exploitWords)
exploitWords = sort(exploitWords)
wordCount = summary(as.factor(exploitWords))
wordCount = wordCount[wordCount<(max(wordCount)-1)]
wordCount = wordCount[wordCount>4]
barplot(wordCount,las=2)
Make a Keyword List](https://image.slidesharecdn.com/miningtweetsforsecurityinformation-120126152538-phpapp01/75/Mining-tweets-for-security-information-rev-2-16-2048.jpg)
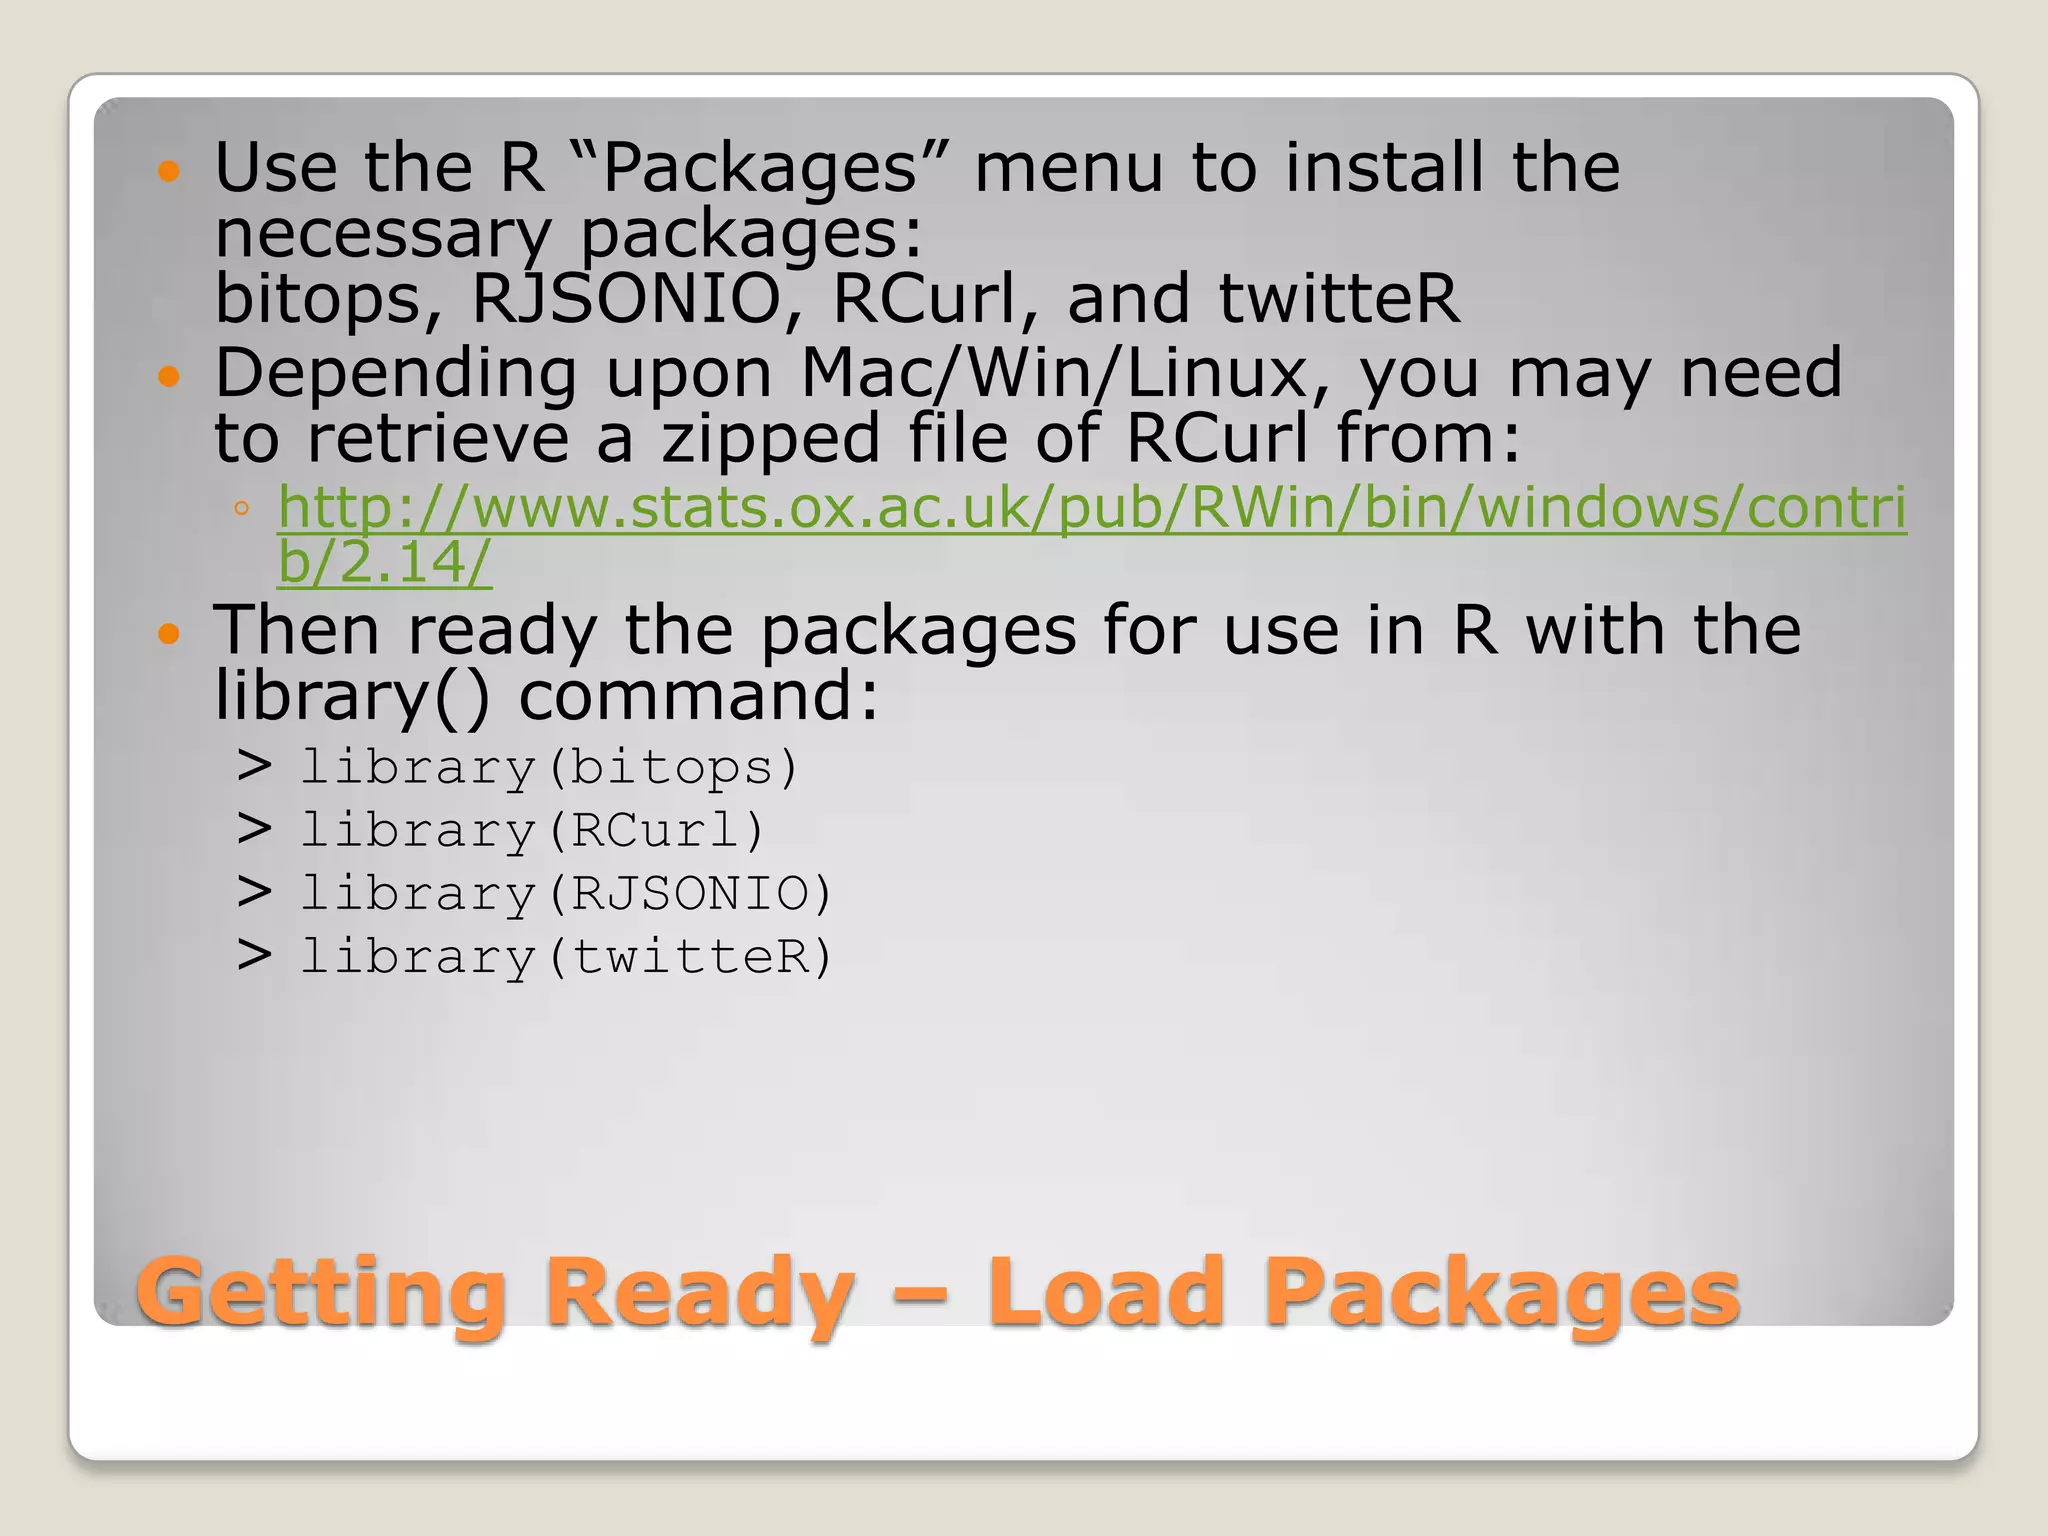
![0
5
10
15
20
25
30
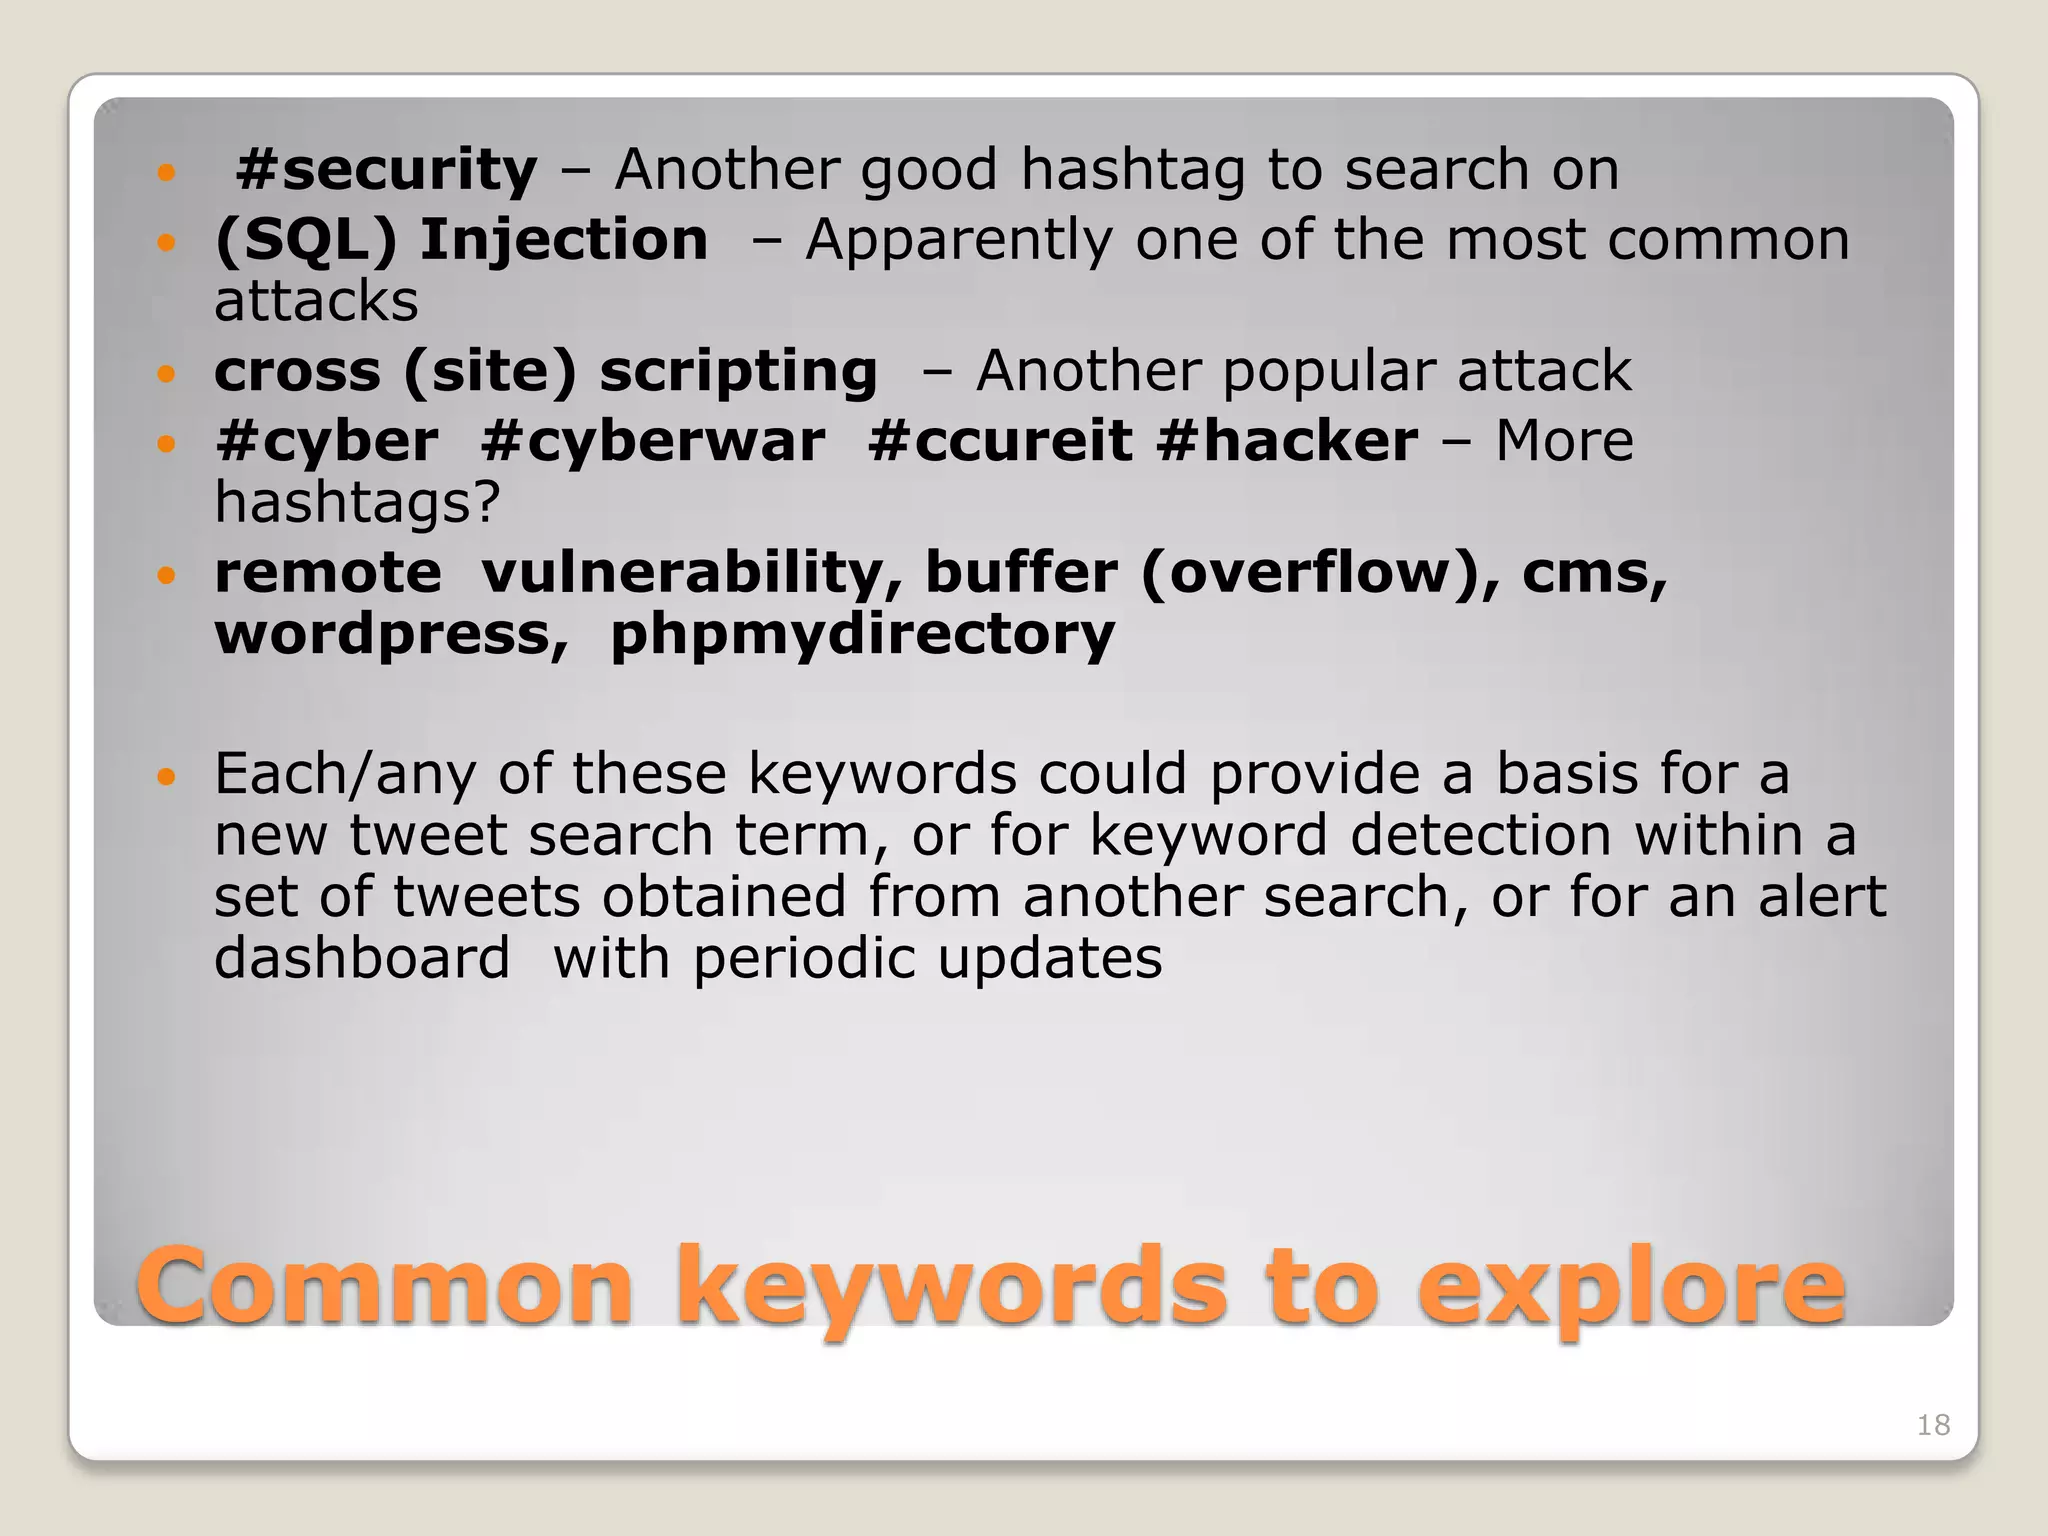
#security
rt
alert
exploit
injection
sql
cross
scripting
site
#ccureit
new
remote
vulnerability
#cyber
#cyberwar
#hacker
buffer
cms
file
and
disclosure
of
1.4
execution
vulnerabilities
wordpress
/
[webapps]
analysis
multiple
overflow
1.3.3
Most common keywords
advanced
code
command
en
for
information
phpmydirectory
with
17](https://image.slidesharecdn.com/miningtweetsforsecurityinformation-120126152538-phpapp01/75/Mining-tweets-for-security-information-rev-2-17-2048.jpg)