Download as PDF, PPTX


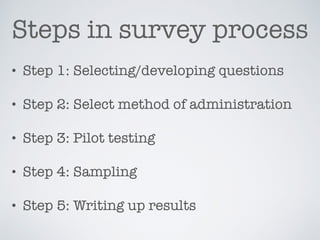


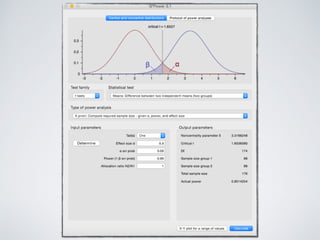
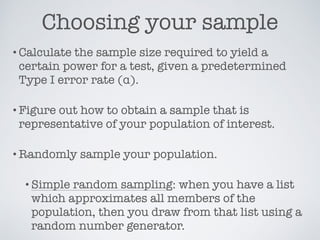


The document outlines the survey process, including selecting questions, methods of administration, and data analysis. It discusses survey types, measurement levels, and best practices for writing questions, such as clarity and response options. Additionally, it delves into statistical concepts like power, effect size, and sampling techniques to ensure accurate and reliable data collection.


![Research Design [Creswell]](https://cdn.slidesharecdn.com/ss_thumbnails/eng60115jan2013-1-130115121702-phpapp01-thumbnail.jpg?width=640&height=640&fit=bounds)