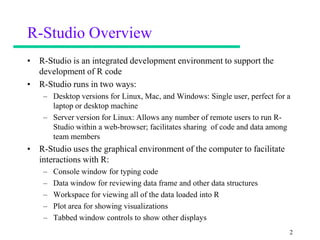
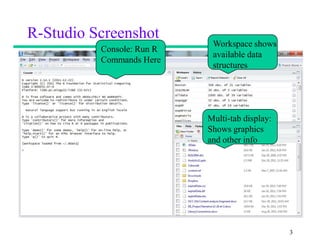
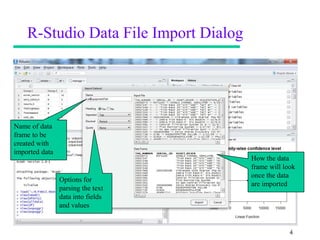
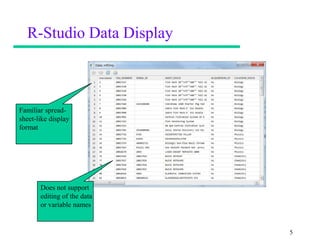
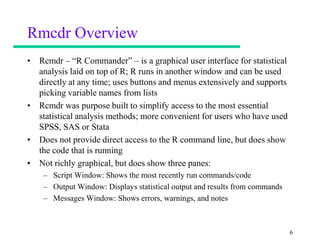
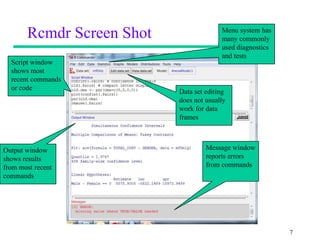
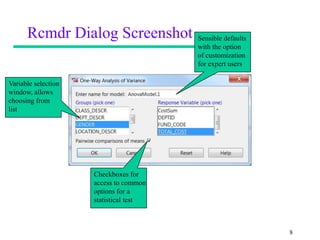
Advanced Data Analytics:
  R-Studio vs. Rcmdr

         Jeffrey Stanton
  School of Information Studies
      Syracuse University
R-Studio Overview
• R-Studio is an integrated development environment to support the
  development of R code
• R-Studio runs in two ways:
    – Desktop versions for Linux, Mac, and Windows: Single user, perfect for a
      laptop or desktop machine
    – Server version for Linux: Allows any number of remote users to run R-
      Studio within a web-browser; facilitates sharing of code and data among
      team members
• R-Studio uses the graphical environment of the computer to facilitate
  interactions with R:
    –   Console window for typing code
    –   Data window for reviewing data frame and other data structures
    –   Workspace for viewing all of the data loaded into R
    –   Plot area for showing visualizations
    –   Tabbed window controls to show other displays
                                                                             2
R-Studio Screenshot
                            Workspace shows
          Console: Run R
                            available data
          Commands Here
                            structures


                           Multi-tab display:
                           Shows graphics
                           and other info


                                                3
R-Studio Data File Import Dialog


Name of data
frame to be
created with
imported data
                                       How the data
                                       frame will look
                                       once the data
                Options for
                                       are imported
                parsing the text
                data into fields
                and values


                                                    4
R-Studio Data Display


Familiar spread-
sheet-like display
format


       Does not support
       editing of the data
       or variable names


                             5
Rmcdr Overview
• Rcmdr – “R Commander” – is a graphical user interface for statistical
  analysis laid on top of R; R runs in another window and can be used
  directly at any time; uses buttons and menus extensively and supports
  picking variable names from lists
• Rcmdr was purpose built to simplify access to the most essential
  statistical analysis methods; more convenient for users who have used
  SPSS, SAS or Stata
• Does not provide direct access to the R command line, but does show
  the code that is running
• Not richly graphical, but does show three panes:
    – Script Window: Shows the most recently run commands/code
    – Output Window: Displays statistical output and results from commands
    – Messages Window: Shows errors, warnings, and notes


                                                                             6
Rcmdr Screen Shot                 Menu system has
                                         many commonly
                                         used diagnostics
                                         and tests
  Script window
  shows most
  recent commands
  or code
                           Data set editing
                           does not usually
                           work for data
                           frames


Output window                       Message window
shows results                       reports errors
from most recent                    from commands
commands


                                                            7
Rcmdr Dialog Screenshot           Sensible defaults
                                        with the option
                                        of customization
                                        for expert users

Variable selection
window, allows
choosing from
list


                     Checkboxes for
                     access to common
                     options for a
                     statistical test


                                                            8
Comparison and Guidelines
• R-Studio is more flexible and powerful, and provides direct access to R
  code
• Rcmdr is simpler and more user friendly, particularly when focusing on
  statistical diagnostics and analysis
• Both are good for viewing data, neither is good for editing it
• Use Rcmdr with structured, conventional data (rectangular, with
  variables in columns and cases in rows), whenever the task involves
  running statistical tests
• Use R-studio for any project that requires direct interaction with code
  and/or manipulation of complex data
• Note that you can invoke Rcmdr from within R-Studio and it will work
  fine on a single user installation; also note that when the user requests a
  plot in Rcmdr, it will NOT immediately appear in the plot window of R-
  Studio – this is a known bug that may be fixed in future versions

                                                                           9
What Else is Brewing?
• JGR (Jaguar) – A cross platform console interface that
  provides a spreadsheet-like data editor
• Deducer – A conventional statistics GUI
  overlaid on JGR


                              • RKWard – A conventional
                                statistics GUI using KDE
                                (mainly for Linux, but has a
                                Windows installer)
                                                           10
Demonstrating Mastery
• If you have not already done so, install and run R-Studio
• Import a data set into R-Studio using the “Import Dataset”
  dialog (usually a button on the Workspace tab in the upper
  right pane)
• In addition, install the Rcmdr package and “library(Rcmdr)”
  to start the graphical interface (for assistance, see Chapter 2
  of Thomas Hogan’s “Bare Bones R”
• In Rcmdr, make your imported data the “active” data set and
  use the menus to run any statistical diagnostic or test


                                                              11

R-Studio Vs. Rcmdr

  • 1.
    Advanced Data Analytics: R-Studio vs. Rcmdr Jeffrey Stanton School of Information Studies Syracuse University
  • 2.
    R-Studio Overview • R-Studiois an integrated development environment to support the development of R code • R-Studio runs in two ways: – Desktop versions for Linux, Mac, and Windows: Single user, perfect for a laptop or desktop machine – Server version for Linux: Allows any number of remote users to run R- Studio within a web-browser; facilitates sharing of code and data among team members • R-Studio uses the graphical environment of the computer to facilitate interactions with R: – Console window for typing code – Data window for reviewing data frame and other data structures – Workspace for viewing all of the data loaded into R – Plot area for showing visualizations – Tabbed window controls to show other displays 2
  • 3.
    R-Studio Screenshot Workspace shows Console: Run R available data Commands Here structures Multi-tab display: Shows graphics and other info 3
  • 4.
    R-Studio Data FileImport Dialog Name of data frame to be created with imported data How the data frame will look once the data Options for are imported parsing the text data into fields and values 4
  • 5.
    R-Studio Data Display Familiarspread- sheet-like display format Does not support editing of the data or variable names 5
  • 6.
    Rmcdr Overview • Rcmdr– “R Commander” – is a graphical user interface for statistical analysis laid on top of R; R runs in another window and can be used directly at any time; uses buttons and menus extensively and supports picking variable names from lists • Rcmdr was purpose built to simplify access to the most essential statistical analysis methods; more convenient for users who have used SPSS, SAS or Stata • Does not provide direct access to the R command line, but does show the code that is running • Not richly graphical, but does show three panes: – Script Window: Shows the most recently run commands/code – Output Window: Displays statistical output and results from commands – Messages Window: Shows errors, warnings, and notes 6
  • 7.
    Rcmdr Screen Shot Menu system has many commonly used diagnostics and tests Script window shows most recent commands or code Data set editing does not usually work for data frames Output window Message window shows results reports errors from most recent from commands commands 7
  • 8.
    Rcmdr Dialog Screenshot Sensible defaults with the option of customization for expert users Variable selection window, allows choosing from list Checkboxes for access to common options for a statistical test 8
  • 9.
    Comparison and Guidelines •R-Studio is more flexible and powerful, and provides direct access to R code • Rcmdr is simpler and more user friendly, particularly when focusing on statistical diagnostics and analysis • Both are good for viewing data, neither is good for editing it • Use Rcmdr with structured, conventional data (rectangular, with variables in columns and cases in rows), whenever the task involves running statistical tests • Use R-studio for any project that requires direct interaction with code and/or manipulation of complex data • Note that you can invoke Rcmdr from within R-Studio and it will work fine on a single user installation; also note that when the user requests a plot in Rcmdr, it will NOT immediately appear in the plot window of R- Studio – this is a known bug that may be fixed in future versions 9
  • 10.
    What Else isBrewing? • JGR (Jaguar) – A cross platform console interface that provides a spreadsheet-like data editor • Deducer – A conventional statistics GUI overlaid on JGR • RKWard – A conventional statistics GUI using KDE (mainly for Linux, but has a Windows installer) 10
  • 11.
    Demonstrating Mastery • Ifyou have not already done so, install and run R-Studio • Import a data set into R-Studio using the “Import Dataset” dialog (usually a button on the Workspace tab in the upper right pane) • In addition, install the Rcmdr package and “library(Rcmdr)” to start the graphical interface (for assistance, see Chapter 2 of Thomas Hogan’s “Bare Bones R” • In Rcmdr, make your imported data the “active” data set and use the menus to run any statistical diagnostic or test 11