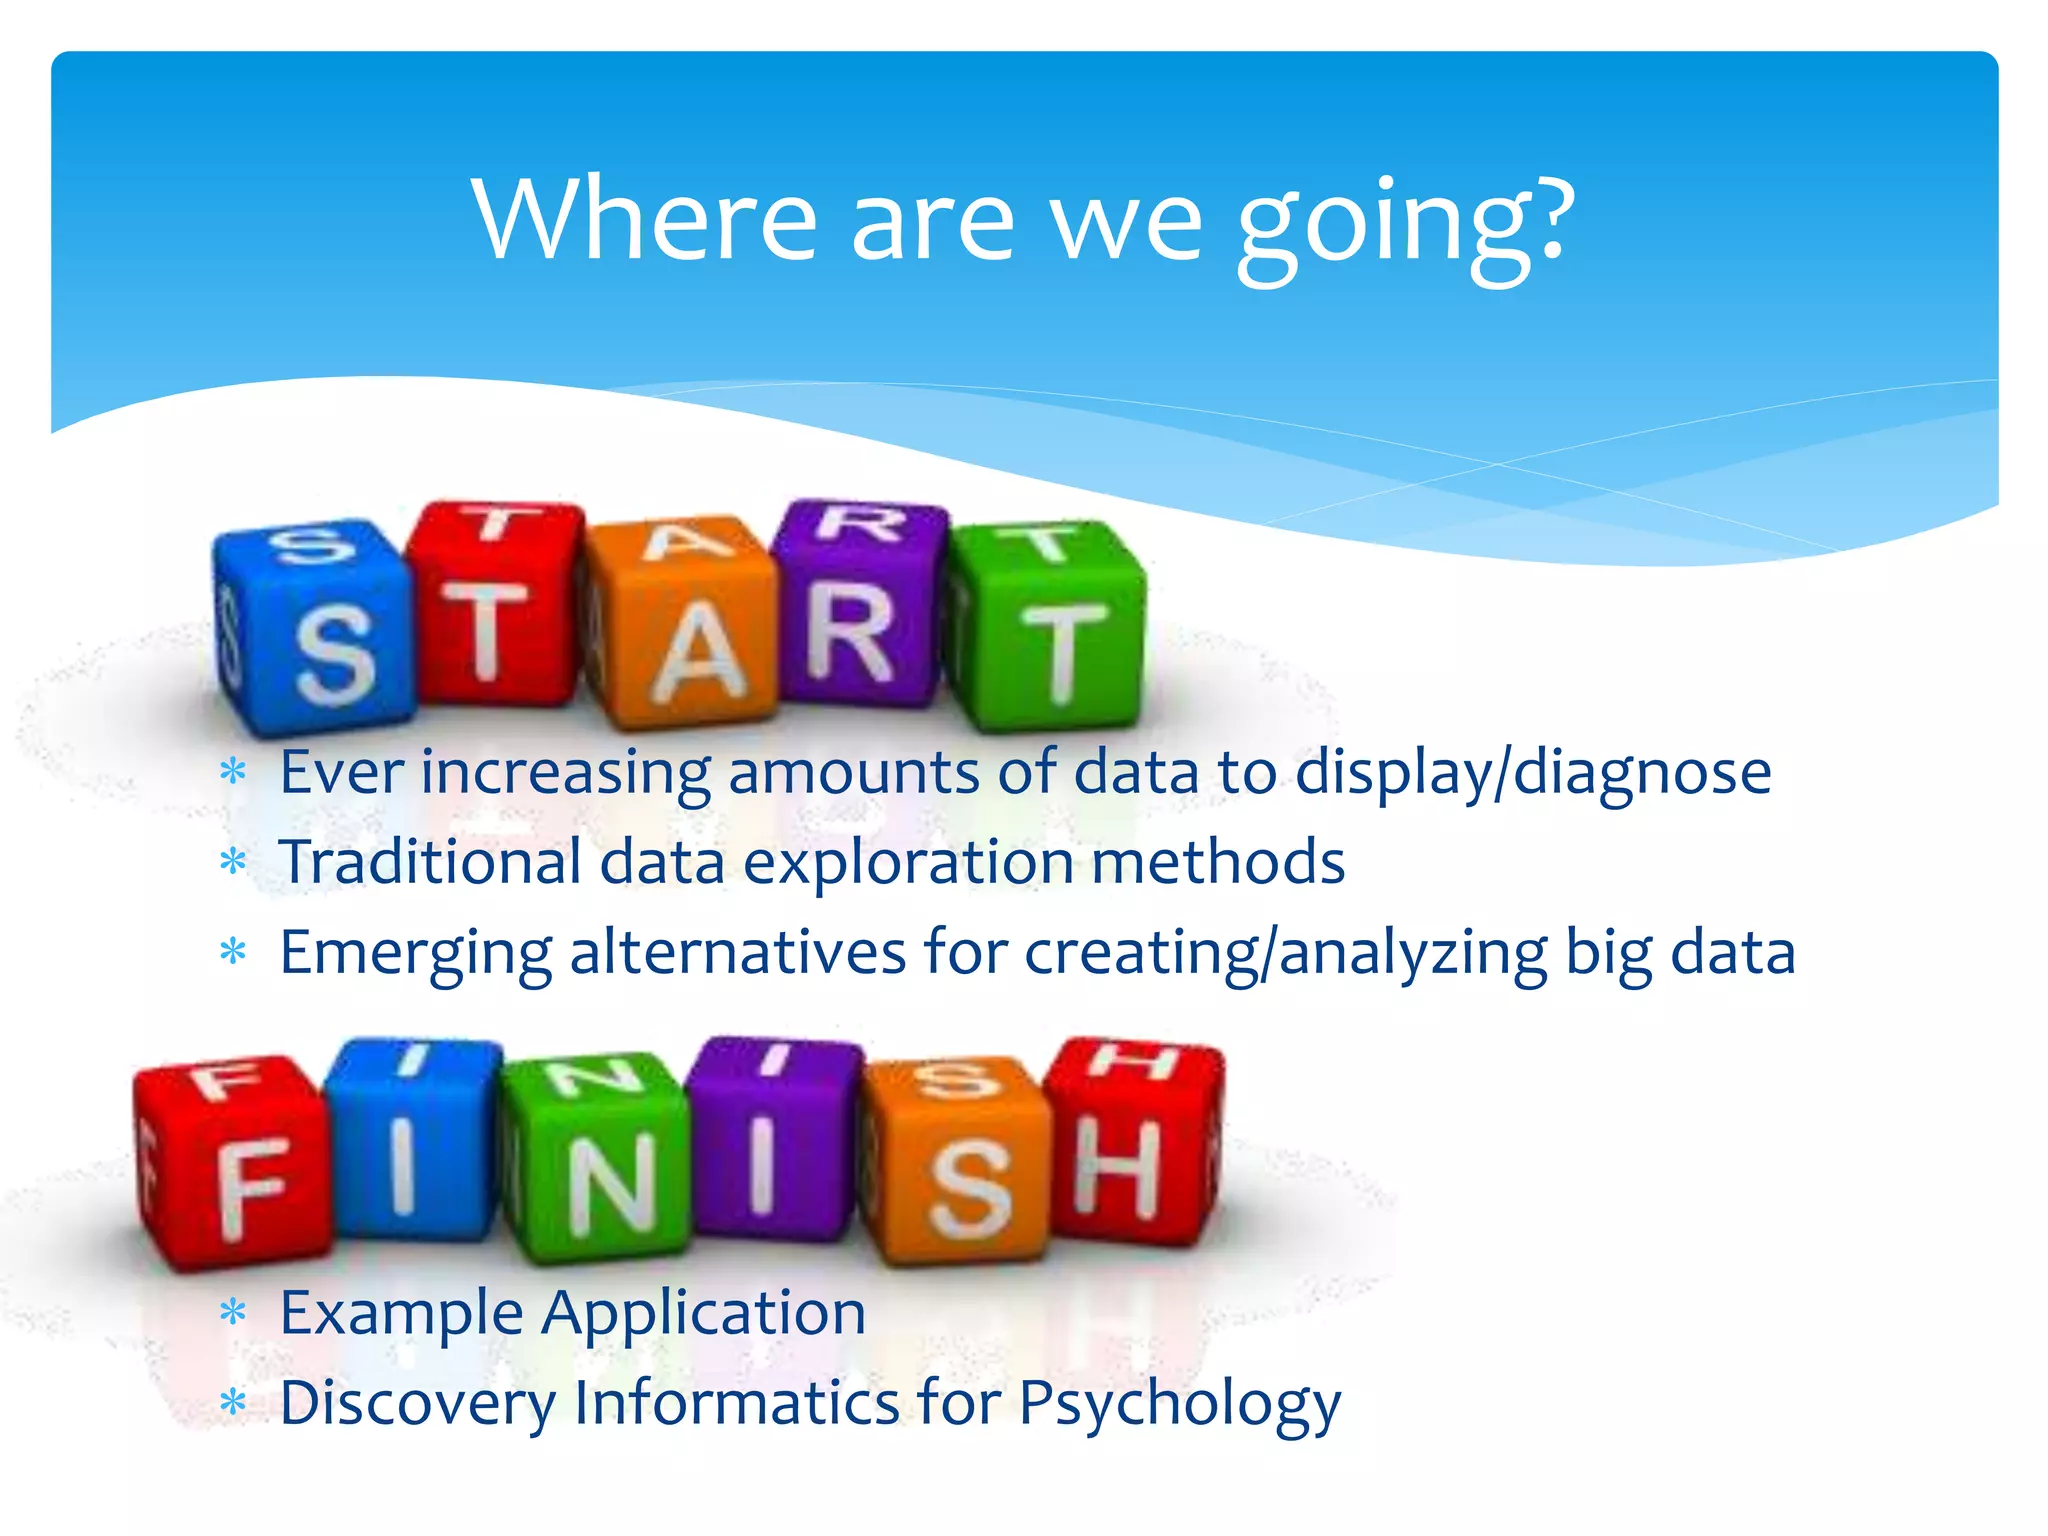
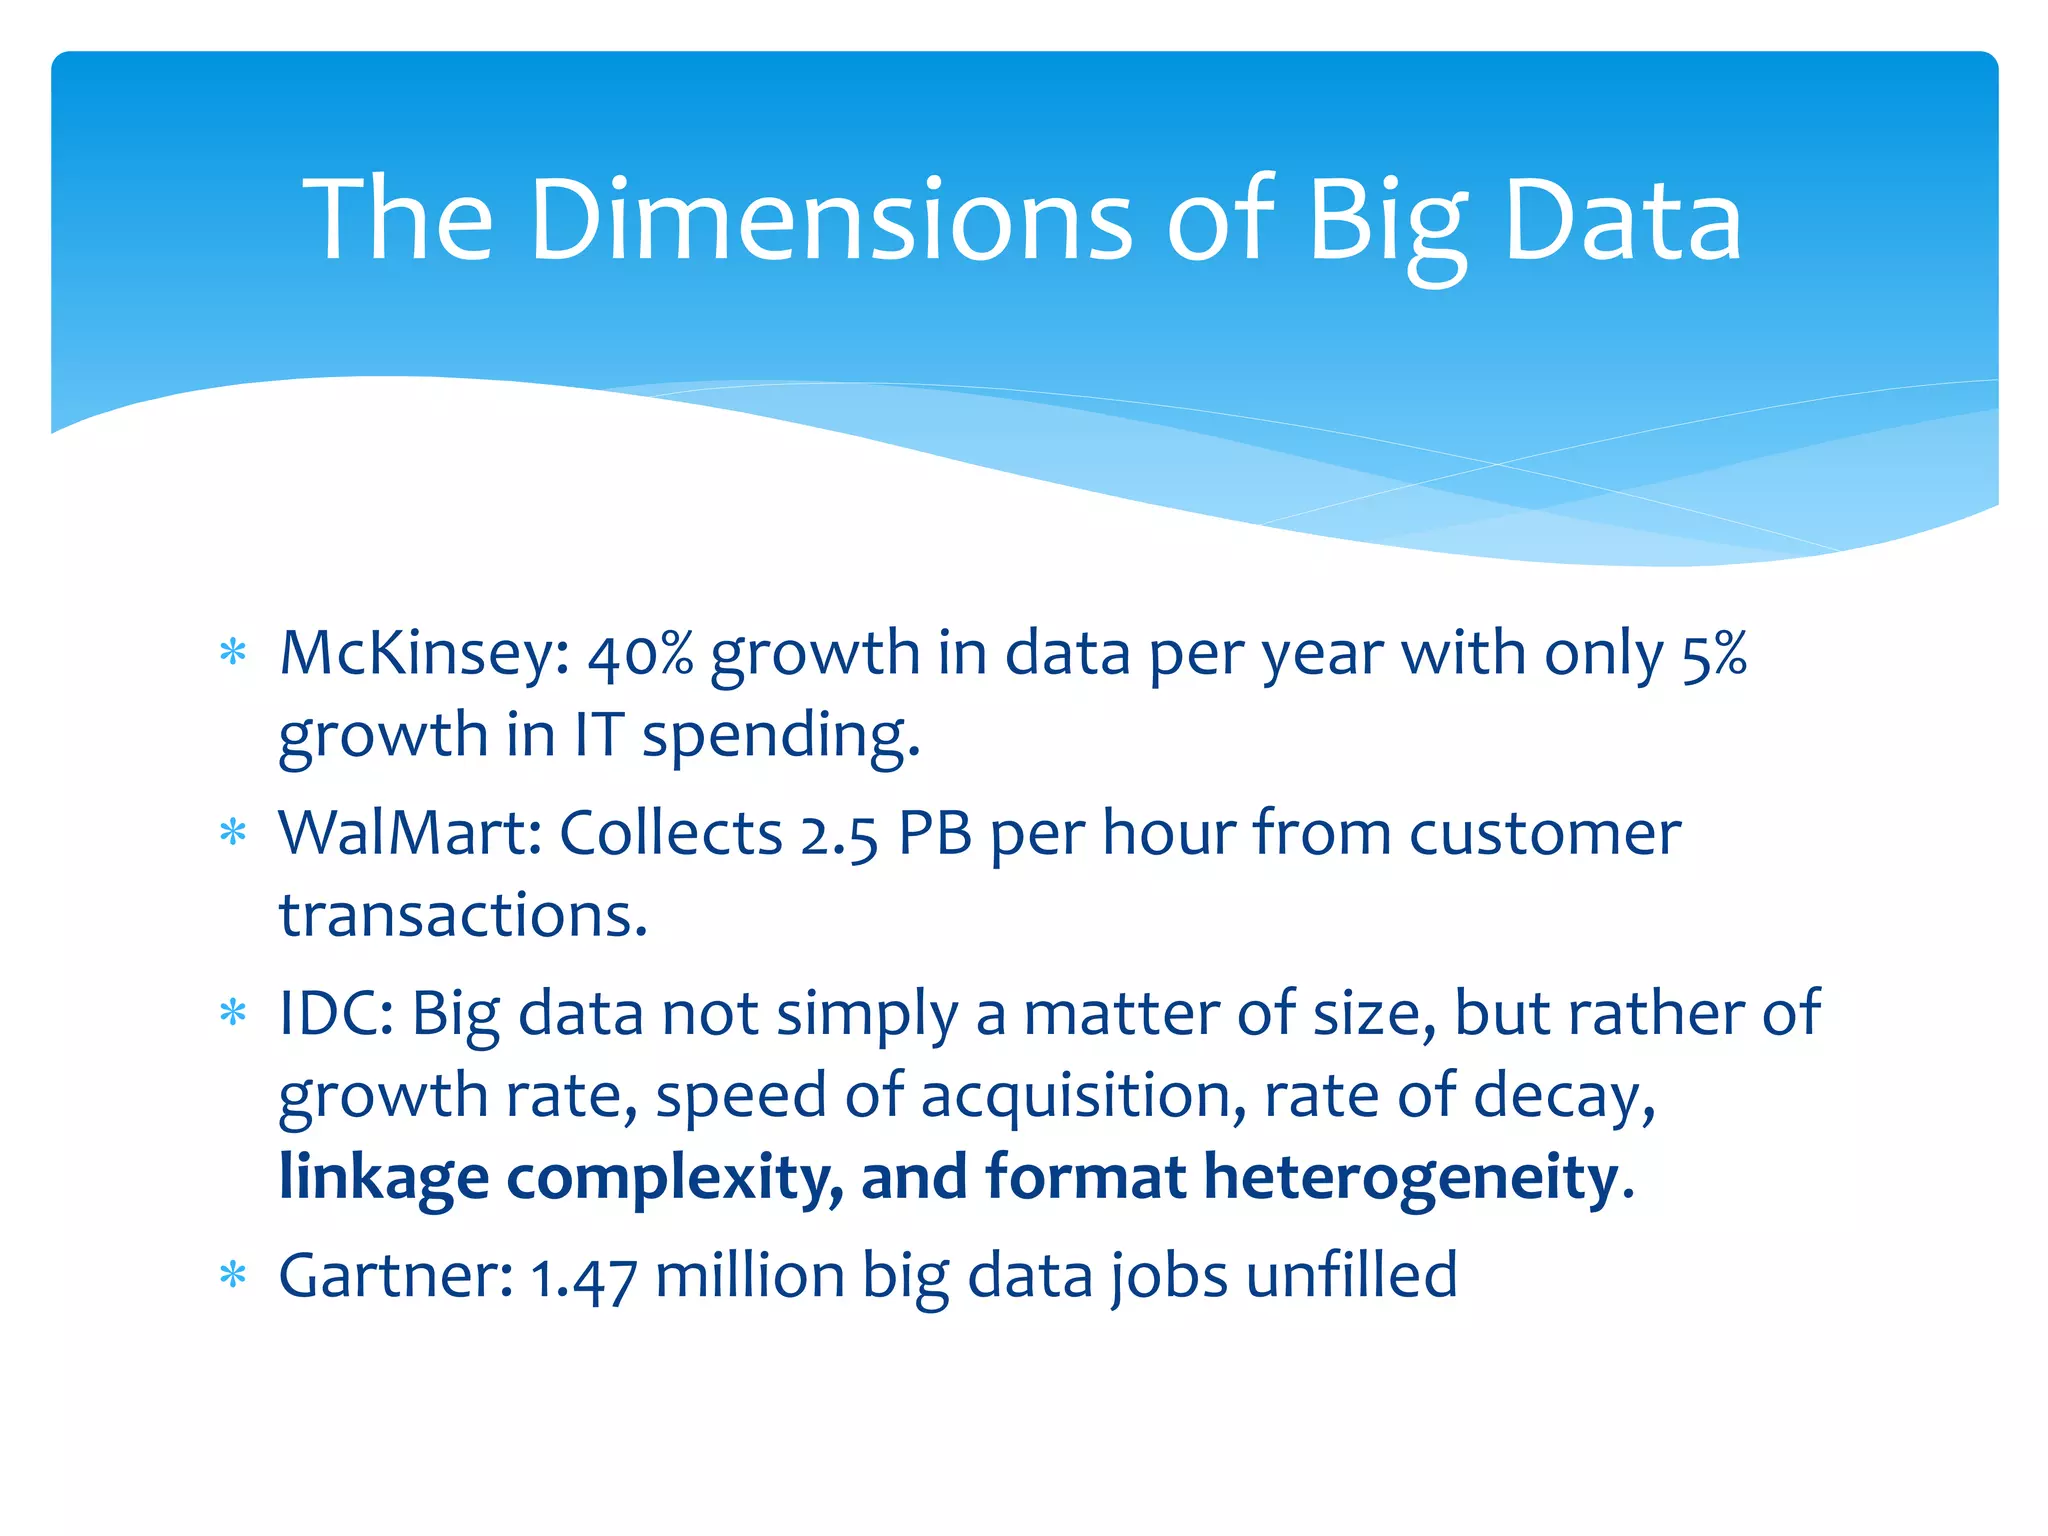
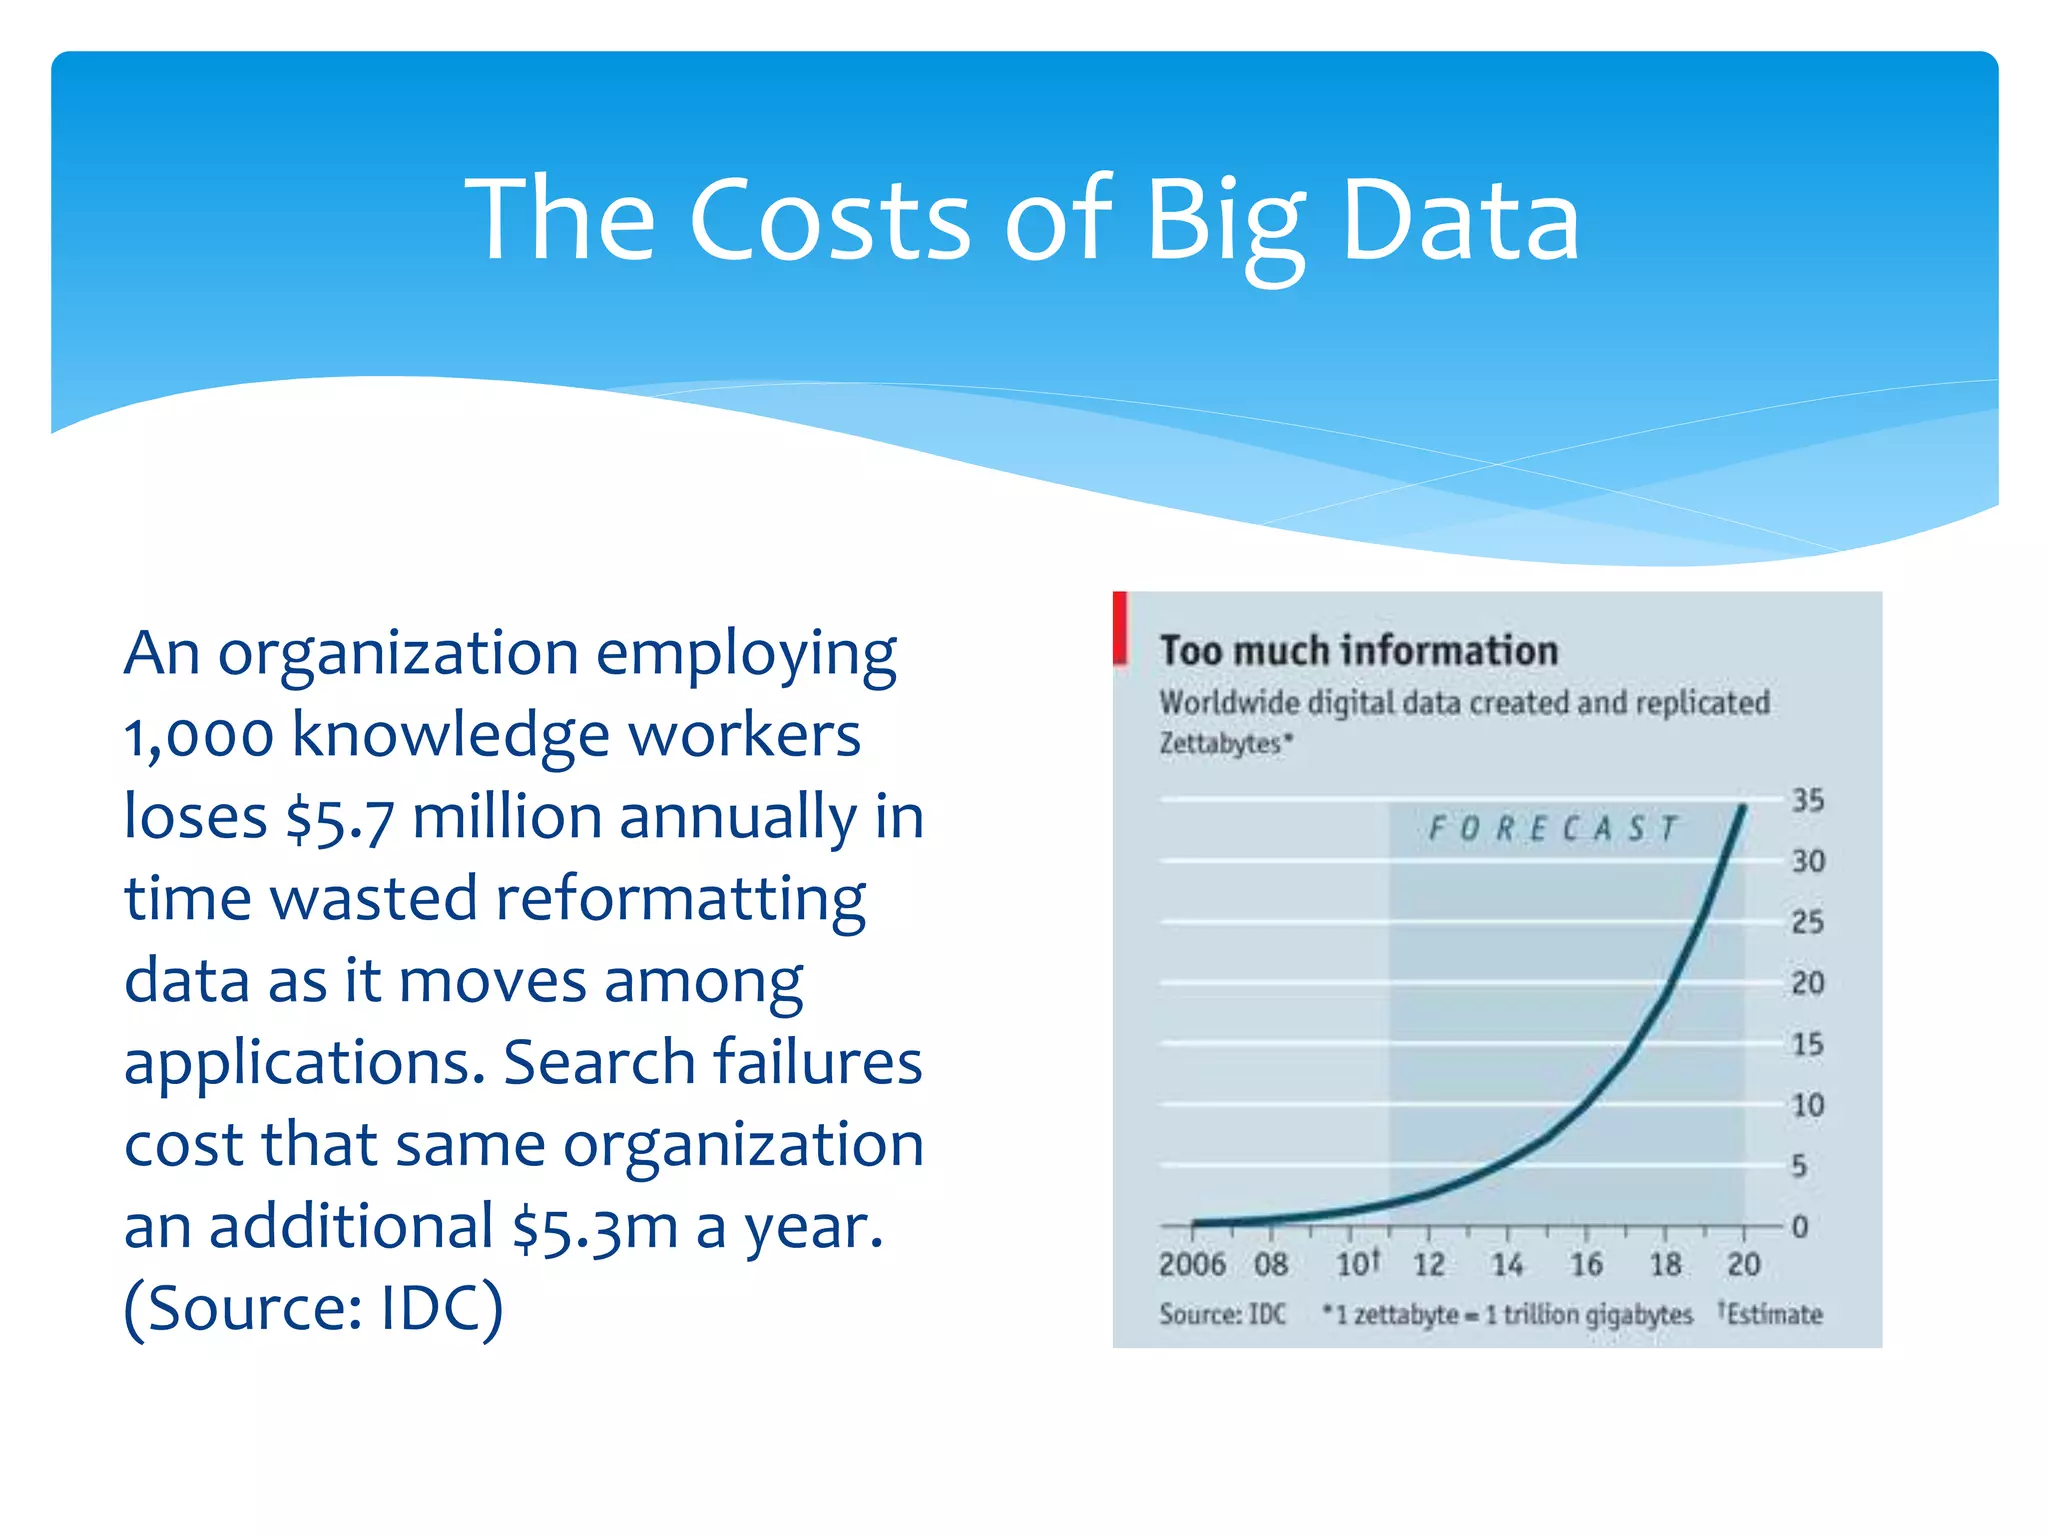
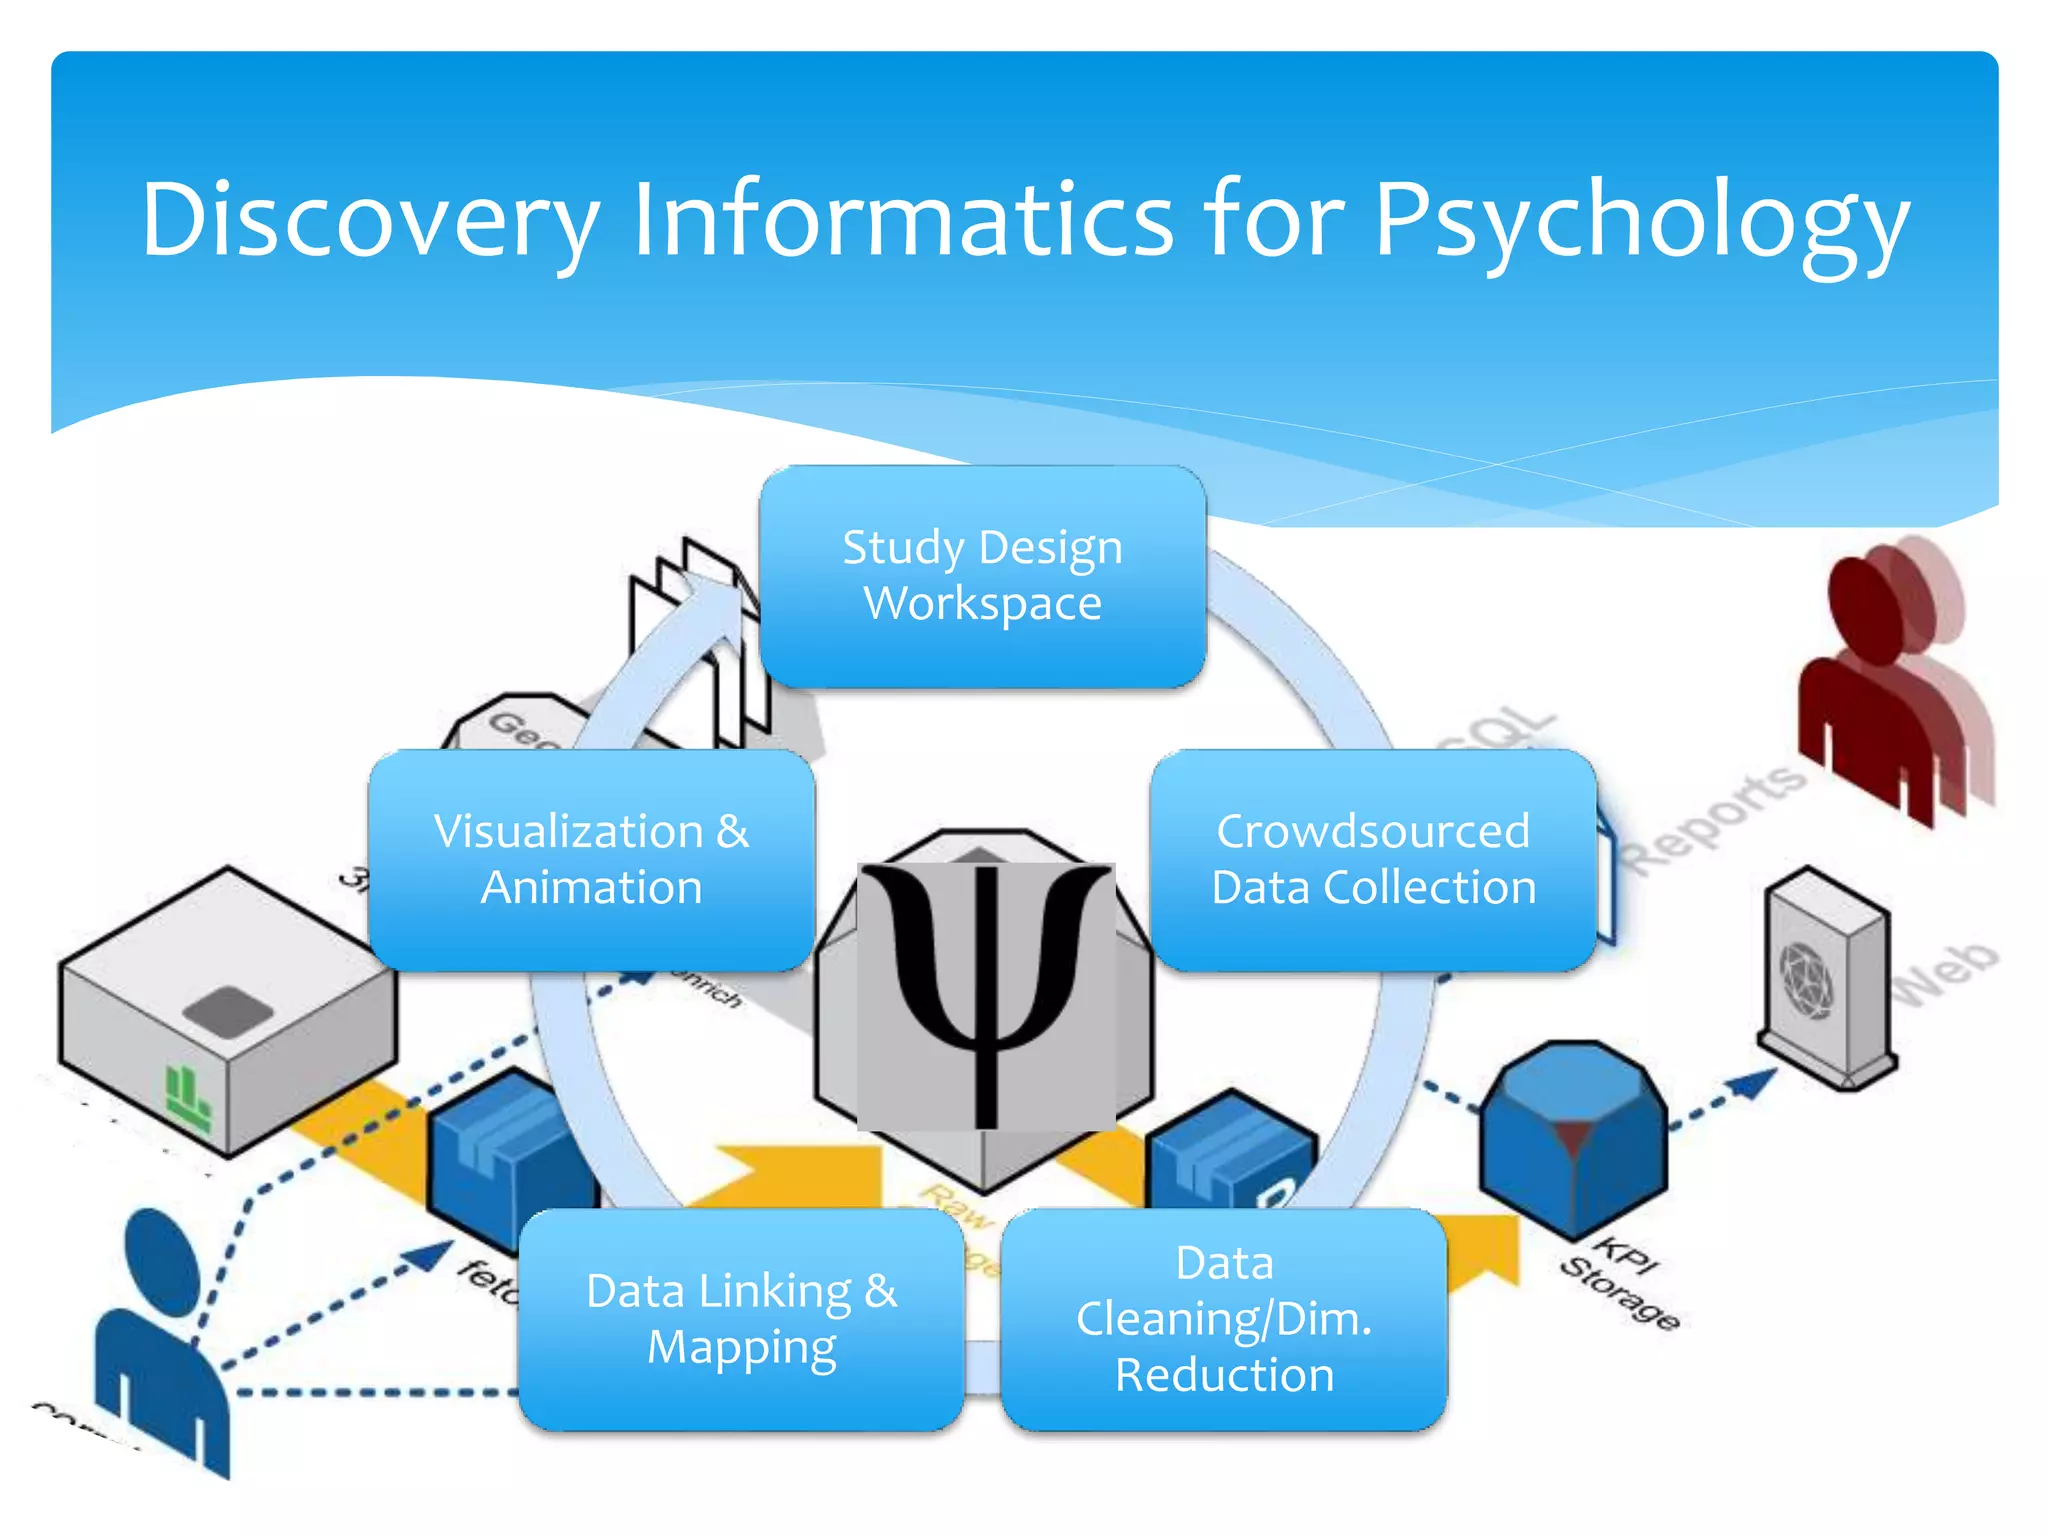
Discovery Informatics:
Multimodal Information Interfaces
for Creating & Analyzing Large
Data Sets
By Jeff Stanton
School of Information Studies
Syracuse University
Where are we going?
 Ever increasing amounts of data to display/diagnose
 Traditional data exploration methods
 Emerging alternatives for creating/analyzing big data
 Example Application
 Discovery Informatics for Psychology
 McKinsey: 40% growth in data per year with only 5%
growth in IT spending.
 WalMart: Collects 2.5 PB per hour from customer
transactions.
 IDC: Big data not simply a matter of size, but rather of
growth rate, speed of acquisition, rate of decay,
linkage complexity, and format heterogeneity.
 Gartner: 1.47 million big data jobs unfilled
The Dimensions of Big Data
An organization employing
1,000 knowledge workers
loses $5.7 million annually in
time wasted reformatting
data as it moves among
applications. Search failures
cost that same organization
an additional $5.3m a year.
(Source: IDC)
The Costs of Big Data
The (Human) Cost of “Joins”
R/R-Studio
Commercial support
from R comes from
Revolution Analytics;
Oracle, IBM,
Mathematica, SPSS,
are among the major
companies offering R
integration
IBM Platform HPC
provides parallel
computing options
for R (jaql, netezza)
0
1
2
3
4
5
Channels
(log)
Kbits/Sec
(log) Frame
Rate, Hz
Sensing Big Data
Rough estimates based
on Balasubramanian
(2006), Current Biology
• Hearing is multi-directional – does not require attentional focus on a single source
• Hearing is the most acute of the senses in detecting the frequency of occurrence
of events – as little as 5 ms apart
• Hearing supports “multi-tasking” by allowing the brain to detect events occurring
at different frequencies and time-scales simultaneously
Pitch discrimination: >90 pitches
Loudness discrimination: >40 levels
Timing discrimination: 20 ms
Horizontal localization: ~8 positions
Vertical localization: ~4 positions
Timbre variations: ∞
Image credit: “The Five
Senses” by Fabio Pantoja
Holographic Table Display
Example Application
1. Research goal: Translate selection test items and re-check
psychometric characteristics
2. Assemble baseline data from validation study(ies) in original
language
3. Crowdsource item and answer translations with bilingual
native speakers
4. Use natural language processing to visualize most common
wording variations by regional dialect by linking to map data
5. Choose most universal item texts and answers
6. Crowdsource backtranslations with bilingual native speakers;
return to step 3 as needed
7. Deploy final version of test; compare results to baseline data
and return to step 3 as needed
Discovery Informatics for Psychology
Study Design
Workspace
Crowdsourced
Data Collection
Data
Cleaning/Dim.
Reduction
Data Linking &
Mapping
Visualization &
Animation

Discovery informaticsstanton

  • 1.
    Discovery Informatics: Multimodal InformationInterfaces for Creating & Analyzing Large Data Sets By Jeff Stanton School of Information Studies Syracuse University
  • 2.
    Where are wegoing?  Ever increasing amounts of data to display/diagnose  Traditional data exploration methods  Emerging alternatives for creating/analyzing big data  Example Application  Discovery Informatics for Psychology
  • 3.
     McKinsey: 40%growth in data per year with only 5% growth in IT spending.  WalMart: Collects 2.5 PB per hour from customer transactions.  IDC: Big data not simply a matter of size, but rather of growth rate, speed of acquisition, rate of decay, linkage complexity, and format heterogeneity.  Gartner: 1.47 million big data jobs unfilled The Dimensions of Big Data
  • 4.
    An organization employing 1,000knowledge workers loses $5.7 million annually in time wasted reformatting data as it moves among applications. Search failures cost that same organization an additional $5.3m a year. (Source: IDC) The Costs of Big Data
  • 5.
    The (Human) Costof “Joins”
  • 6.
    R/R-Studio Commercial support from Rcomes from Revolution Analytics; Oracle, IBM, Mathematica, SPSS, are among the major companies offering R integration IBM Platform HPC provides parallel computing options for R (jaql, netezza)
  • 9.
    0 1 2 3 4 5 Channels (log) Kbits/Sec (log) Frame Rate, Hz SensingBig Data Rough estimates based on Balasubramanian (2006), Current Biology • Hearing is multi-directional – does not require attentional focus on a single source • Hearing is the most acute of the senses in detecting the frequency of occurrence of events – as little as 5 ms apart • Hearing supports “multi-tasking” by allowing the brain to detect events occurring at different frequencies and time-scales simultaneously Pitch discrimination: >90 pitches Loudness discrimination: >40 levels Timing discrimination: 20 ms Horizontal localization: ~8 positions Vertical localization: ~4 positions Timbre variations: ∞ Image credit: “The Five Senses” by Fabio Pantoja
  • 11.
  • 14.
    Example Application 1. Researchgoal: Translate selection test items and re-check psychometric characteristics 2. Assemble baseline data from validation study(ies) in original language 3. Crowdsource item and answer translations with bilingual native speakers 4. Use natural language processing to visualize most common wording variations by regional dialect by linking to map data 5. Choose most universal item texts and answers 6. Crowdsource backtranslations with bilingual native speakers; return to step 3 as needed 7. Deploy final version of test; compare results to baseline data and return to step 3 as needed
  • 15.
    Discovery Informatics forPsychology Study Design Workspace Crowdsourced Data Collection Data Cleaning/Dim. Reduction Data Linking & Mapping Visualization & Animation

Editor's Notes

  • #2 What’s the picture behind these words?
  • #4 Data are available on a scale millions of times larger than 20 years ago: everything from customer transactions; environmental sensor outputs; genetic and epigenetic sequences; to web documents; digital images, and audio. Additionally, any one person or department has access to a highly heterogeneous range of data sets, with different representations and formats; mixtures of structured and unstructured data; some, little, or no metadata; distributed across systems both old and new. Perhaps one result of the vast increase in the amount of data and its heterogeneity is a chaotic information life cycle, where relatively less and less time and effort is spent on what should be kept, cleaned, and processed versus what can be discarded. The incredibly low cost of storage just exacerbates this trend: We want to keep everything in the hope that it might one day be valuable, whereas all we get is data clutter.
  • #5 A related issue arises from the diversity of systems, especially legacy infrastructure: mainframes running Cobol connected with high speed networks to sensor arrays running Linux. There are about 200 billion lines of COBOL code in existence, with an estimate 5 billion new lines added every year all for a language that is about as popular as Fortran. Gluing these legacy systems together, as we have seen in the case of the federal heath care exchange, is complex and expensive. One last point: The more data that an organization captures and stores, the harder it gets to find what you need.
  • #6 Joins are the tip of the iceberg – variable recoding, rescaling, binning; missing data mitigation and imputation; outlier detection and adjustment; dimension reduction.
  • #7 This is a screen shot of R-studio, which is one of the most popular integrated development environments for R. Both R and R-Studio are open source software programs. R-Studio was created an is maintained by JJ Allaire, who also created ColdFusion, and Hadley Wickham, author of the R visiualization package known as ggplot2. R-Studio contains a code editing window with typical authoring and debugging features, an R console, a workspace and data manager, and a fourth window for plot, package management, and help. Like Linux, R is supported by a for-profit company called Revolution Analytics. Major database and software vendors have also created connections between their products and R.
  • #10 Neuhoff (2011): “…when it comes to rhythmic perception and temporal resolution, the auditory system tends to perform significantly better than the visual system.” Each of the human senses has a particular strength. Vision is the overall winner with respect to data throughput: The eyes relay more information back to the brain more quickly than most of the other senses combined. While you have two eyes and two ears, taste wins on the number of separate channels: Five channels, one each for salt, sweet, bitter, sour, and umami. Umami is the taste sense of savory, or glutamates, and is key in giving that “meaty” flavor that you get from meat. But hearing wins hands down against the other senses in the resolution of time. The eye sees at a frame rate of about 17 times per second (about 59 ms per frame), which is why TV and movies can fool the eye into believing that a series of still pictures is in motion. But the sense of hearing can discern two events as little as 5 ms apart (clicks only; more complex sounds are 20 to 40 ms). That is a frame rate of up to 200 events per second. And that is just with one ear. If we include both ears, even more possibilities open up. Reference: Vijay Balasubramanian, Current Biology (vol 16, p 1428)