Downloaded 1,025 times


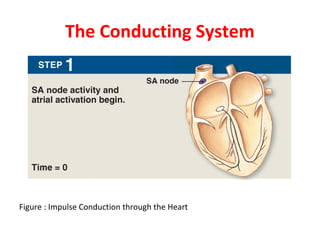

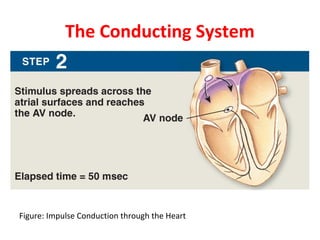
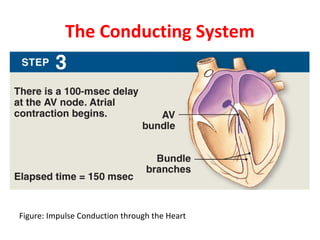
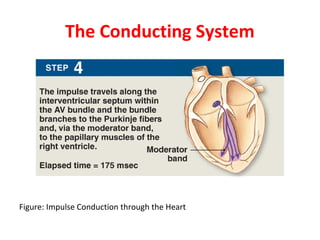


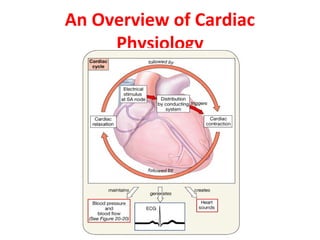


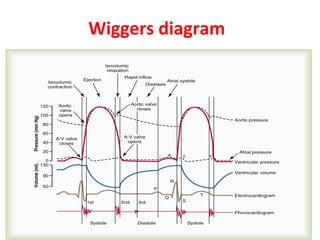

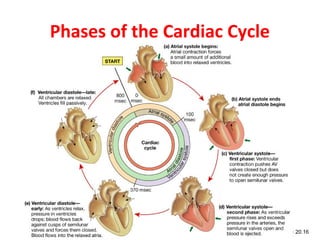

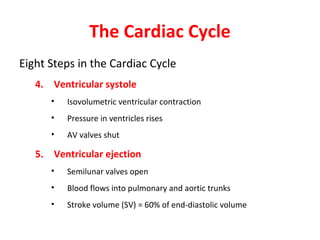

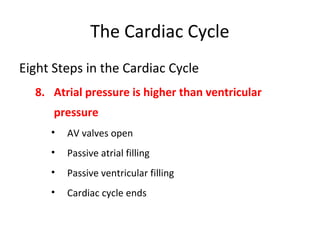


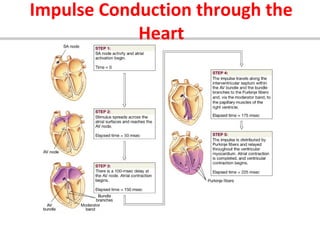


The cardiac cycle describes the repeating sequence of events in the heart during one heartbeat. It begins with atrial systole which fills the ventricles with blood. This is followed by ventricular systole where the ventricles contract and eject blood out of the heart. The cardiac cycle is regulated by the heart's conduction system which coordinates the contractions of the atria and ventricles. It ensures the atria contract before the ventricles so blood is pumped efficiently through the heart and circulatory system with each heartbeat.