Downloaded 119 times
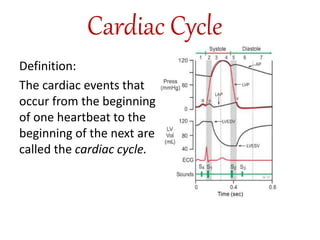
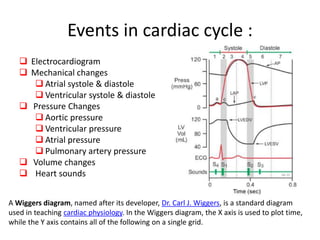
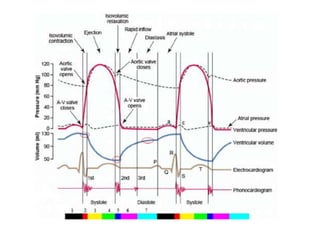
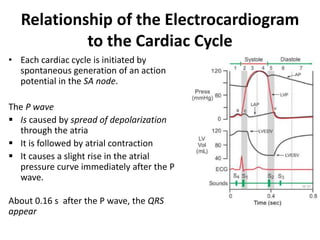
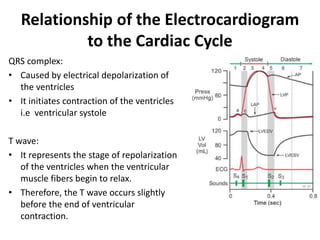
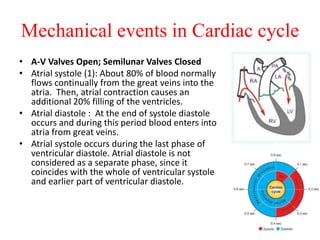
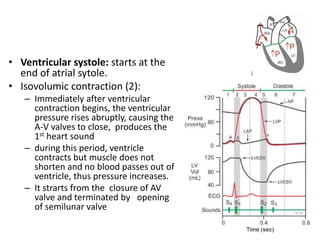
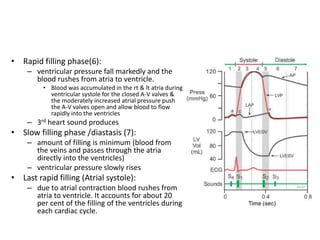
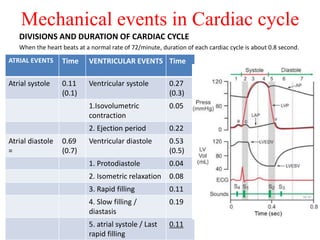
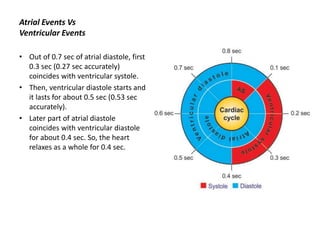
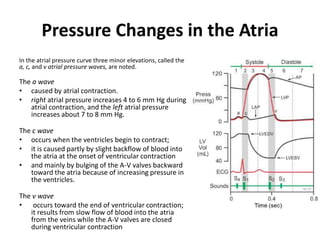
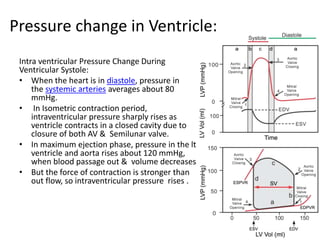
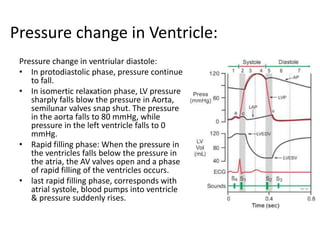


The cardiac cycle describes the sequence of events that occur with each heartbeat. It involves mechanical, electrical, and pressure changes in the heart. The cycle begins with ventricular relaxation and atrial filling in diastole. Upon electrical stimulation, the ventricles contract in systole to pump blood out of the heart. This is accompanied by characteristic pressure and volume changes in the chambers as well as events on an electrocardiogram like the P, QRS, and T waves. The cycle repeats with each heartbeat to sustain blood circulation.


![CTEV [ clubfoot] DR ARUN LAL ,DR MOHAMED ASHRAF travancore medical college k...](https://cdn.slidesharecdn.com/ss_thumbnails/ctevclubfootdrarunlaldrmohamedashraftravancoremedicalcollegekollamkeralaindia-260208063247-18fc466c-thumbnail.jpg?width=640&height=640&fit=bounds)


