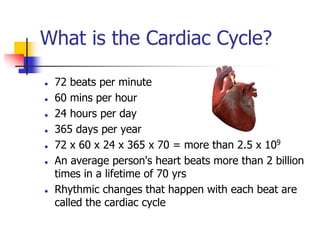
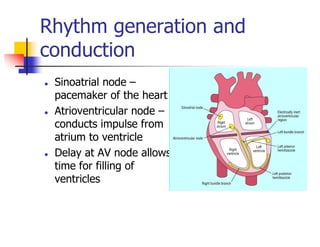
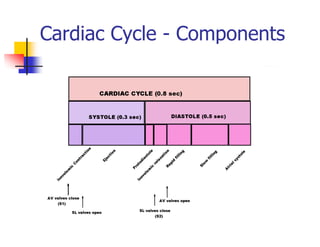
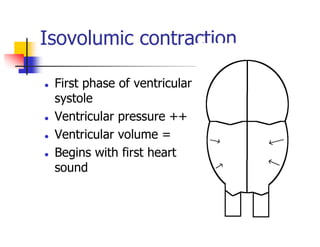
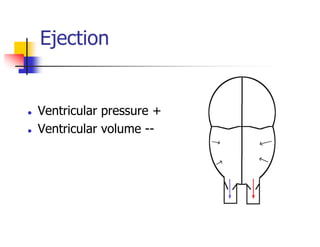
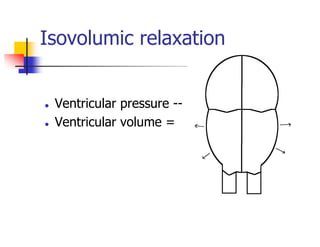
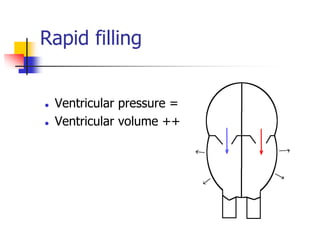
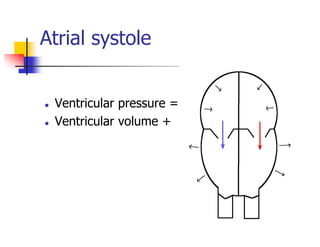
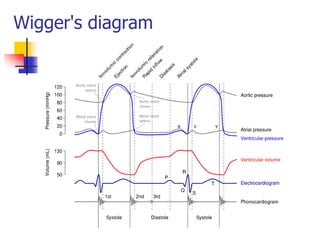
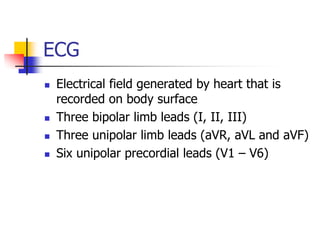
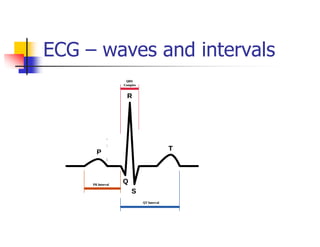
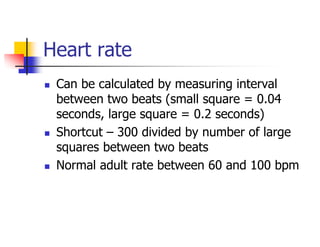
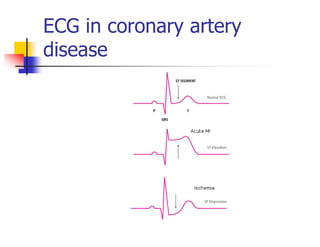
Cardiac Cycle, Heart Sounds and
Electrocardiography
Velvizhi G (world’s best sister !!)
Cardiac Cycle
What is the Cardiac Cycle?
72 beats per minute
60 mins per hour
24 hours per day
365 days per year
72 x 60 x 24 x 365 x 70 = more than 2.5 x 10⁹
An average person's heart beats more than 2 billion
times in a lifetime of 70 yrs
Rhythmic changes that happen with each beat are
called the cardiac cycle
Cardiac Anatomy in brief
Two atria and two ventricles
Ventricles – main pumping
chamber
Atria – reservoir / booster
pump
Atrioventricular valves –
allow flow from atrium to
ventricle only
Semilunar valves – allows
flow from ventricle to great
artery only
Rhythm generation and
conduction
Sinoatrial node –
pacemaker of the heart
Atrioventricular node –
conducts impulse from
atrium to ventricle
Delay at AV node allows
time for filling of
ventricles
Cardiac Cycle - Components
Isovolumic contraction
First phase of ventricular
systole
Ventricular pressure ++
Ventricular volume =
Begins with first heart
sound
Ejection
Ventricular pressure +
Ventricular volume --
Protodiastole
Sometimes named as a separate phase
Continuing ejection before closure of the
semilunar valves
Isovolumic relaxation
Ventricular pressure --
Ventricular volume =
Rapid filling
Ventricular pressure =
Ventricular volume ++
Slow filling (diastasis)
Ventricular pressure =
Ventricular volume +
Atrial systole
Ventricular pressure =
Ventricular volume +
Wigger's diagram
Heart Sounds
Heart sounds
Sounds produced by the beating heart
Turbulent blood flow when valves close
Usually listened with a stethoscope
Very useful for physician to identify
cardiac abnormalities
Heart Sounds
First heart sound (S1)
Second heart sound (S2)
Third heart sound (S3)
Fourth heart sound (S4)
Murmurs
First heart sound
Produced by closure of atrioventricular
valves at beginning of systole
Mitral (M1) and tricuspid (T1) valve
closures very close together – so usually
not appreciated separately
First heart sound
Soft
Rheumatic fever
Heart failure
Loud
Mitral stenosis
Anemia
Pregnancy
Variable intensity
Complete heart block
Atrial fibrillation
Second heart sound
Produced by closure of the semilunar
valves at the end of systole
Closure of the aortic valve (A2) occurs
before closure of the pulmonary valve
(P2)
A2-P2 can be heard as a split and this is
wider during inspiration
Second heart sound
Wide split
Pulmonary stenosis
Pulmonary hypertension
Right bundle branch block
Wide and fixed split
Atrial septal defect
Reversed split (paradoxical split)
Severe aortic stenosis
Hypertrophic cardiomyopathy
Loud P2
Pumonary hypertension
Third heart sound
Low frequency sound in early diastole
Due to rapid filling of the ventricles
S3
May be normal (physiologic)
Ventricular dysfunction
Pregnancy, anemia
Left to right shunts
Fourth heart sound
Low frequency sound in late diastole
Due to filling during atrial systole
S4
May be normal in older individuals
LV S4 – aortic stenosis, systemic hypertension, coronary
artery disease
RV S4 – pulmonary stenosis, pulmonary hypertension
Murmurs
A series of vibrations arising from the
turbulent flow of blood across valves or other
openings
Systolic – after S1 and before S2
Diastolic – after S2 and before S1
Murmurs
Systolic murmurs
Normal (innocent murmur)
Ejection across semilunar valves - pulmonary stenosis,
aortic stenosis
Regurgitation (leak) across atrioventricular valves –
mitral regurgitation, tricuspid regurgitation
Ventricular septal defect
Diastolic murmurs
Always abnormal
Aortic or pulmonary regurgitation
Mitral or aortic stenosis
Murmurs due to valve disease
Systolic Diastolic
Basics of ECG
ECG
Electrical field generated by heart that is
recorded on body surface
Three bipolar limb leads (I, II, III)
Three unipolar limb leads (aVR, aVL and aVF)
Six unipolar precordial leads (V1 – V6)
ECG – waves and intervals
Heart rate
Can be calculated by measuring interval
between two beats (small square = 0.04
seconds, large square = 0.2 seconds)
Shortcut – 300 divided by number of large
squares between two beats
Normal adult rate between 60 and 100 bpm
P wave
Atrial depolarization
Tall P wave – Right atrial enlargement
Broad P wave – Left atrial enlargement
QRS complex
Ventricular depolarization
Broad QRS
Bundle branch blocks
Ectopic rhythms (Ventricular tachycardia,
ventricular pacing)
T wave
Ventricular repolarization
Tall T waves – Hyperkalemia
T inversion – Coronary artery disease
PR interval
AV conduction
Prolonged PR interval – First degree AV
block
Short PR interval - Preexcitation
QT interval
Ventricular repolarization
Prolonged QT interval
Congenital long QT syndrome
Acquired long QT - drugs
ECG in coronary artery
disease
Most important clinical use of ECG
ST segment shifts identify ischemia and
infarction
Q waves indicate old infarction
ECG in coronary artery
disease

cardiac cycle,heart sounds and ECG

  • 1.
    Cardiac Cycle, HeartSounds and Electrocardiography Velvizhi G (world’s best sister !!)
  • 2.
  • 3.
    What is theCardiac Cycle? 72 beats per minute 60 mins per hour 24 hours per day 365 days per year 72 x 60 x 24 x 365 x 70 = more than 2.5 x 10⁹ An average person's heart beats more than 2 billion times in a lifetime of 70 yrs Rhythmic changes that happen with each beat are called the cardiac cycle
  • 4.
    Cardiac Anatomy inbrief Two atria and two ventricles Ventricles – main pumping chamber Atria – reservoir / booster pump Atrioventricular valves – allow flow from atrium to ventricle only Semilunar valves – allows flow from ventricle to great artery only
  • 5.
    Rhythm generation and conduction Sinoatrialnode – pacemaker of the heart Atrioventricular node – conducts impulse from atrium to ventricle Delay at AV node allows time for filling of ventricles
  • 6.
    Cardiac Cycle -Components
  • 7.
    Isovolumic contraction First phaseof ventricular systole Ventricular pressure ++ Ventricular volume = Begins with first heart sound
  • 8.
  • 9.
    Protodiastole Sometimes named asa separate phase Continuing ejection before closure of the semilunar valves
  • 10.
  • 11.
    Rapid filling Ventricular pressure= Ventricular volume ++
  • 12.
    Slow filling (diastasis) Ventricularpressure = Ventricular volume +
  • 13.
  • 14.
  • 15.
  • 16.
    Heart sounds Sounds producedby the beating heart Turbulent blood flow when valves close Usually listened with a stethoscope Very useful for physician to identify cardiac abnormalities
  • 17.
    Heart Sounds First heartsound (S1) Second heart sound (S2) Third heart sound (S3) Fourth heart sound (S4) Murmurs
  • 18.
    First heart sound Producedby closure of atrioventricular valves at beginning of systole Mitral (M1) and tricuspid (T1) valve closures very close together – so usually not appreciated separately
  • 19.
    First heart sound Soft Rheumaticfever Heart failure Loud Mitral stenosis Anemia Pregnancy Variable intensity Complete heart block Atrial fibrillation
  • 20.
    Second heart sound Producedby closure of the semilunar valves at the end of systole Closure of the aortic valve (A2) occurs before closure of the pulmonary valve (P2) A2-P2 can be heard as a split and this is wider during inspiration
  • 21.
    Second heart sound Widesplit Pulmonary stenosis Pulmonary hypertension Right bundle branch block Wide and fixed split Atrial septal defect Reversed split (paradoxical split) Severe aortic stenosis Hypertrophic cardiomyopathy Loud P2 Pumonary hypertension
  • 22.
    Third heart sound Lowfrequency sound in early diastole Due to rapid filling of the ventricles S3 May be normal (physiologic) Ventricular dysfunction Pregnancy, anemia Left to right shunts
  • 23.
    Fourth heart sound Lowfrequency sound in late diastole Due to filling during atrial systole S4 May be normal in older individuals LV S4 – aortic stenosis, systemic hypertension, coronary artery disease RV S4 – pulmonary stenosis, pulmonary hypertension
  • 24.
    Murmurs A series ofvibrations arising from the turbulent flow of blood across valves or other openings Systolic – after S1 and before S2 Diastolic – after S2 and before S1
  • 25.
    Murmurs Systolic murmurs Normal (innocentmurmur) Ejection across semilunar valves - pulmonary stenosis, aortic stenosis Regurgitation (leak) across atrioventricular valves – mitral regurgitation, tricuspid regurgitation Ventricular septal defect Diastolic murmurs Always abnormal Aortic or pulmonary regurgitation Mitral or aortic stenosis
  • 26.
    Murmurs due tovalve disease Systolic Diastolic
  • 27.
  • 28.
    ECG Electrical field generatedby heart that is recorded on body surface Three bipolar limb leads (I, II, III) Three unipolar limb leads (aVR, aVL and aVF) Six unipolar precordial leads (V1 – V6)
  • 29.
    ECG – wavesand intervals
  • 30.
    Heart rate Can becalculated by measuring interval between two beats (small square = 0.04 seconds, large square = 0.2 seconds) Shortcut – 300 divided by number of large squares between two beats Normal adult rate between 60 and 100 bpm
  • 31.
    P wave Atrial depolarization TallP wave – Right atrial enlargement Broad P wave – Left atrial enlargement
  • 32.
    QRS complex Ventricular depolarization BroadQRS Bundle branch blocks Ectopic rhythms (Ventricular tachycardia, ventricular pacing)
  • 33.
    T wave Ventricular repolarization TallT waves – Hyperkalemia T inversion – Coronary artery disease
  • 34.
    PR interval AV conduction ProlongedPR interval – First degree AV block Short PR interval - Preexcitation
  • 35.
    QT interval Ventricular repolarization ProlongedQT interval Congenital long QT syndrome Acquired long QT - drugs
  • 36.
    ECG in coronaryartery disease Most important clinical use of ECG ST segment shifts identify ischemia and infarction Q waves indicate old infarction
  • 37.
    ECG in coronaryartery disease